Interval score as a measure of uncertainty quantification quality #1
Description
Based on materialsproject/matbench#99 (comment)
Interval score is a robust metric for measuring the quality of uncertainty quantification, which incorporates both interval width and "coverage". Interval width is the width of the uncertainty bars. Coverage is related to falling inside the confidence bounds or not. These are competing ideas, which is part of why the interval score is an effective metric.
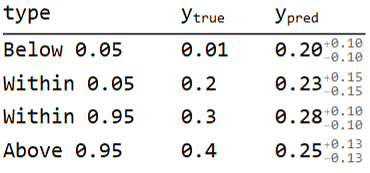
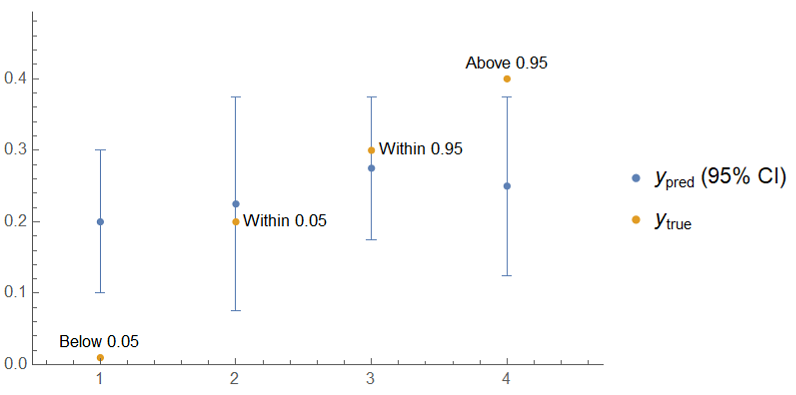
To illustrate interval scores, take the following true and predicted (with 95% CI) values which represent four distinct cases to consider when computing the interval score: below 0.05, within 0.05, within 0.95, and above 0.95.
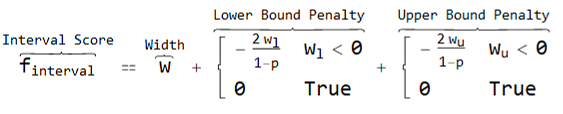
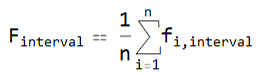
The interval score ($f_{interval}$) is the sum of three parts:
- the width of the confidence interval (
$w$) - a penalty for the true value being below the lower confidence bound (
$w_l$) - a penalty for the true value being above the upper confidence bound (
$w_u$)
and is analytically expressed as:
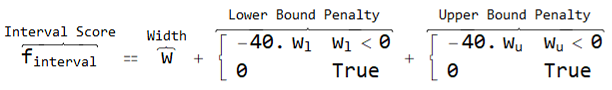
In the case of 95% confidence intervals, this simplifies to:
Note that when the true point falls outside of the confidence interval, the corresponding (sub)width is negative. The more negative the (sub)width, the higher the penalty. However, when the true point is within the confidence interval, the penalty is 0.
In other words, the full width of the interval should be as small as possible while having the true value coincide with the confidence interval or being as close to it as possible. The factor 2/(1-p) comes from eq.(61) of DOI: 10.1198/016214506000001437 to address a paradox/mistake(?) in a previously suggested score (eq.(60)).
For the data I mentioned, here's what the calculation of the interval score looks like:
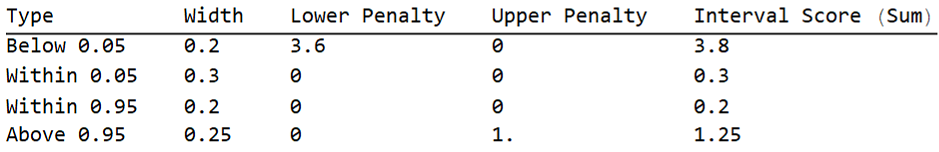
Notice that, as mentioned before, the lower penalties and upper penalties are 0 if the true value is within the confidence interval and that below 0.05 has a larger penalty than above 0.95 because it's further below the lower bound than above 0.95 is above the upper bound.
The mean interval score is then just the mean of the interval scores for each of the predictions, which for this data is 1.3875, where a lower score is better.
If we were to multiply the targets and uncertainties by a constant, say 10, this would scale each of the interval scores by 10, so the mean interval score would be 13.875. In other words, the score is robust to the choice of units for the target property, and the score retains the same units as the target, similar to MAE.
This can be compared to two baselines:
- dummy model (constant standard deviation of the target values)
- bootstrap-estimated uncertainties of random forest
This makes it fairly straightforward and actionable to interpret because it gives things relative scales:
- Did a particular model improve the uncertainty quantification quality above that of the dummy model?
- Was it any better than bootstrapped random forest? (notorious for overconfidence in extrapolated values)
Related discussion:
A while back, a concern was brought up about the interval score not being 100% separate from MAE. A simple alternative is related is miscalibration error at 95%, mentioned at materialsproject/matbench#110 (comment). I think either would be good choices, where I still lean towards interval score (perhaps because I don't mind it being somewhat correlated with MAE / I think it's still applicable to adaptive design).
The uncertainty-toolbox's implementation is here: https://github.com/uncertainty-toolbox/uncertainty-toolbox/blob/6ea1fed6591923a95d49d8049a197e33d4d8092d/uncertainty_toolbox/metrics_scoring_rule.py#L145
We'd only be calculating for 95% rather than scanning. While we might be able to install uncertainty-toolbox and use the function directly (setting lower and upper p to 95), it's simple enough that we could add directly here, unless we want to use other metrics or certain visualizations from the toolbox. We would also need to provide the ability to convert from standard deviation to 95% interval, as shown in this PR.