Follow link to have a glance at the complete project Read More
It was exciting to start a career in data analysis, but I had a lot of questions. In addition to the various jobs related to “data analytics” I found out which regions of the world has the highest data analyst job demand, which would result in higher pay and better working conditions. What distinguishes working as a data analyst as an entry, junior, or senior levels in a company. We will also observe the requirements needed to be hired in any of the job levels. 🚀 📈 ### Languages and Tools 👨💻
Languages| Languages | Usage |
|---|---|
Python 3.11.0 |
Programming Language For data cleaning |
SQL (Structure query Language) |
Programming Language For manipulation and visualization |
Tools| Tools & Environment | Usage |
|---|---|
SQL Server |
Data cleaning. |
Jupyter NoteBook |
An open-source IDE used to create the Jupyter document. |
Power BI (Power query, DAX) |
Data visualization tool. |
Git |
A version control system to manage and keep track source code history. |
BeautifulSoupfor data scraping.requeststo verify website server the status.numpyfor mathematical operations on arrays.datetimefor date manipulation.pandasto perform data manipulation and analysis.seabornfor data visualization and exploratory data analysis.plotlyto create beautiful interactive web-based visualizations.plotly expresseasy-to-use, high-level interface to Plotly.
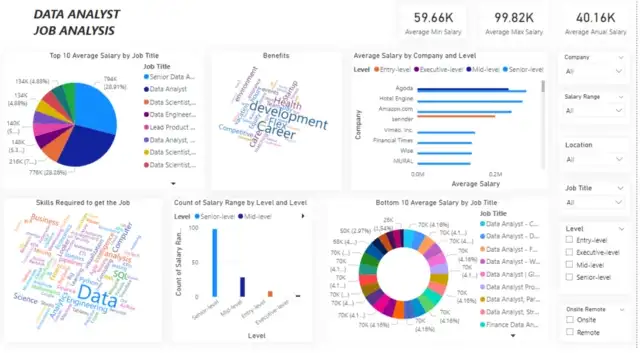
Job Title— The name of the available jobCompany Name— The name of the company with the job vacancyLocation— It contains the Physical Location of the company and if the job is remoteLevel— It’s the Job level, if it is a junior, mid or senior roleJob Type— Is the job a full-time or internship roleSalary Range— The pay range (some columns are in yearly range, while some are in hourly range)Required Skills— Necessary skills an applicant must have before applyingBenefits— The benefits that comes with the job
-
Which skills are the most demanded among companies, relative to the Level of employment (Senior, Mid, Executive, Entry)?
-
which data analytics related position and level has the highest job placements?
-
Which job type is suitable (Full time, Part time, Hybrid)?
-
How likely is it to be employed as a remote or onsite analyst?
-
Which companies have the highest number of job posts?
Dont forget to have a glance at the Complete Project Read More
To run the (.ipynb) file, use Notebook or Google Colab, Power BI for the (.PBIX) file and sql server to run the sql queries.
For support, email njimonda.co@gmail.com.
Contributions are always welcome!
Please adhere to this project's code of conduct.