Home
Welcome to the CTC15 wiki!
A key component of the weekend was discussion around how data from sensors makes its way onto the network and then to the various collection sites. As part of our efforts to understand this, we put together a diagram of the information as we understand it.
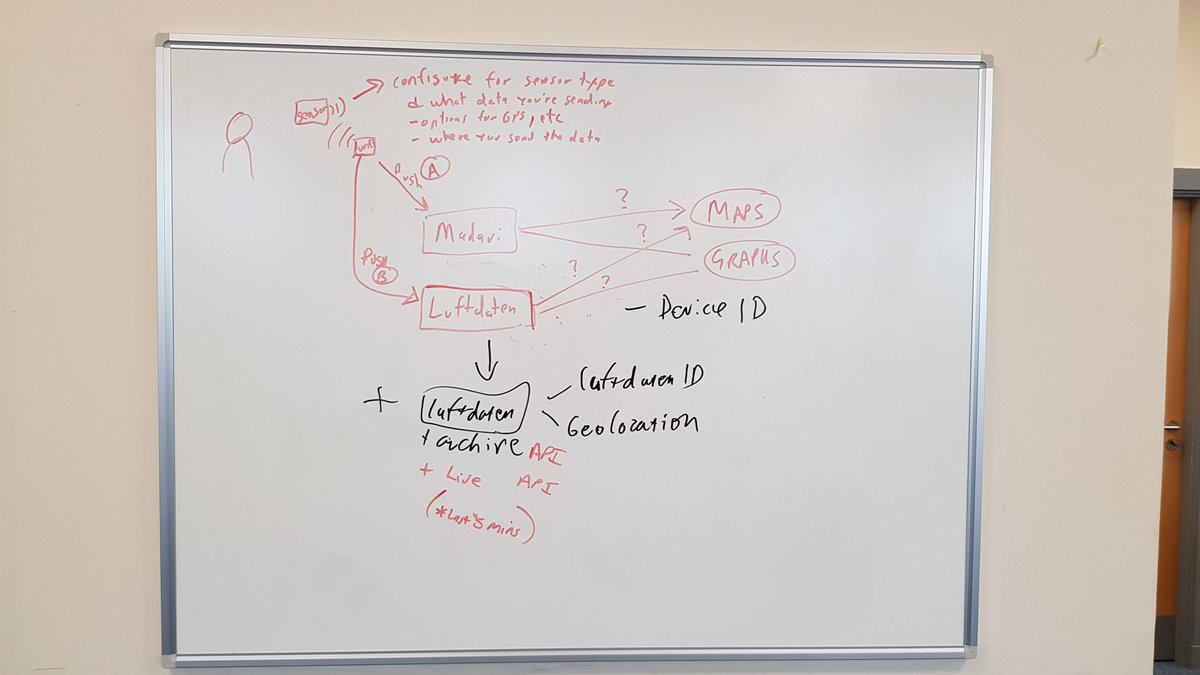
The data is sent from your sensor to your local wifi where it is sent onward to both Madavi and Luftdaten, and from there you can then pull down various maps, graphs and archived data. You can also gather up 'live' data from the last five minutes.
Madavi-apihttps://github.com/opendata-stuttgart/madavi-api
Luftdaten-api https://github.com/opendata-stuttgart/feinstaub-api
DEFRA - https://uk-air.defra.gov.uk/data/flat_files?site_id=ABD
Feinstaub - http://united-kingdom.maps.luftdaten.info/#13/57.1482/-2.0792
Pollution forecast - https://uk-air.defra.gov.uk/forecasting/locations?q=aberdeen
Scottish air quality - http://www.scottishairquality.scot/latest/ Looks like this is the "master" official data source and other sites are pulling from it.
Ian github - https://github.com/watty62/abdn_air_quality
Real time Air Quality Index - https://aqicn.org/city/united-kingdom/aberdeen/
Scottish Pollutant Release Inventory- http://apps.sepa.org.uk/spripa/Search/ByLocalAuthority/Criteria.aspx
Scottish Pollutant Release Inventory (location of polluters) - http://www.scottishairquality.scot/data/emissions
Aberdeen City traffic count for 2000 to 2017 - https://www.dft.gov.uk/traffic-counts/area.php?region=Scotland&la=Aberdeen+City
OpenWeatherMap, API for open weather data - https://openweathermap.org/api
Aberdeen City traffic count on map - https://www.dft.gov.uk/traffic-counts/cp.php?la=Aberdeen+City