-
Notifications
You must be signed in to change notification settings - Fork 9
/
Copy pathREADME.Rmd
171 lines (157 loc) · 8.29 KB
/
README.Rmd
1
2
3
4
5
6
7
8
9
10
11
12
13
14
15
16
17
18
19
20
21
22
23
24
25
26
27
28
29
30
31
32
33
34
35
36
37
38
39
40
41
42
43
44
45
46
47
48
49
50
51
52
53
54
55
56
57
58
59
60
61
62
63
64
65
66
67
68
69
70
71
72
73
74
75
76
77
78
79
80
81
82
83
84
85
86
87
88
89
90
91
92
93
94
95
96
97
98
99
100
101
102
103
104
105
106
107
108
109
110
111
112
113
114
115
116
117
118
119
120
121
122
123
124
125
126
127
128
129
130
131
132
133
134
135
136
137
138
139
140
141
142
143
144
145
146
147
148
149
150
151
152
153
154
155
156
157
158
159
160
161
162
163
164
165
166
167
168
169
170
171
---
title: "Mario Kart 64 🍄"
output: github_document
editor_options:
chunk_output_type: console
---
```{r setup, include=FALSE}
knitr::opts_chunk$set(echo = TRUE)
library(fontawesome)
```
## Double-Dumbbell Plot by Cédric Scherer
```{r, eval=FALSE}
library(tidyverse)
library(ggtext)
library(here)
library(ragg)
theme_set(theme_minimal(base_family = "Atlantis", base_size = 13))
theme_update(
plot.margin = margin(25, 15, 15, 25),
plot.background = element_rect(color = "#FFFCFC", fill = "#FFFCFC"),
panel.grid.major.x = element_line(color = "grey94"),
panel.grid.major.y = element_blank(),
panel.grid.minor = element_blank(),
axis.text = element_text(family = "Hydrophilia Iced"),
axis.text.x = element_text(color = "grey40"),
axis.text.y = element_blank(),
axis.title = element_blank(),
axis.ticks = element_blank(),
legend.position = c(.07, .31),
legend.title = element_text(color = "grey40", family = "Overpass", angle = 90, hjust = .5),
legend.text = element_text(color = "grey40", family = "Hydrophilia Iced", size = 12),
legend.box = "horizontal",
legend.box.just = "bottom",
legend.margin = margin(0, 0, 0, 0),
legend.spacing = unit(.6, "lines"),
plot.title = element_text(family = "Atlantis Headline", face = "bold", size = 17.45),
plot.subtitle = element_textbox_simple(family = "Overpass", color = "grey40", size = 10.8,
lineheight = 1.3, margin = margin(t = 5, b = 30)),
plot.caption = element_text(family = "Overpass", color = "grey55",
size = 10.5, margin = margin(t = 20, b = 0, r = 15))
)
## data
df_records <- readr::read_csv('https://raw.githubusercontent.com/rfordatascience/tidytuesday/master/data/2021/2021-05-25/records.csv')
df_rank <-
df_records %>%
filter(type == "Three Lap") %>%
group_by(track) %>%
filter(time == min(time)) %>%
ungroup %>%
arrange(-time) %>%
mutate(track = fct_inorder(track, time))
df_records_three <-
df_records %>%
filter(type == "Three Lap") %>%
mutate(year = lubridate::year(date)) %>%
mutate(track = factor(track, levels = levels(df_rank$track)))
df_connect <-
df_records_three %>%
group_by(track, type, shortcut) %>%
summarize(no = min(time), yes = max(time)) %>%
pivot_longer(cols = -c(track, type, shortcut),
names_to = "record", values_to = "time") %>%
filter((shortcut == "No" & record == "no") | (shortcut == "Yes" & record == "yes")) %>%
pivot_wider(id_cols = c(track), values_from = time, names_from = record)
df_longdist <-
df_records_three %>%
filter(shortcut == "No") %>%
group_by(track) %>%
filter(time == min(time) | time == max(time)) %>%
mutate(group = if_else(time == min(time), "min", "max")) %>%
group_by(track, group) %>%
arrange(time) %>%
slice(1) %>%
group_by(track) %>%
mutate(year = max(year)) %>%
pivot_wider(id_cols = c(track, year), values_from = time, names_from = group) %>%
mutate(diff = max - min)
df_shortcut <-
df_records_three %>%
filter(shortcut == "Yes") %>%
group_by(track) %>%
filter(time == min(time) | time == max(time)) %>%
mutate(group = if_else(time == min(time), "min", "max")) %>%
group_by(track, group) %>%
arrange(time) %>%
slice(1) %>%
group_by(track) %>%
mutate(year = max(year)) %>%
pivot_wider(id_cols = c(track, year), values_from = time, names_from = group) %>%
mutate(diff = max - min)
## plot
df_shortcut %>%
ggplot(aes(min, track)) +
## dotted line connection shortcut yes/no
geom_linerange(data = df_connect, aes(xmin = yes, xmax = no, y = track),
inherit.aes = FALSE, color = "grey75", linetype = "11") +
## segment shortcut yes
geom_linerange(aes(xmin = min, xmax = max, color = diff), size = 2) +
## segment shortcut no
geom_linerange(data = df_longdist, aes(xmin = min, xmax = max, color = diff), size = 2) +
geom_linerange(data = df_longdist, aes(xmin = min, xmax = max), color = "#FFFCFC", size = .8) +
## point shortcut yes – first record
geom_point(aes(x = max), size = 7, color = "#FFFCFC", fill = "grey65", shape = 21, stroke = .7) +
## point shortcut yes – latest record
geom_point(size = 7, color = "#FFFCFC", fill = "#6b7ea6", shape = 21, stroke = .7) +
geom_point(aes(fill = year), size = 7, color = "#FFFCFC", shape = 21, stroke = .7) +
## point shortcut no – first record
geom_point(data = df_longdist, aes(fill = year), size = 5.6, shape = 21,
color = "#FFFCFC", stroke = .5) +
geom_point(data = df_longdist, size = 3, color = "#FFFCFC") +
## point shortcut no – latest record
geom_point(data = df_longdist, aes(x = max), size = 5.6, shape = 21,
fill = "grey65", color = "#FFFCFC", stroke = .5) +
geom_point(data = df_longdist, aes(x = max), size = 3, color = "#FFFCFC") +
## labels tracks
geom_label(aes(label = track), family = "Atlantis", size = 6.6, hjust = 1, nudge_x = -7,
label.size = 0, fill = "#FFFCFC") +
geom_label(data = filter(df_longdist, !track %in% unique(df_shortcut$track)),
aes(label = track), family = "Atlantis", size = 6.6, hjust = 1, nudge_x = -7,
label.size = 0, fill = "#FFFCFC") +
## labels dots shortcut yes
geom_text(data = filter(df_shortcut, track == "Wario Stadium"),
aes(label = "Most recent record\nwith shortcuts"),
family = "Overpass", size = 3.5, color = "#4a5a7b",
lineheight = .8, vjust = 0, nudge_y = .4) +
geom_text(data = filter(df_shortcut, track == "Wario Stadium"),
aes(x = max, label = "First record\nwith shortcuts"),
family = "Overpass", size = 3.5, color = "grey50",
lineheight = .8, vjust = 0, nudge_y = .4) +
## labels dots shortcut no
geom_text(data = filter(df_longdist, track == "Wario Stadium"),
aes(label = "Most recent record\nw/o shortcuts"),
family = "Overpass", size = 3.5, color = "#4a5a7b", lineheight = .8,
vjust = 0, nudge_x = -7, nudge_y = .4) +
geom_text(data = filter(df_longdist, track == "Wario Stadium"),
aes(x = max, label = "First record\nw/o shortcuts"),
family = "Overpass", size = 3.5, color = "grey50", lineheight = .8,
vjust = 0, nudge_x = 7, nudge_y = .4) +
coord_cartesian(xlim = c(-60, 400)) +
scale_x_continuous(breaks = seq(0, 400, by = 50),
labels = function(x) ifelse(x == 0, paste(x, "seconds"), paste(x)),
sec.axis = dup_axis(),
expand = c(.02, .02)) +
scale_y_discrete(expand = c(.07, .07)) +
scale_fill_gradient(low = "#b4d1d2", high = "#242c3c", name = "Year of Record") +
rcartocolor::scale_color_carto_c(palette = "RedOr", limits = c(0, 250),
name = "Time difference between first and most recent record") +
guides(fill = guide_legend(title.position = "left"),
color = guide_colorbar(barwidth = unit(.45, "lines"), barheight = unit(22, "lines"),
title.position = "left")) +
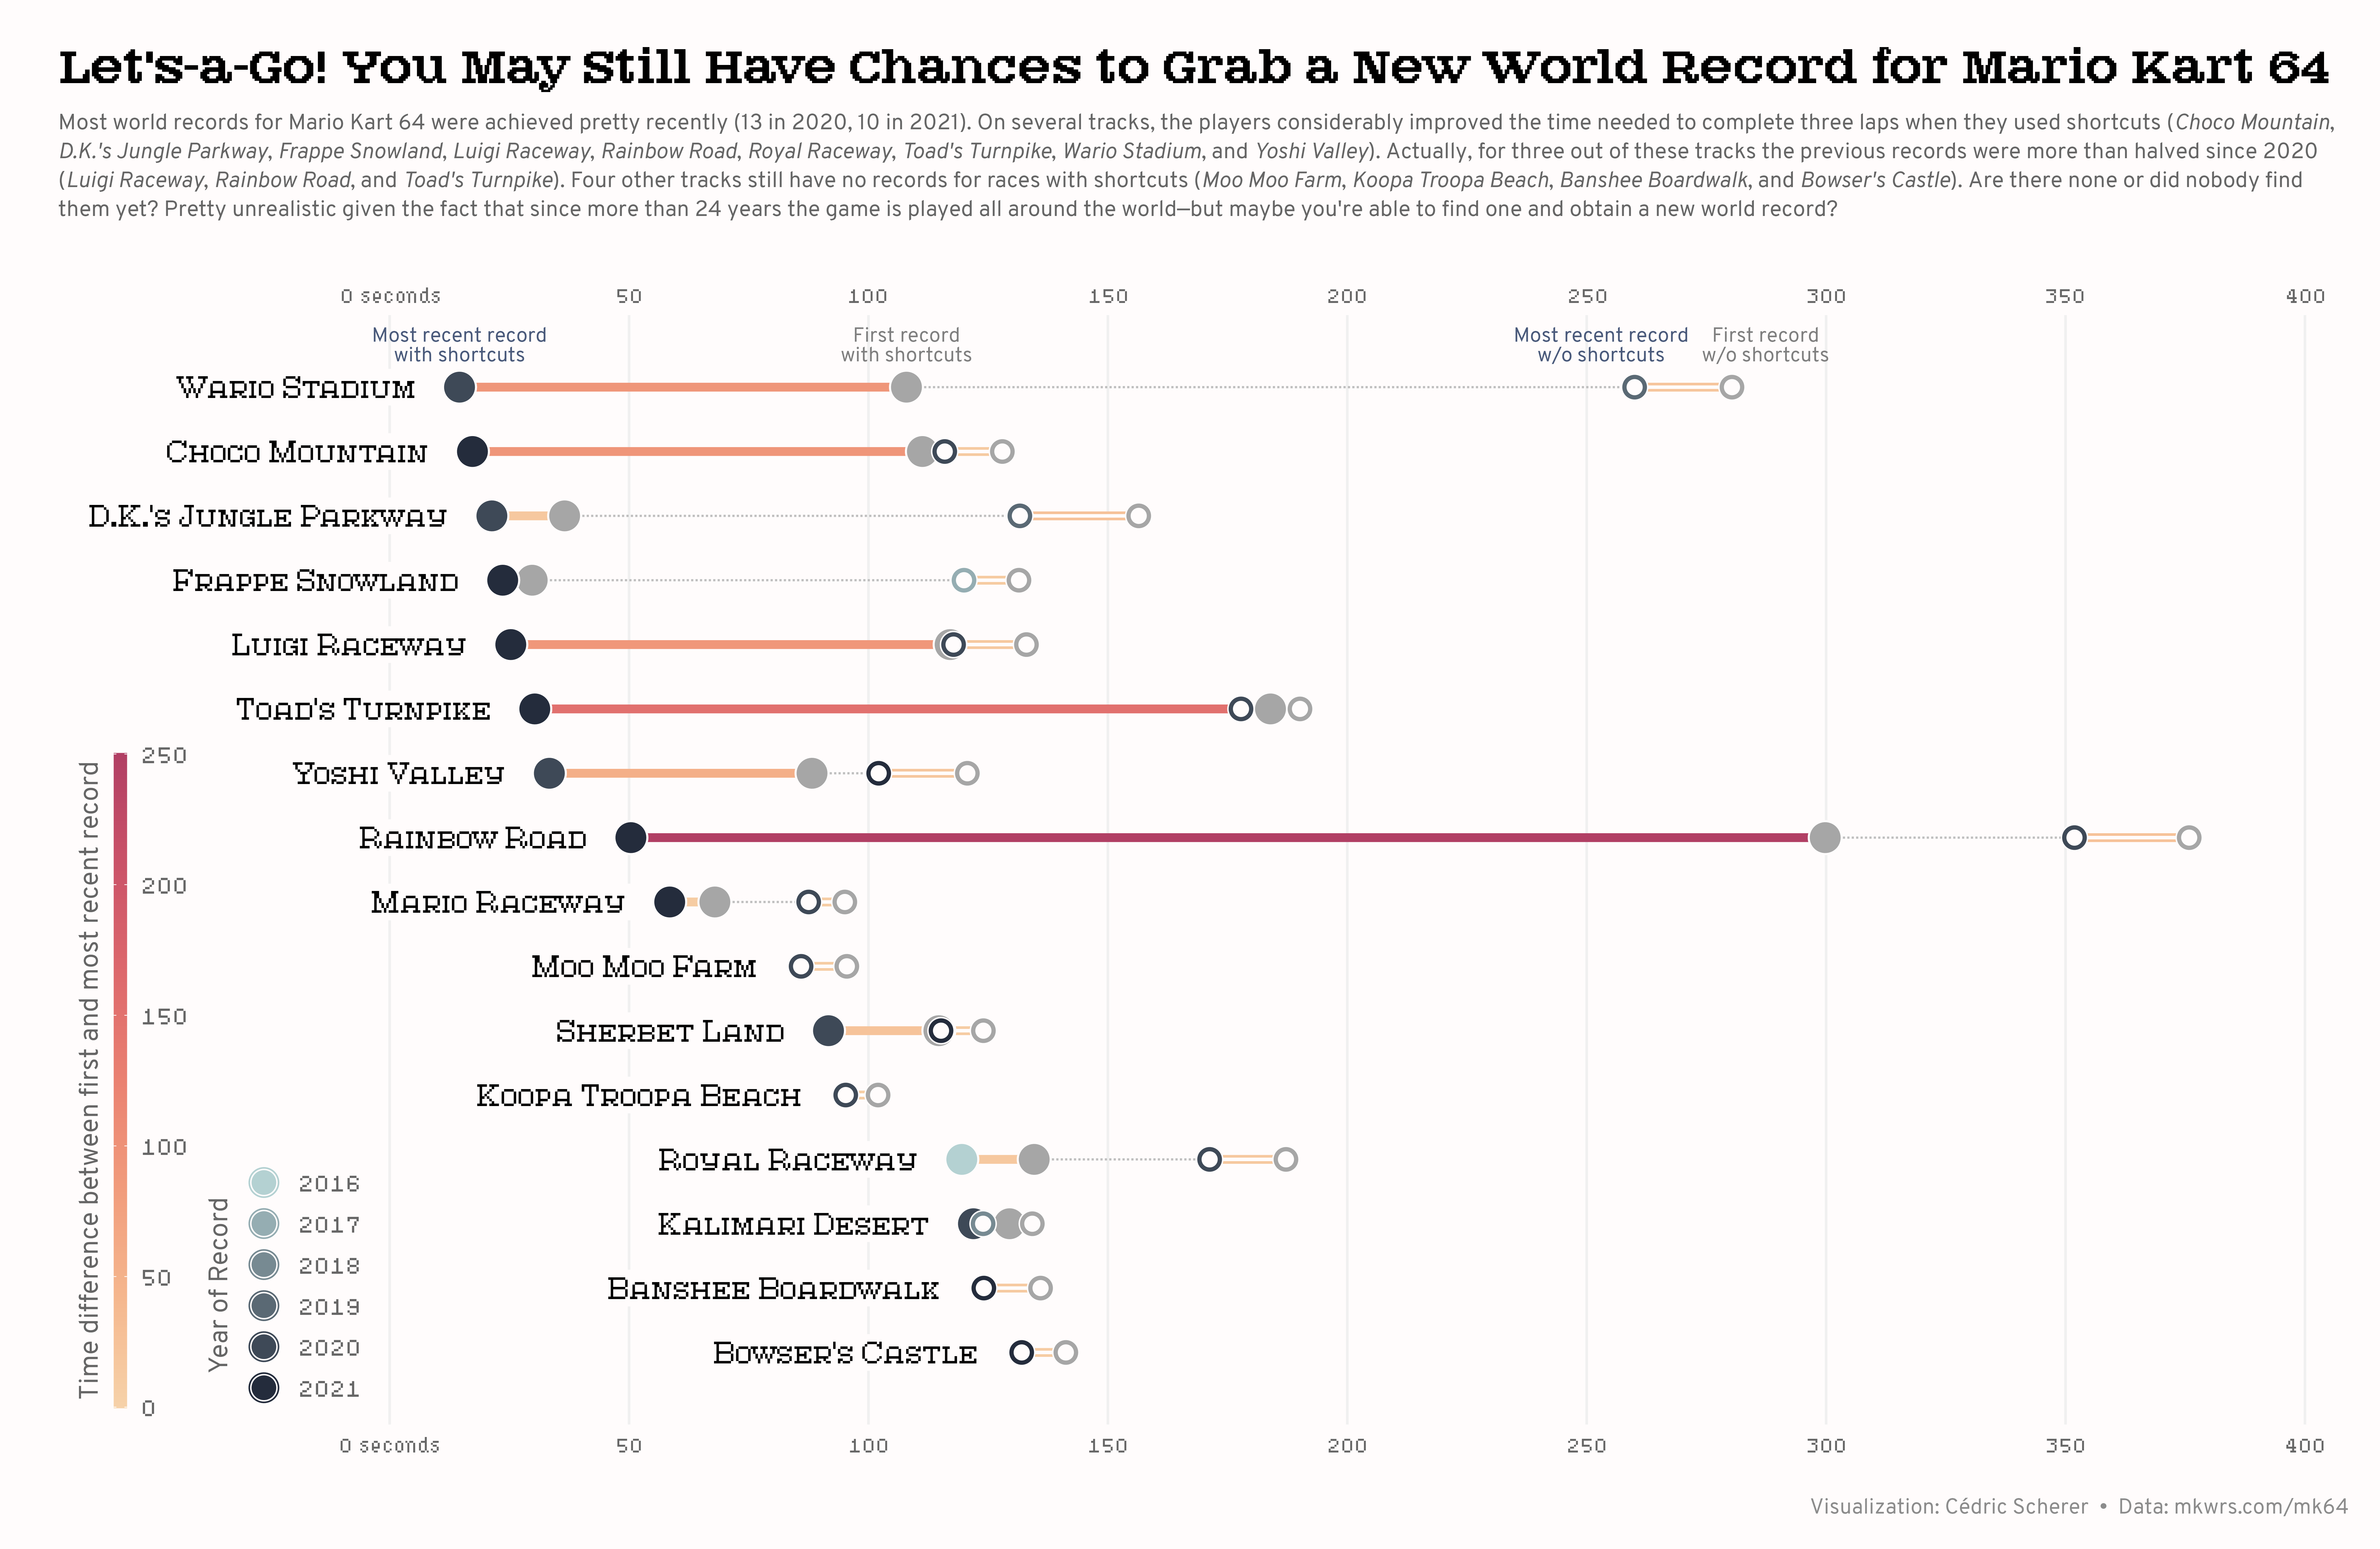
labs(title = "Let's-a-Go! You May Still Have Chances to Grab a New World Record for Mario Kart 64",
subtitle = "Most world records for Mario Kart 64 were achieved pretty recently (13 in 2020, 10 in 2021). On several tracks, the players considerably improved the time needed to complete three laps when they used shortcuts (*Choco Mountain*, *D.K.'s Jungle Parkway*, *Frappe Snowland*, *Luigi Raceway*, *Rainbow Road*, *Royal Raceway*, *Toad's Turnpike*, *Wario Stadium*, and *Yoshi Valley*). Actually, for three out of these tracks the previous records were more than halved since 2020 (*Luigi Raceway*, *Rainbow Road*, and *Toad's Turnpike*). Four other tracks still have no records for races with shortcuts (*Moo Moo Farm*, *Koopa Troopa Beach*, *Banshee Boardwalk*, and *Bowser's Castle*). Are there none or did nobody find them yet? Pretty unrealistic given the fact that since more than 24 years the game is played all around the world—but maybe you're able to find one and obtain a new world record?",
caption = "Visualization: Cédric Scherer • Data: mkwrs.com/mk64")
ggsave(here::here("plots", "2021_22", "2021_22_MarioKart.png"),
width = 7990, height = 5200, res = 500, device = agg_png, limitsize = FALSE)
```