Home
Postdoctoral Researcher, Department of Computer Science, National Chiao-Tung University, Hsinchu, Taiwan
BIPAC has been published in IEEE EMBC 2015 [1] and the paper was awarded as the open finalist of student paper competition. It is a seed-based imaging method to estimate the phase-amplitude coupling (PAC) between seed activity and the activity of other regions. The program of BIPAC from has been written as a plug-in of the Matlab Software Brainstorm. Please download the program of BIPAC from Github: https://github.com/Hui-Ling/BeamformerSourceImaging. The .m files should be placed in the following folder: $HOME\.brainstorm\process.
Please download the example data here: Tutorial_FingerLifting.zip.
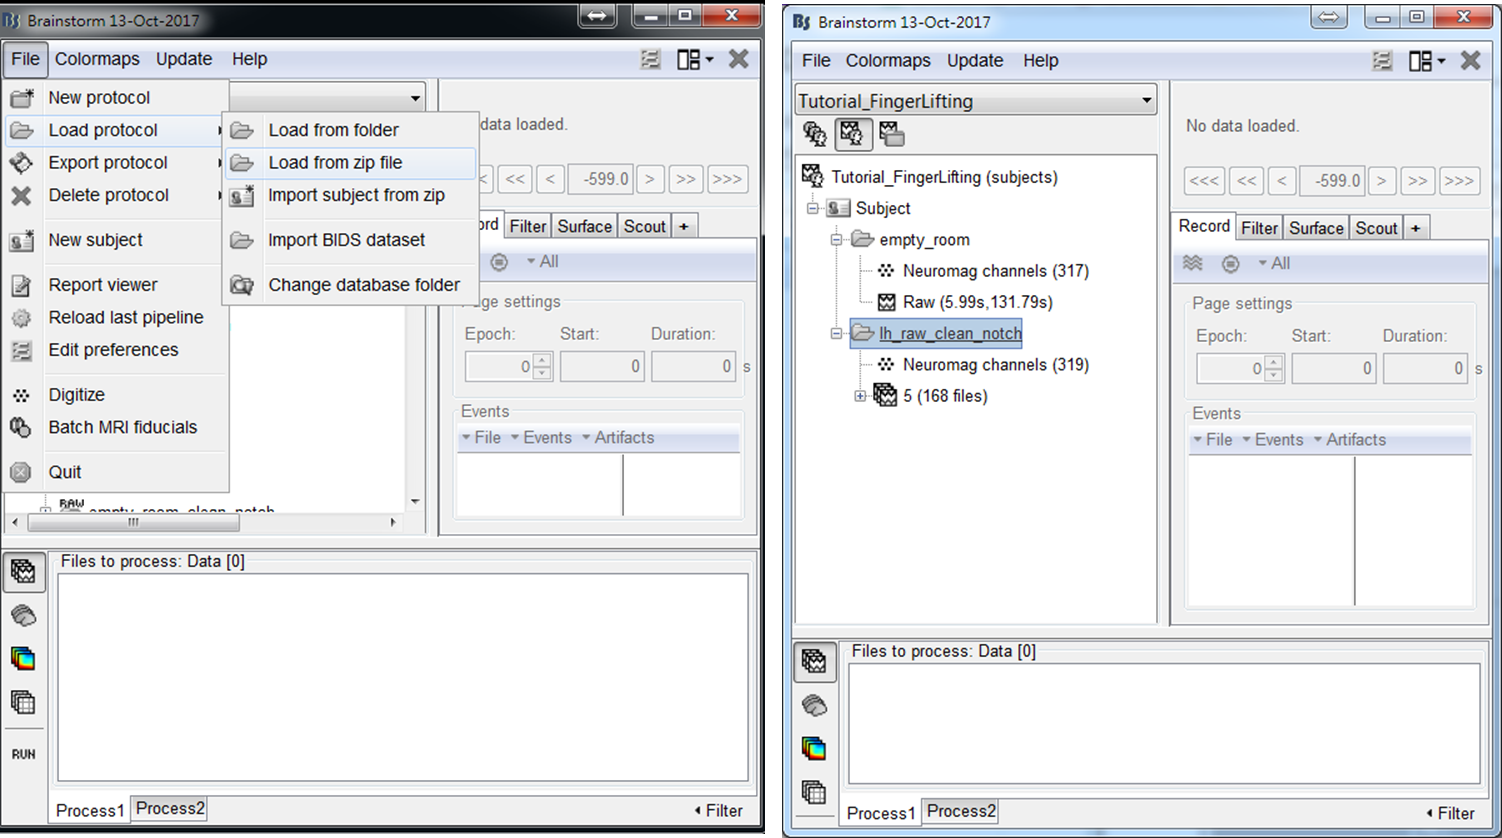
The MEG data used in this tutorial was acquired by Elekta Neuromag Vector View 306 Channel MEG during a self-paced finger lifting experiment, which has been used to demonstrate the accuracy of maximum contrast beamformer (MCB) [2]. An empty-room MEG data is also included, which has been processed by using Apply SSP & CTF compensation in Brainstorm. The anatomy data used in this tutorial is the MRI template Colin27, which is built in Brainstorm. To load the example data into Brainstorm, select File > Load from zip file and then select Tutorial_FingerLifting.zip. A subject containing empty-room data and finger-lifting data will be shown in the data explorer window.
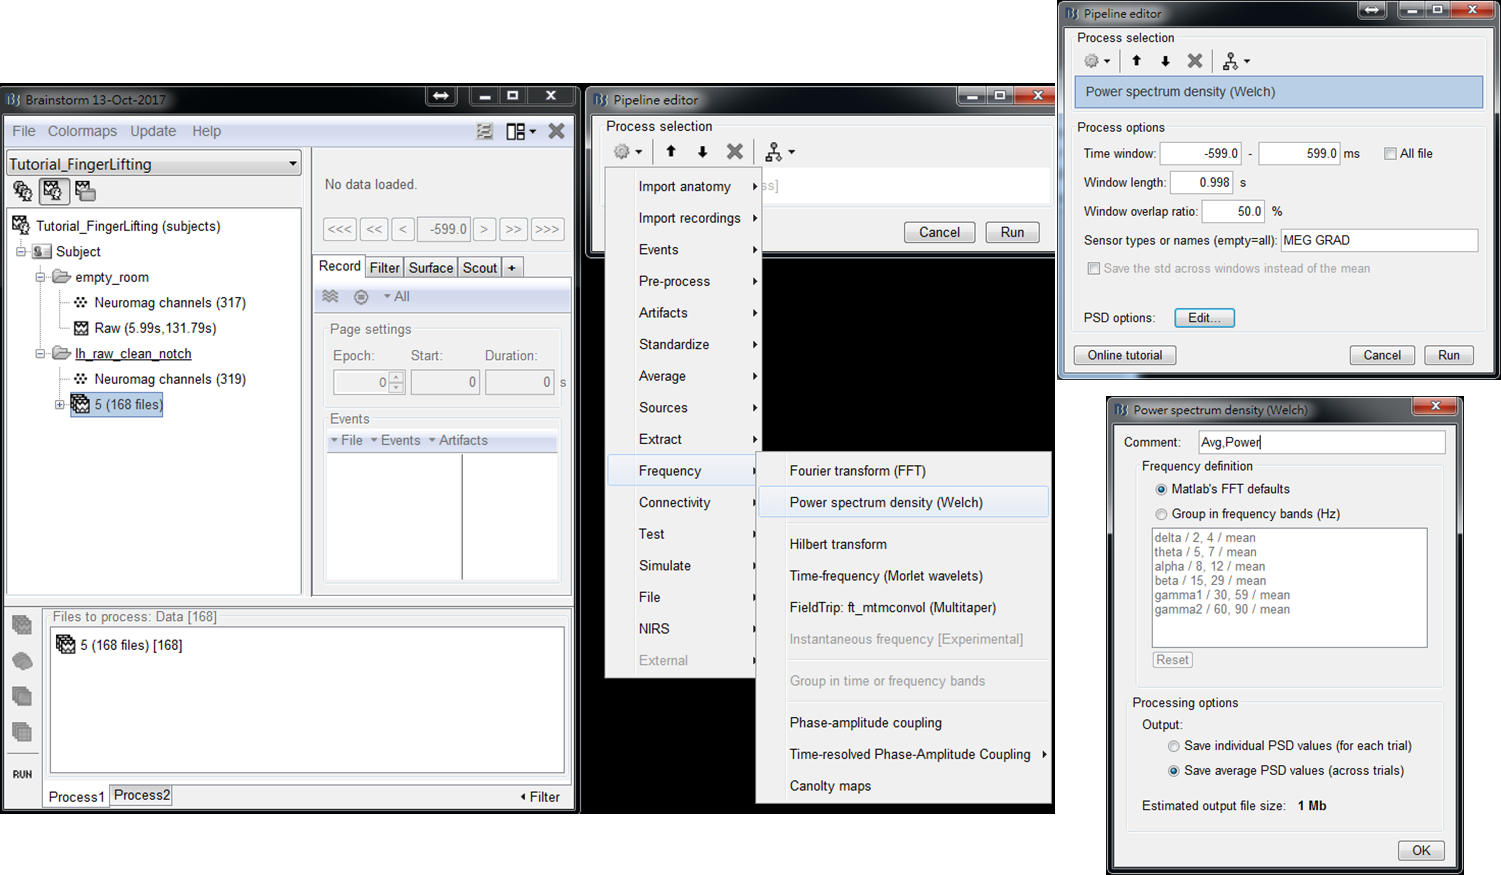
- Step1: Drag trials of preprocessed MEG trials to input window, and press RUN
- Step2: Select Frequency > Power spectrum density (Welch) > Edit (PSD options). Set output to save average PSD values (across trials) to reduce the data size of output results. Then press OK and press Run.
- Step3: Double click on the output file PSD: 1/1000ms Avg, Power (MEG GRAD) to show power spectrum density. Then right-click on the figure and select 2D Sensor cap.
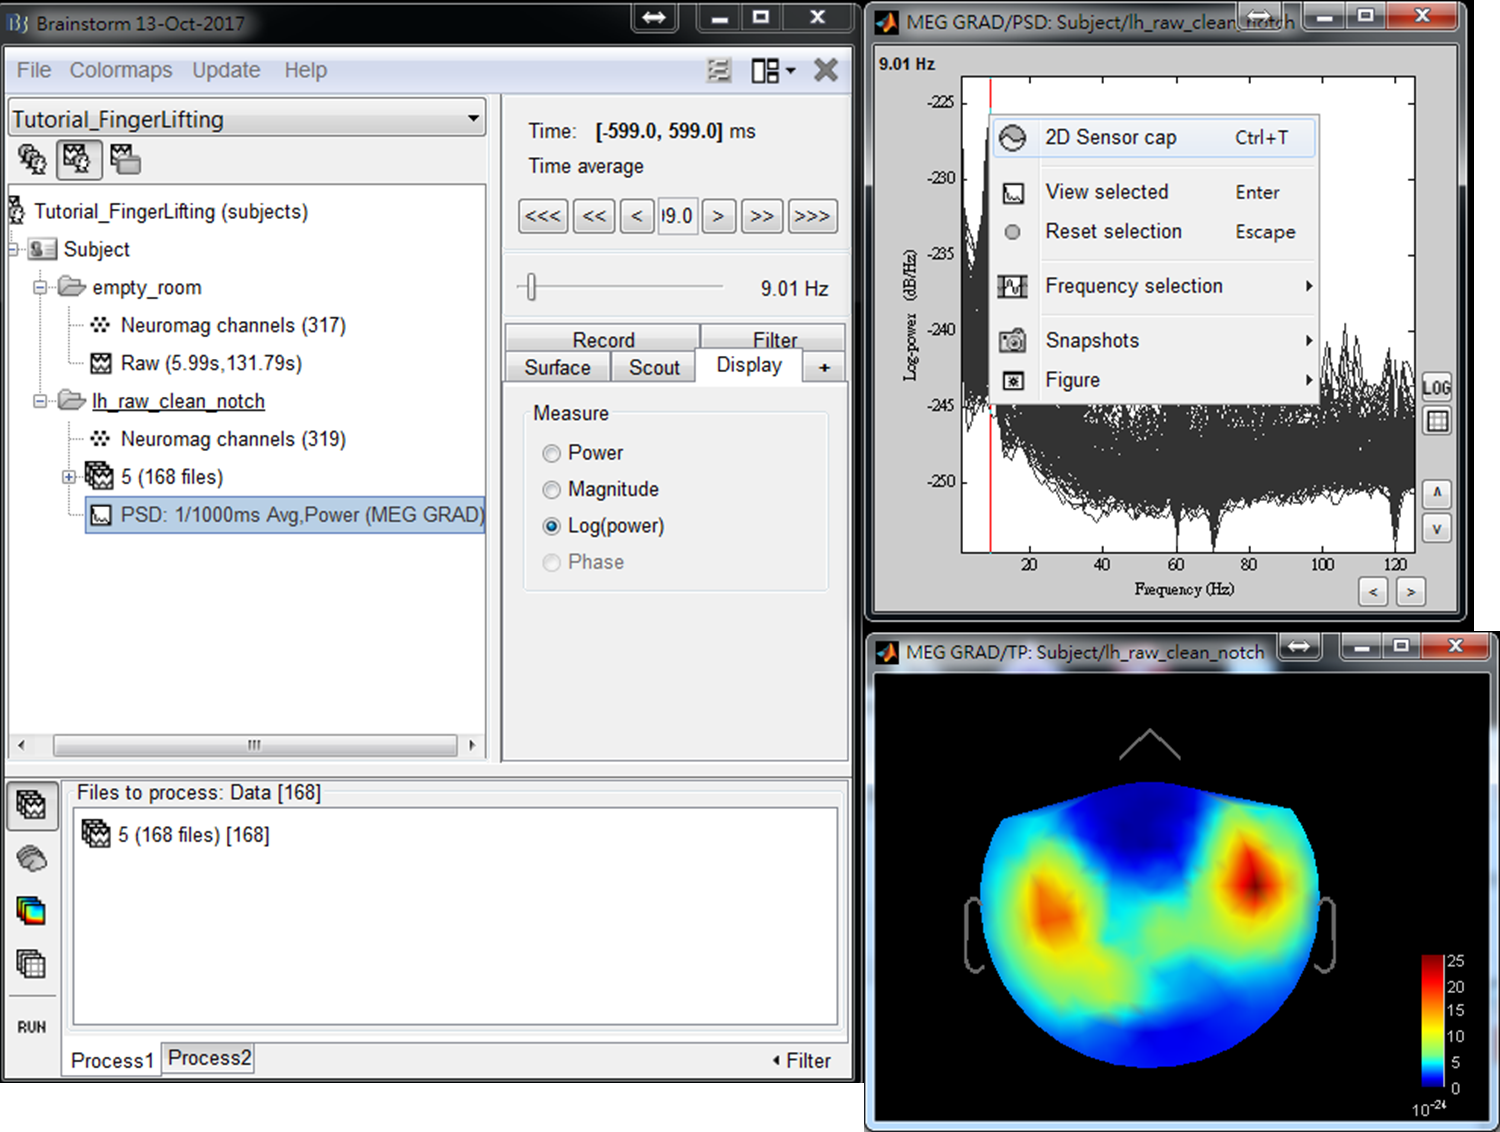
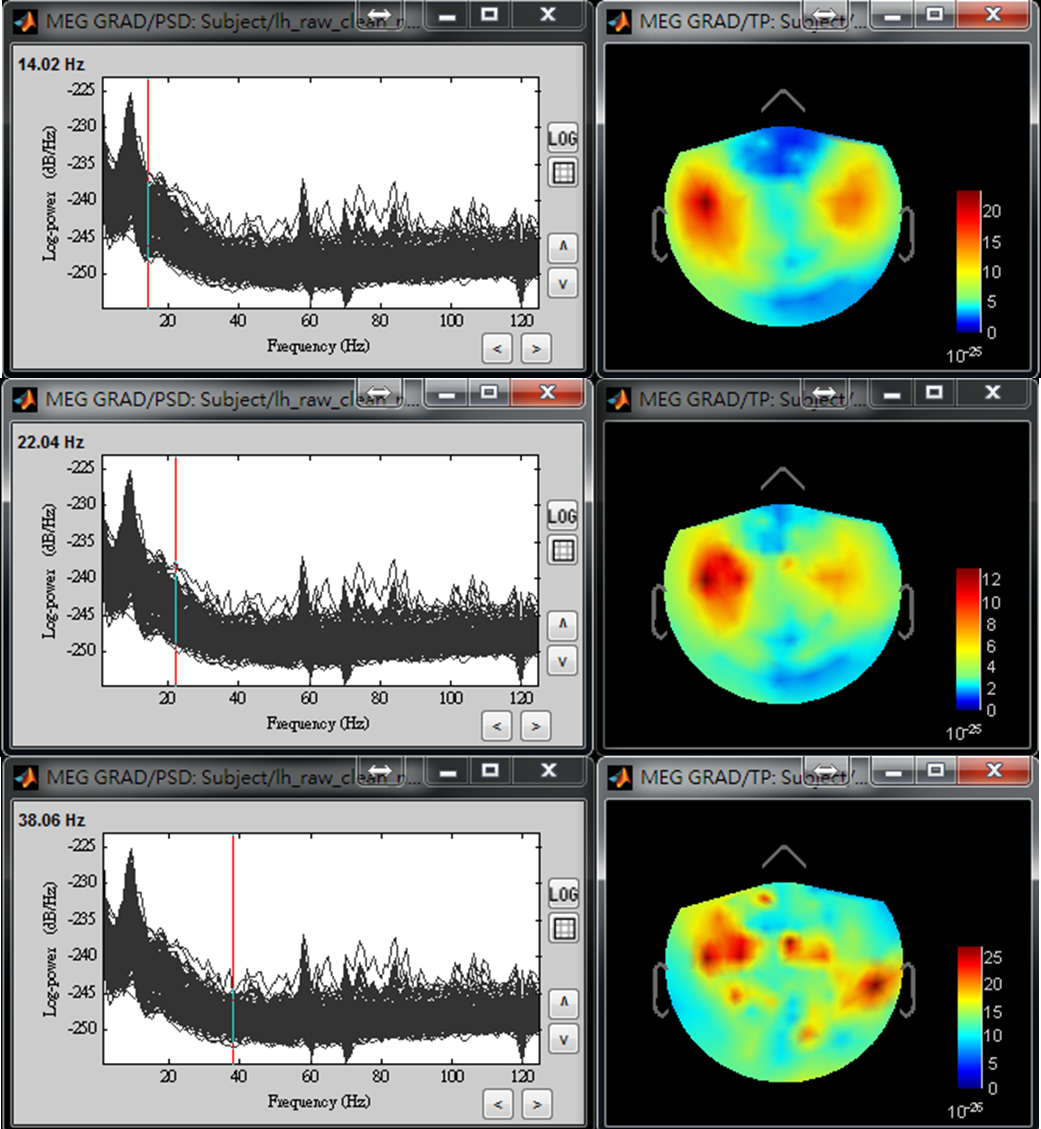
- Step4: Use left or right arrow on keyboard to show the power distributed on the 2D sensor cap for a different frequency. Find the frequency bands that you are interested in for further cross-frequency analysis.
- Step1: Drag trials of preprocessed MEG trials to input window, and press RUN
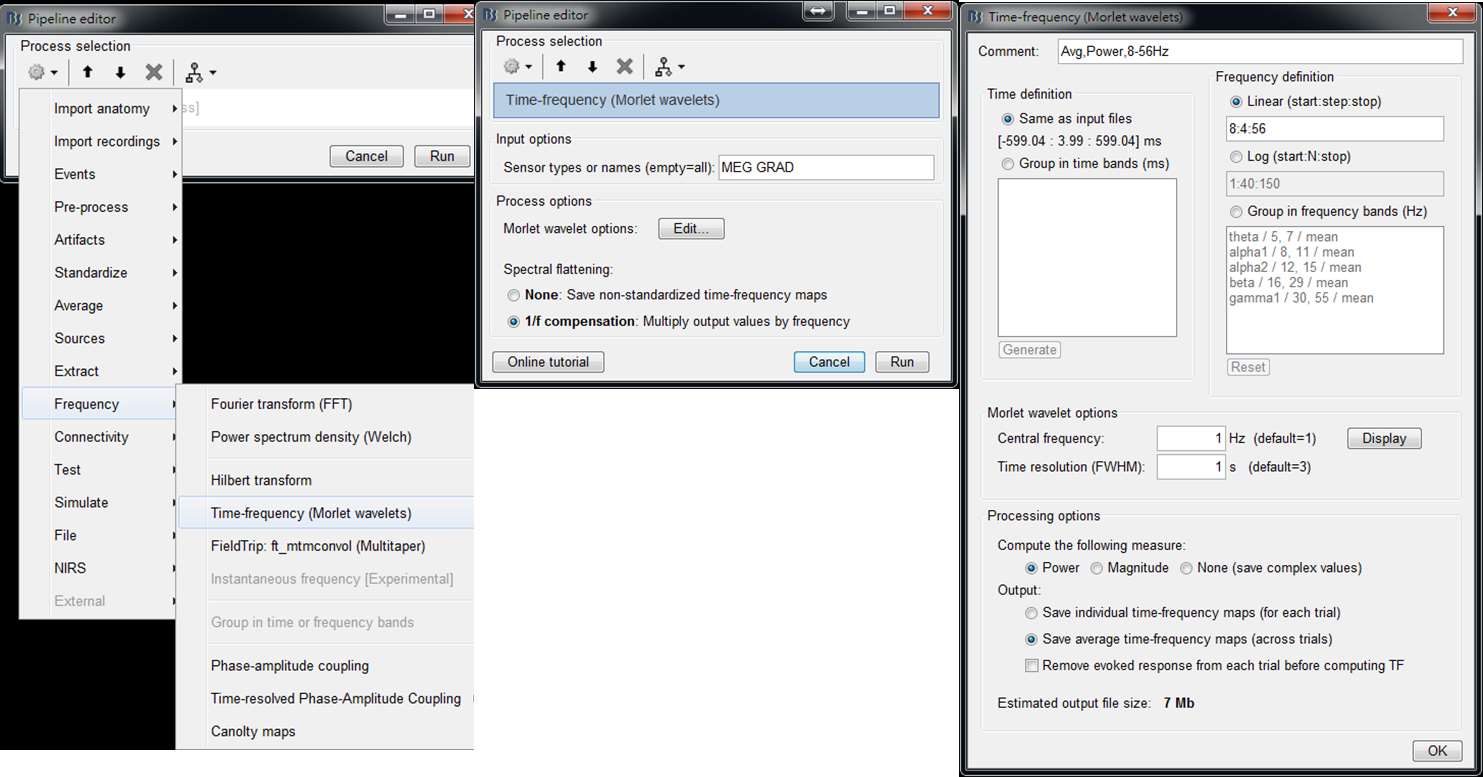
- Step2: Select Frequency > Time-Frequency (Morlet wavelets) and then set spectrual flattening to 1/f compensation. Then edit Morlet wavelet options: Set output to save average time-frequency maps (across trials) to reduce the data size of output results. Then press OK and press Run.
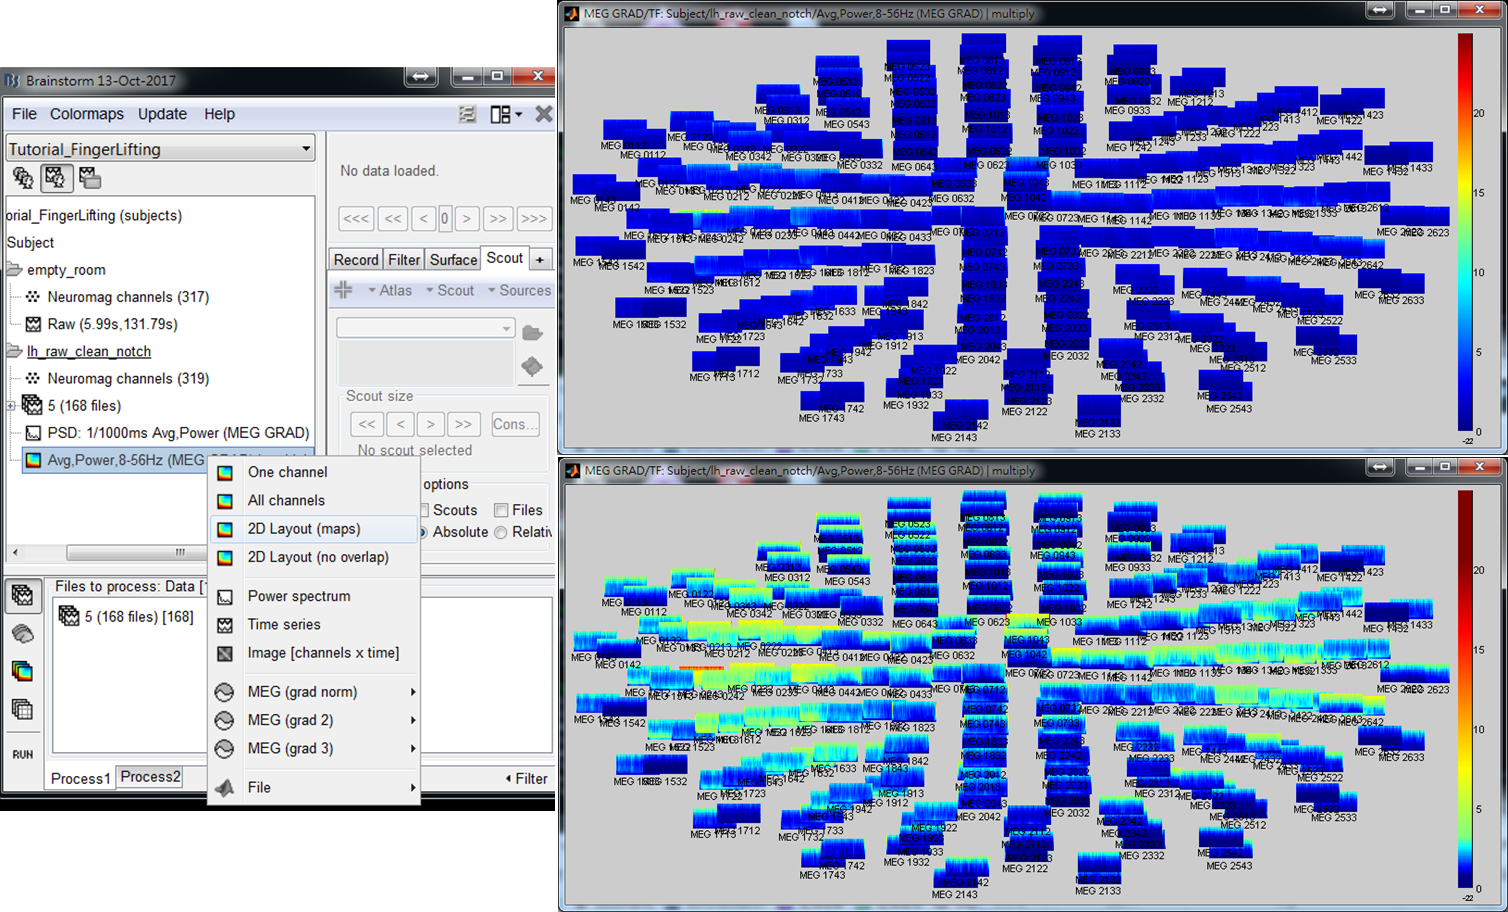
- Step 3: Right-click on the output file and select 2D Layout (maps) from the popup window. Then the time-frequnecy maps of all GRAD channels will be displayed. You may left-click and move-down or -up to change the colormap.
- Step 4: Left-click on any of the time-frequency map to individually display the map in a new window. Find the frequency bands that you are interested in for further cross-frequency analysis.
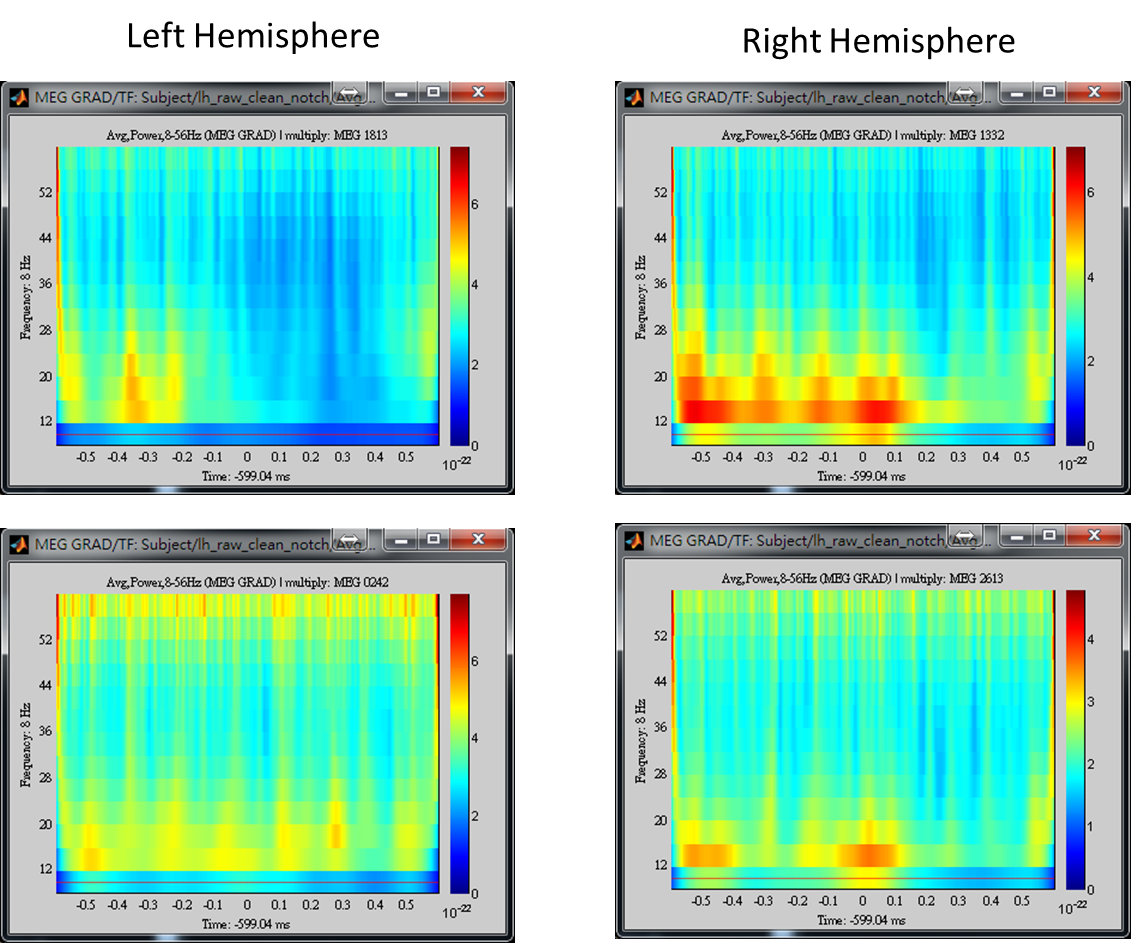
The above results demonstrate that high gamma activity in the sensorimotor area may couple to the alpha and beta activity in the same area or other areas. We will first select a seed based on the peak location of gamma brain activity within the sensorimotor area, and then estimate cortical distributions of seed-based alpha-gamma and beta-gamma PAC.
(Covariance Matrix of MEG/EEG data during Control State)
[1] Chan, H.-L., Y.-S. Chen, L.-F. Chen, and S. Baillet (2015b), 'Beamformer-based imaging of phase-amplitude coupling using electromagnetic brain activity', 37th Conf. Proc. IEEE Eng. Med. Biol. Soc. (Milan, Italy), 7558-61.
[2] Chen, Y.-S., C.-Y. Cheng, J.-C. Hsieh, and L.-F. Chen (2006), 'Maximum contrast beamformer for electromagnetic mapping of brain activity', IEEE Trans. Biomed., 53 (9), 1765-74.