| title | datePublished | cuid | slug | cover | ogImage | tags |
|---|---|---|---|---|---|---|
SigNoz - A complete setup tour with Logs |
Mon Feb 12 2024 08:06:30 GMT+0000 (Coordinated Universal Time) |
clsinhi37000208jq3eu27dp9 |
signoz-a-complete-setup-tour-with-logs |
opensource, monitoring, devops, logging, signoz, monitoring-tool |
It is a tedious task to go inside the server every time to check the logs, metrics, health and performance, etc.
Monitoring tools are essential for managing and maintaining the health and performance of our projects, especially as their number grows. We can have a centralised visibility, proactive issue detection, performance optimization, troubleshooting & debugging and many more.
So using tools can save a lot of time and effort.
There are plenty of the monitoring tools available for us to use. Following are the list of quite famous and most used tools .
-
ELK
-
Grafana
-
Datadog
-
New Relic
-
Dynatrace
-
Zabbix
-
Nagios
Before choosing this, we tried ELK and noticed some parameters which is tough to manage, like
-
complete setup requires four components to successfully run elk (Elasticsearch, Logstash, Kibana & Filebeat).
-
running four components also leads to increase in cost of the overall server.
-
we have to invest the resources in operating and maintaining a production-grade ELK stack which makes it hard to manage at scale.
-
So, signoz solves all these major problems quite smoothly.
SigNoz, a lightweight monitoring tool having all the important telemetry signals under a single dashboard leads to less operational overhead.
Prometheus is focused specifically on time-series metrics. SigNoz is using OpenTelemetry which supports metrics, traces, and logs all together.
Grafana offers the LGTM stack (Loki for logs, Grafana for visualization, Tempo for traces, and Mimir for metrics). You need to configure and maintain multiple configurations for a full-stack observability setup.
Whereas SigNoz provides logs, metrics and traces under a single pane of glass.
Loki doesn’t perform well if you want to index and query high-cardinality data. SigNoz uses ClickHouse - a fast open source distributed columnar database.
And if you go with non open source tools like New Relic ,Datadog, you will notice a similar kind of problems of getting huge amounts to pay and you end up paying thousands. It contains no self-hosting, no OpenTelemetry visualisation option. Where signoz does.
This is the part-1 of the series where we will be going on hands-on journey, setting up Docker logs collection for enhanced monitoring.
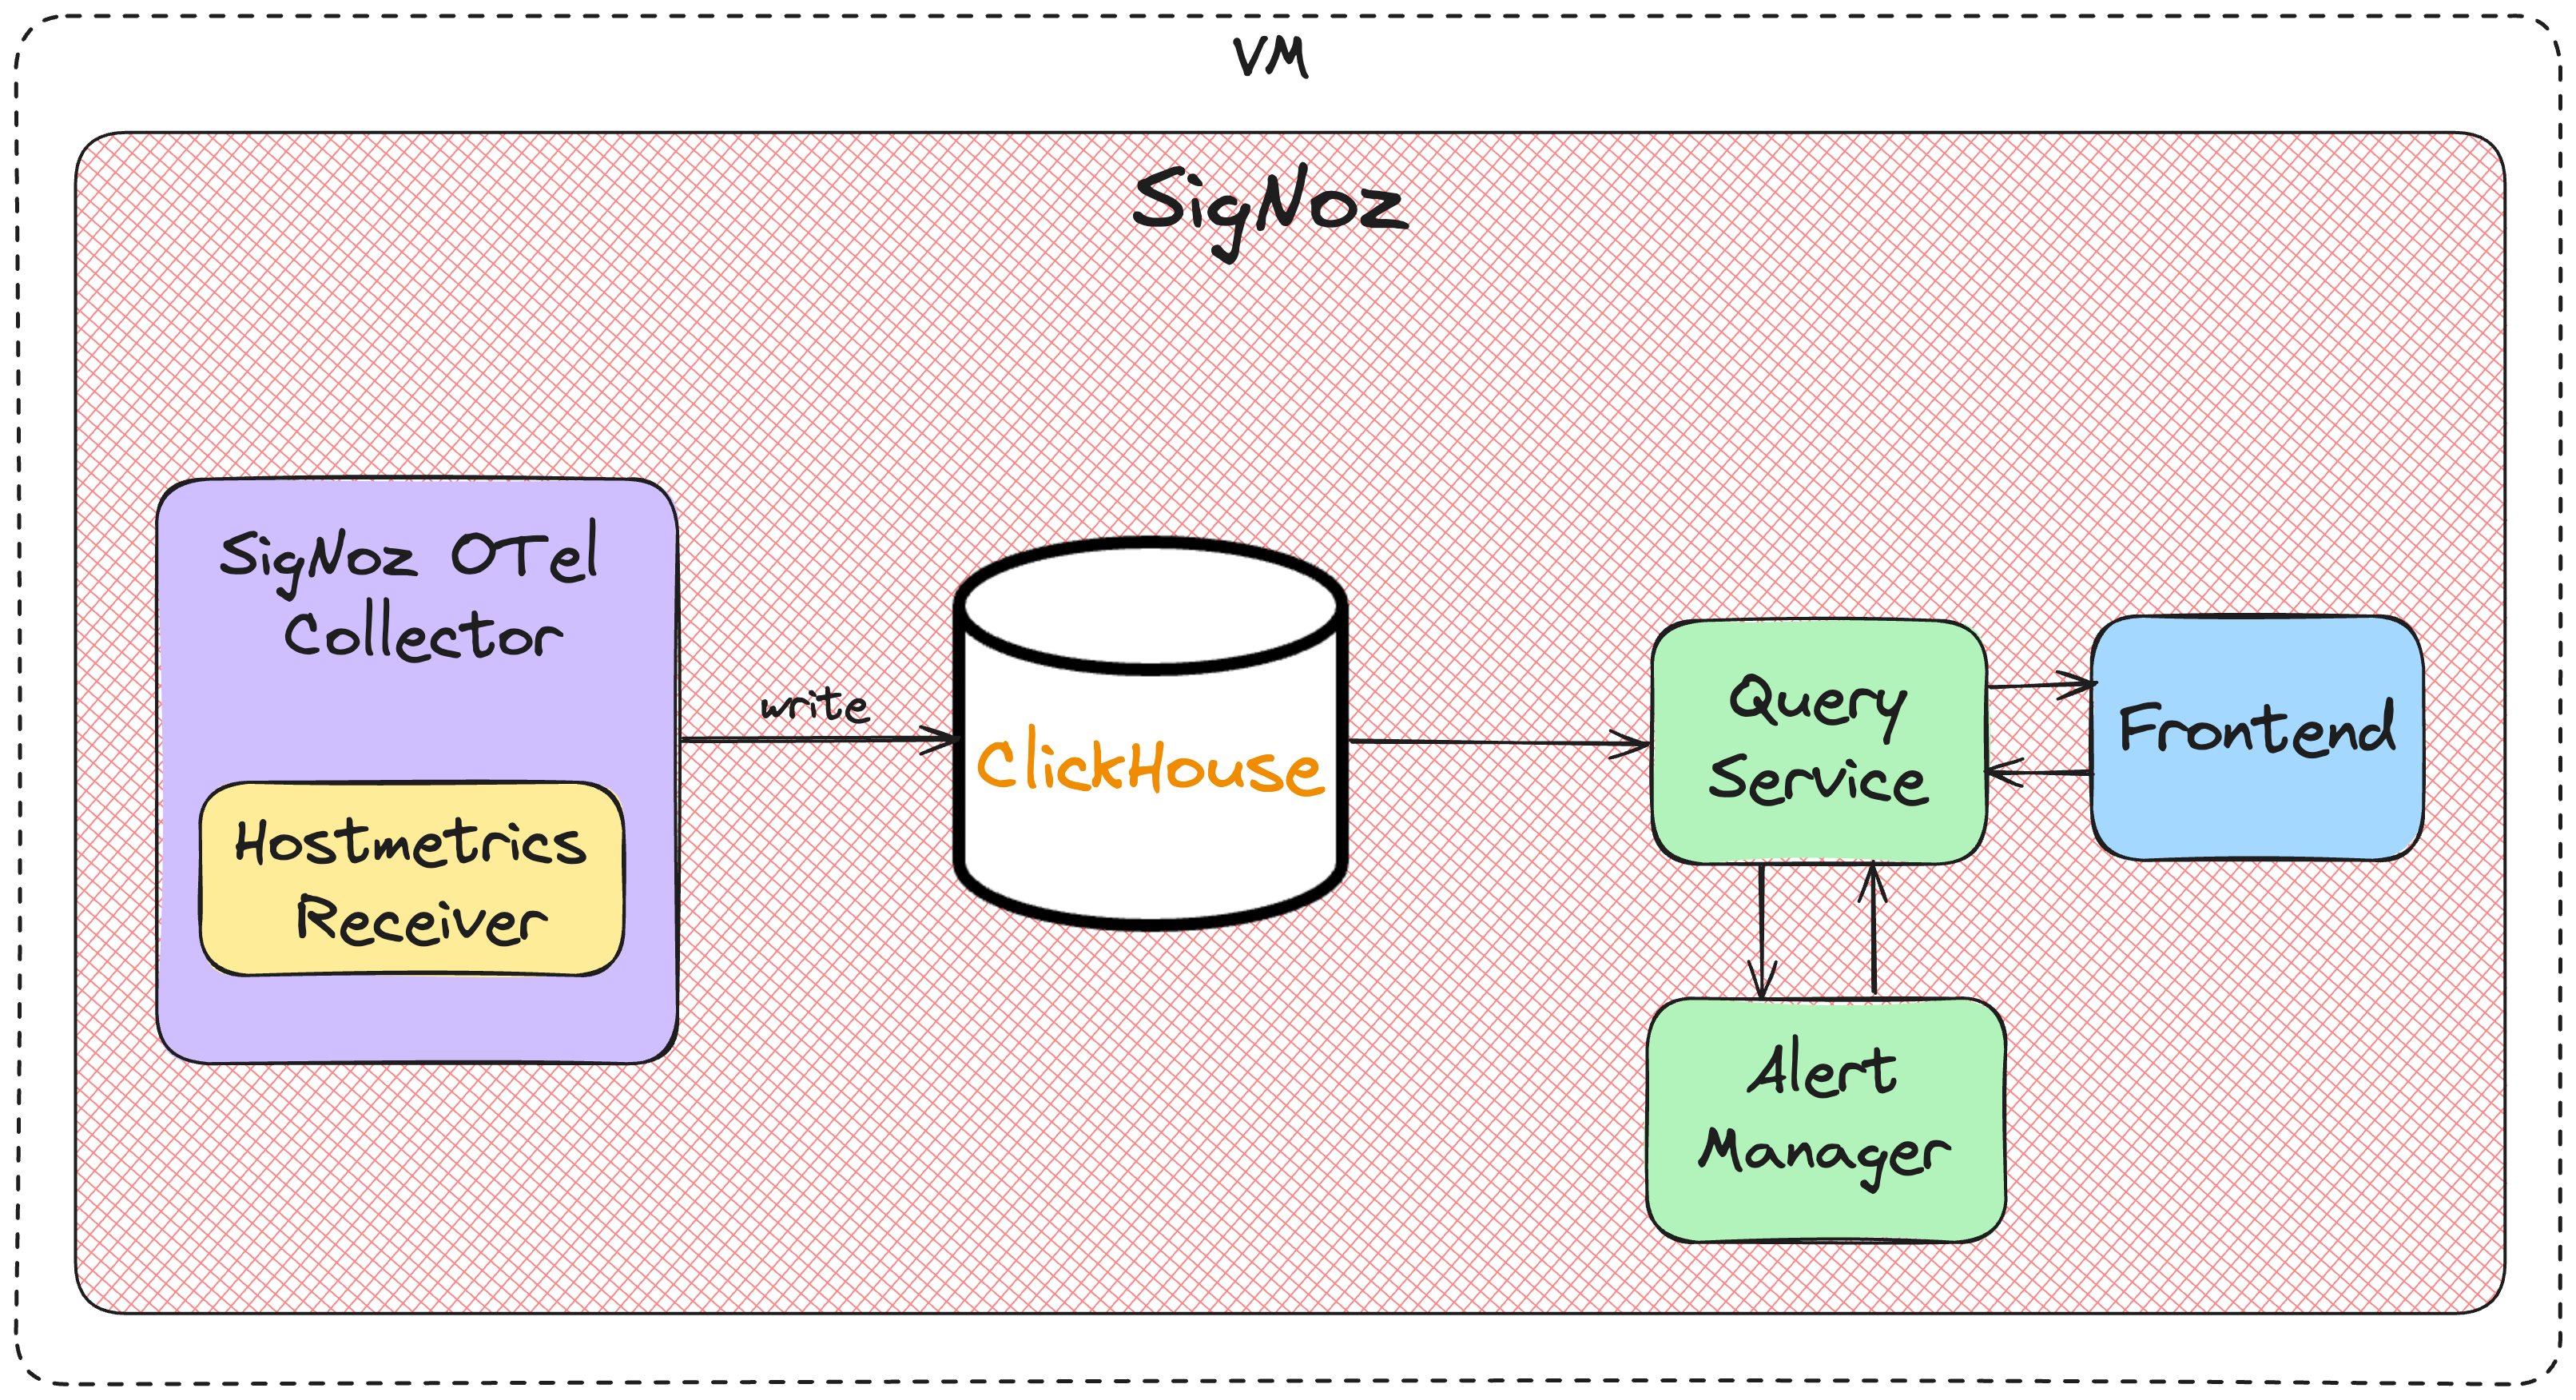
Let's see the SigNoz architecture first

-
OpenTelemetry Collector: Collects telemetry (logs and metrics) data from our services and applications.
-
ClickHouse: It's an open-source, high performance columnar OLAP database management system.
-
Query Service: This is the interface between the front-end and ClickHouse built in Go language.
-
Frontend: The user interface, built in ReactJS and TypeScript.
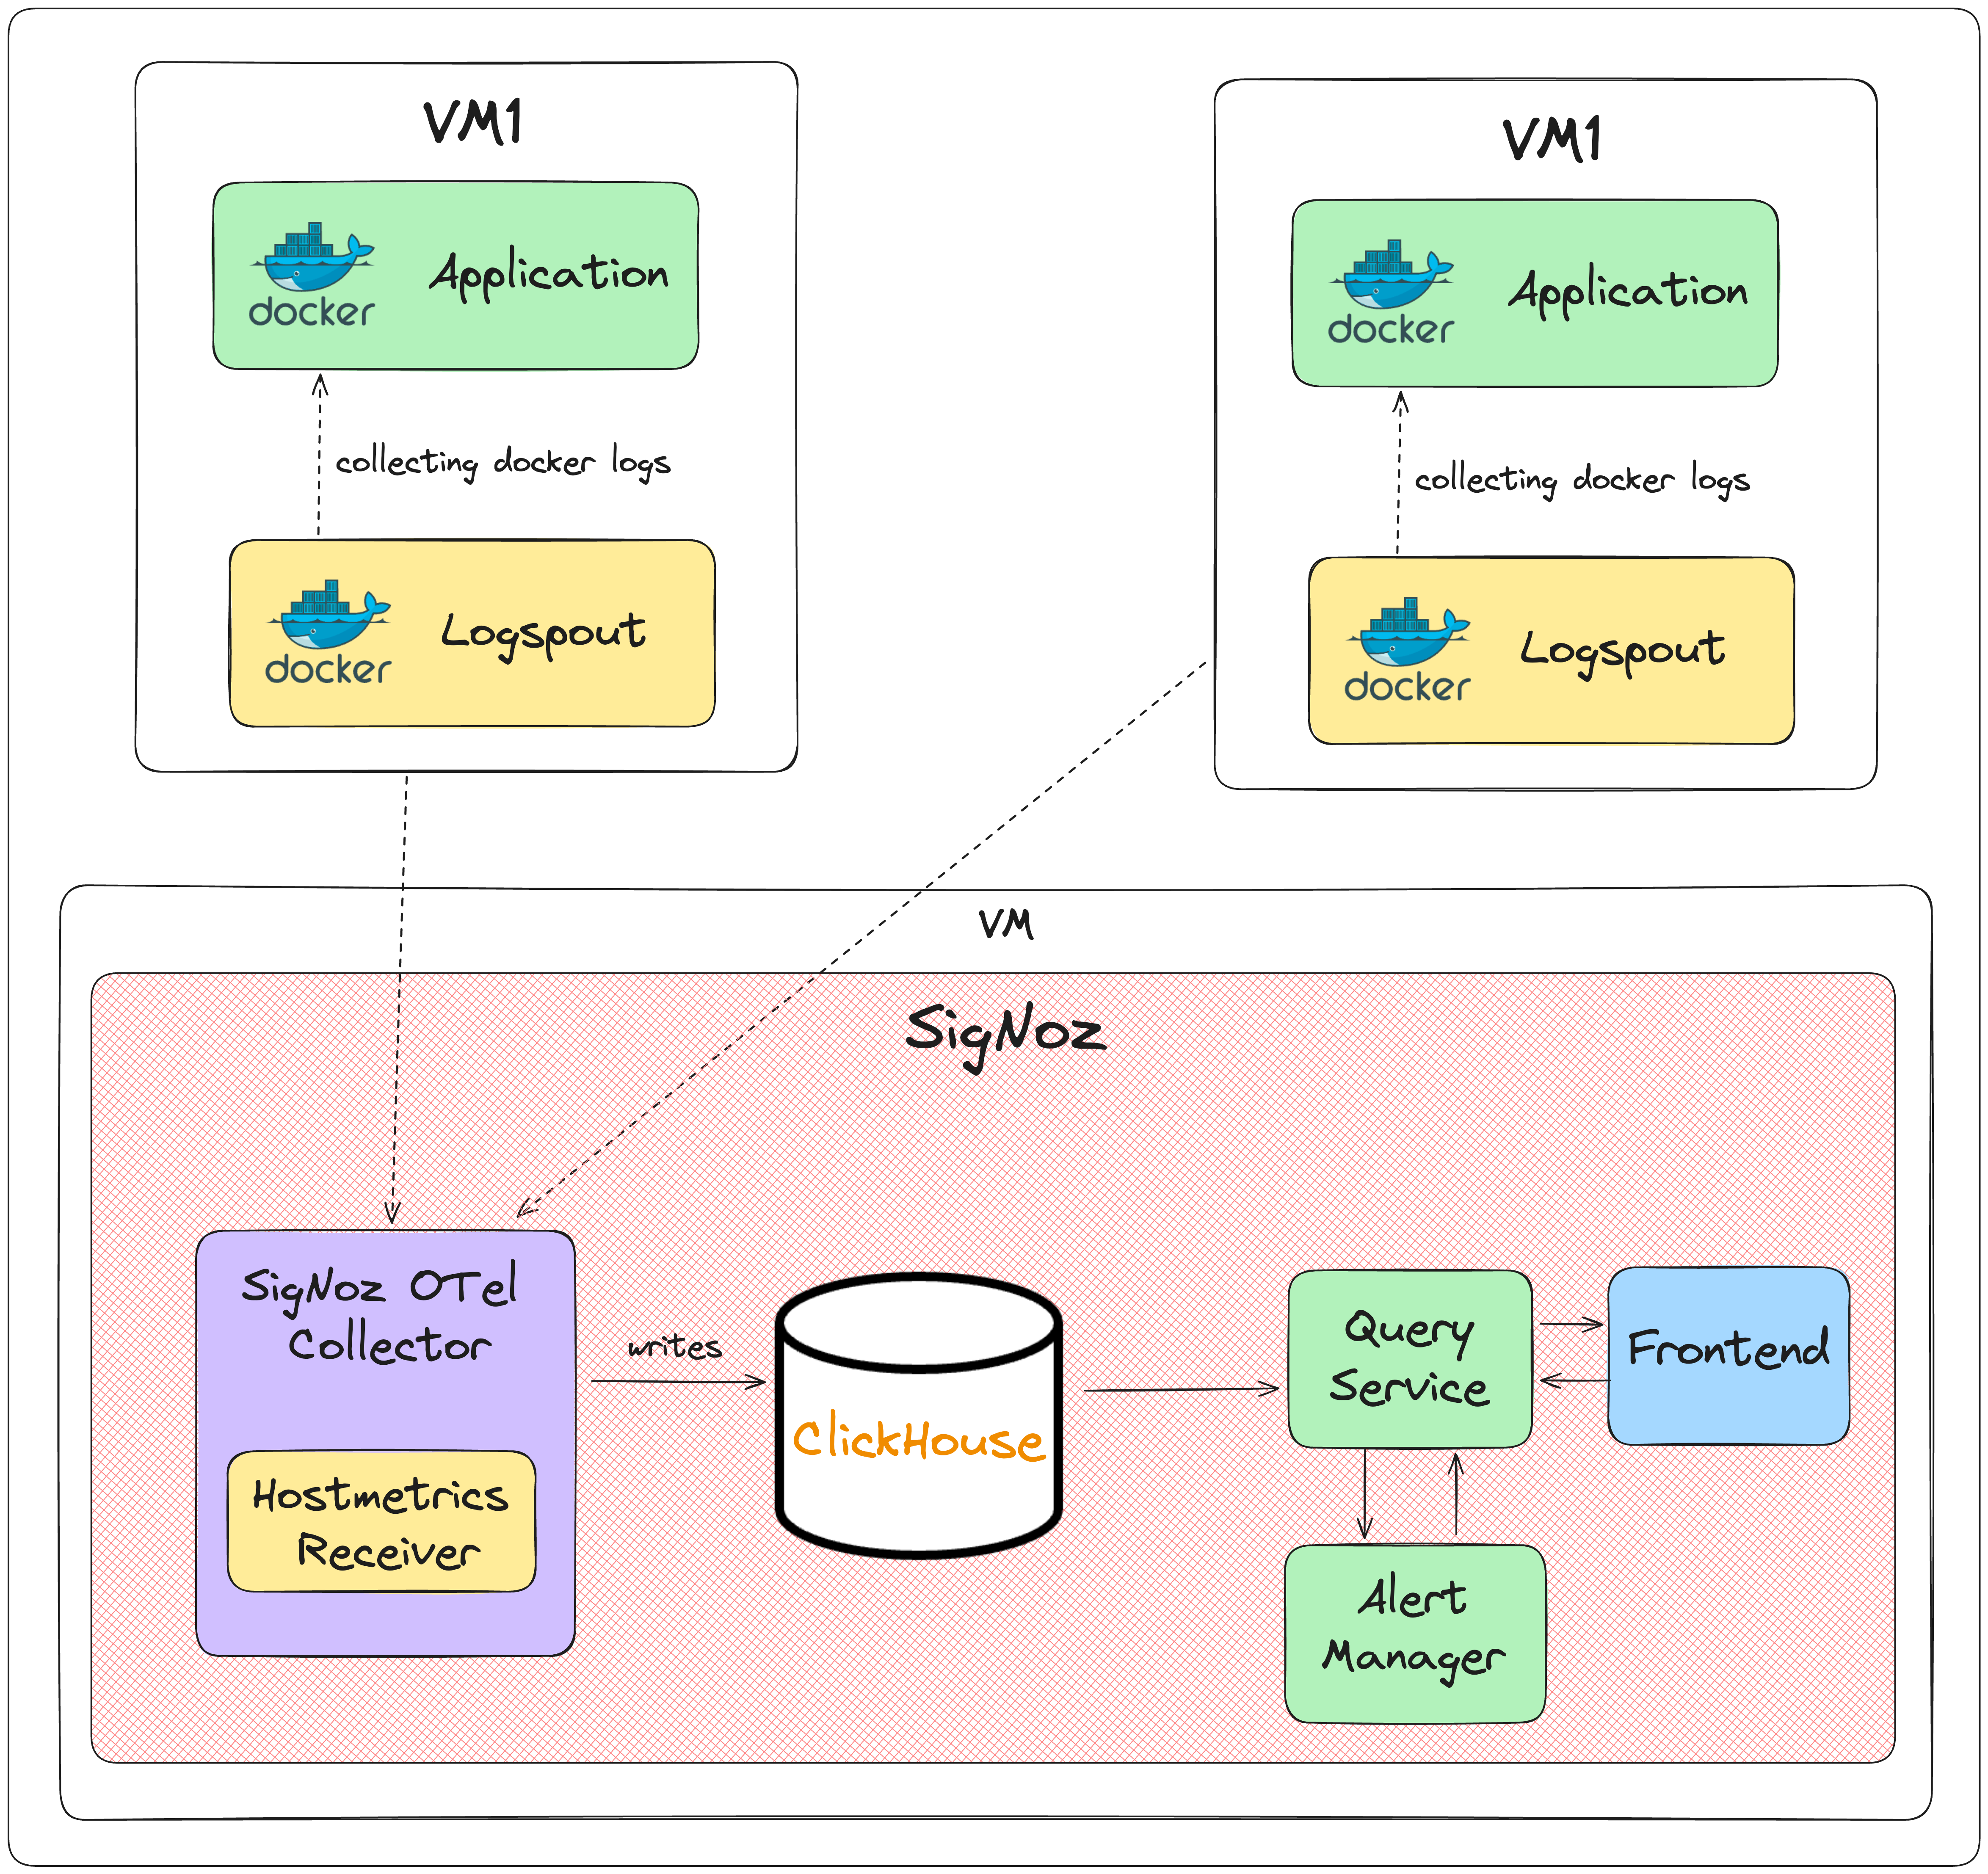
End-to-end flow for logs configuration.

Source - An application hosted on an AWS EC2 instance.
Destination - SigNoz, operational on a separate EC2 instance.
Path - We'll extract Docker logs from the application, forwarding them to the SigNoz OpenTelemetry (OTel) collector, ultimately visualising the logs within the SigNoz dashboard.
AWS EC2 Instance -> Dockerised Application -> Log Collector
Ensure your Dockerised application is up and running. For demonstration purposes, we'll employ a sample application generating continuous random logs.

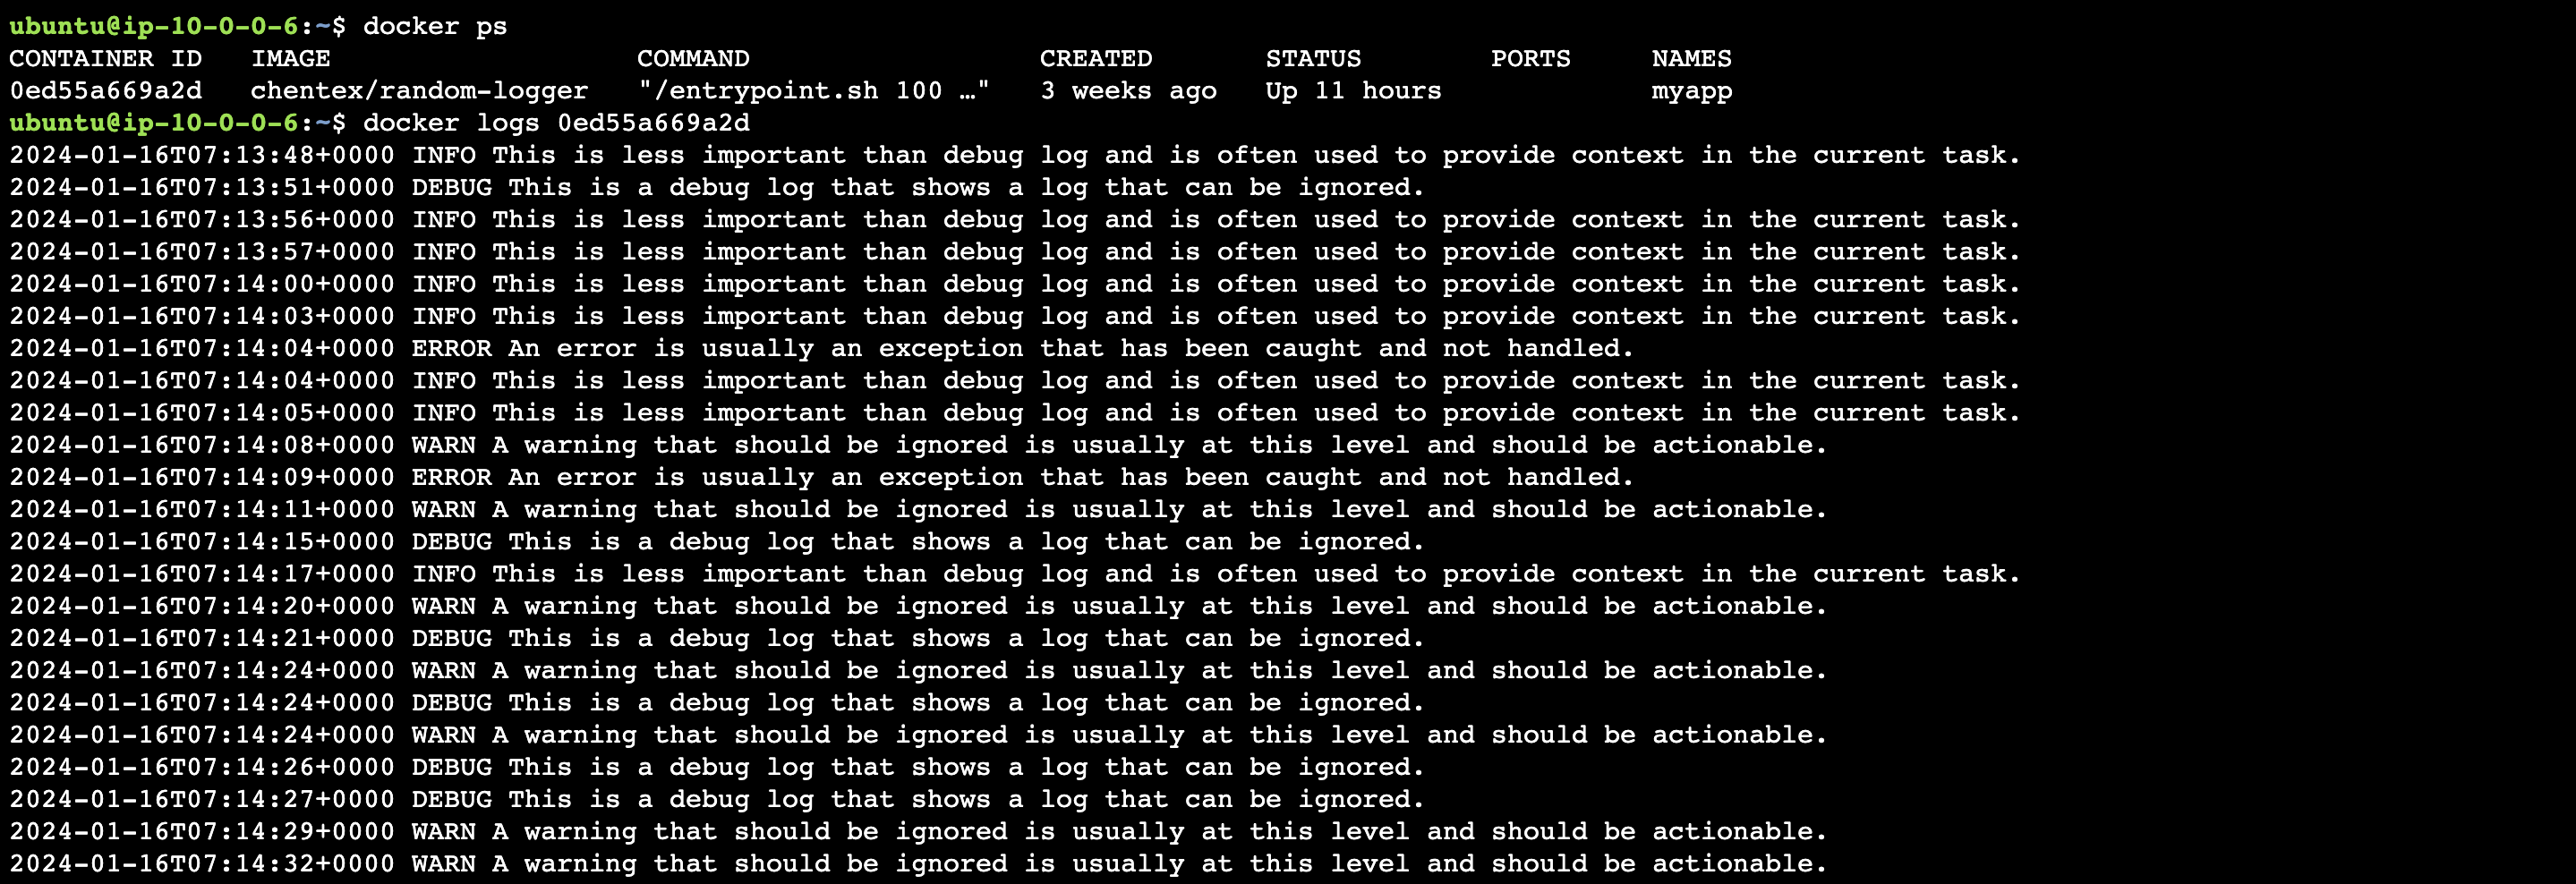
As we can see, the application is generating a stream of random logs.
Let's configure SigNoz now.
-
I have taken
t3.microas instance type, If you intend to set up SigNoz for your organization, handling logs from 10-15 applications, at3.mediuminstance would be more suitable. However, the choice ultimately hinges on the nature of the applications. So choose wisely. -
For now, I'm opening the entire port range, a practice certainly not recommended. This is solely for the demo purpose. We will discuss later about the necessary ports.
-
There are many ways to setup signoz application, but here we're using Docker Standalone method. You can explore all the possible ways here.
-
Don't forget to checkout the prerequisites section!
-
Follow the below commands -
$ git clone -b main https://github.com/SigNoz/signoz.git && cd signoz/deploy/If we look closely to the signoz architecture, we can see there are a lot of services running on it.
-
Don't run docker-compose up for now. First let's break down each and every service so that we can remove the unwanted ones.
$ docker psCONTAINER ID IMAGE 01f044c4686a signoz/frontend:0.38.2 86aa5b875f9f gliderlabs/logspout:v3.2.14 58746f684630 signoz/alertmanager:0.23.4 2cf1ec96bdb3 signoz/query-service:0.38.2 e9f0aa66d884 signoz/signoz-otel-collector:0.88.11 d3d89d7d4581 clickhouse/clickhouse-server:23.11.1-alpine 9db88aefb6ed signoz/locust:1.2.3 60bb3b77b4f7 bitnami/zookeeper:3.7.1 98c7178b4004 jaegertracing/example-hotrod:1.30I have simplified the details for the sake of better vision.
a.
signoz/frontend- It serves the user interface accessible via a web browser.b.
gliderlabs/logspout- This image takes docker logs and forward to desired destination. In signoz setup, we don't need the signoz logs to be seen in the dashboard, so we can remove this. (You can use if you want).c.
signoz/alertmanager- It handles alerts sent by Prometheus servers and manages their routing and grouping. For now we're not configuring alerts so we're going to remove this as well.d.
signoz/query-service- It handles incoming queries from users and retrieves relevant data from the underlying data storage.e.
signoz/signoz-otel-collector- This container hosts the OpenTelemetry collector, which collects, processes, and exports telemetry data to Signoz.f.
signoz/clickhouse-server- This container runs ClickHouse, an open-source column-oriented database management system. It provides storage and querying capabilities for the monitoring data collected by Signoz.g.
signoz/locust- Locust is commonly used for performance testing, stress testing, and load testing web applications and APIs. We're going to remove this.h.
bitnami/zookeeper- It is commonly used for distributed systems and coordination.i.
jaegertracing/example-hotrod- They have added a sample application for demo purpose. We're going to remove this also as we have our own application running.
After removing services, our docker-compose file something look like this.
version: "2.4"

x-clickhouse-defaults: &clickhouse-defaults
  restart: on-failure
  image: clickhouse/clickhouse-server:24.1.2-alpine
  tty: true
  logging:
    options:
      max-size: 50m
      max-file: "3"
  healthcheck:
    # "clickhouse", "client", "-u ${CLICKHOUSE_USER}", "--password ${CLICKHOUSE_PASSWORD}", "-q 'SELECT 1'"
    test:
      [
        "CMD",
        "wget",
        "--spider",
        "-q",
        "localhost:8123/ping"
      ]
    interval: 30s
    timeout: 5s
    retries: 3
  ulimits:
    nproc: 65535
    nofile:
      soft: 262144
      hard: 262144

x-db-depend: &db-depend
  depends_on:
    clickhouse:
      condition: service_healthy
    otel-collector-migrator:
      condition: service_completed_successfully

services:

  clickhouse:
    <<: *clickhouse-defaults
    container_name: signoz-clickhouse
    hostname: clickhouse
    ports:
      - "9000:9000"
      - "8123:8123"
      - "9181:9181"
    volumes:
      - ./clickhouse-config.xml:/etc/clickhouse-server/config.xml
      - ./clickhouse-users.xml:/etc/clickhouse-server/users.xml
      - ./custom-function.xml:/etc/clickhouse-server/custom-function.xml
      - ./clickhouse-cluster.xml:/etc/clickhouse-server/config.d/cluster.xml
      - ./data/clickhouse/:/var/lib/clickhouse/
      - ./user_scripts:/var/lib/clickhouse/user_scripts/

  query-service:
    image: signoz/query-service:${DOCKER_TAG:-0.38.0}
    container_name: signoz-query-service
    command:
      [
        "-config=/root/config/prometheus.yml",
      ]
    volumes:
      - ./prometheus.yml:/root/config/prometheus.yml
      - ../dashboards:/root/config/dashboards
      - ./data/signoz/:/var/lib/signoz/
    environment:
      - ClickHouseUrl=tcp://clickhouse:9000/?database=signoz_traces
      - SIGNOZ_LOCAL_DB_PATH=/var/lib/signoz/signoz.db
      - DASHBOARDS_PATH=/root/config/dashboards
      - STORAGE=clickhouse
      - GODEBUG=netdns=go
      - TELEMETRY_ENABLED=true
      - DEPLOYMENT_TYPE=docker-standalone-amd
    restart: on-failure
    healthcheck:
      test:
        [
          "CMD",
          "wget",
          "--spider",
          "-q",
          "localhost:8080/api/v1/health"
        ]
      interval: 30s
      timeout: 5s
      retries: 3
    <<: *db-depend

  frontend:
    image: signoz/frontend:${DOCKER_TAG:-0.38.0}
    container_name: signoz-frontend
    restart: on-failure
    depends_on:
      - query-service
    ports:
      - "3301:3301"
    volumes:
      - ../common/nginx-config.conf:/etc/nginx/conf.d/default.conf

  otel-collector-migrator:
    image: signoz/signoz-schema-migrator:${OTELCOL_TAG:-0.88.9}
    container_name: otel-migrator
    command:
      - "--dsn=tcp://clickhouse:9000"
    depends_on:
      clickhouse:
        condition: service_healthy

  otel-collector:
    image: signoz/signoz-otel-collector:${OTELCOL_TAG:-0.88.9}
    container_name: signoz-otel-collector
    command:
      [
        "--config=/etc/otel-collector-config.yaml",
        "--manager-config=/etc/manager-config.yaml",
        "--copy-path=/var/tmp/collector-config.yaml",
        "--feature-gates=-pkg.translator.prometheus.NormalizeName"
      ]
    user: root # required for reading docker container logs
    volumes:
      - ./otel-collector-config.yaml:/etc/otel-collector-config.yaml
      - ./otel-collector-opamp-config.yaml:/etc/manager-config.yaml
      - /var/lib/docker/containers:/var/lib/docker/containers:ro
    environment:
      - OTEL_RESOURCE_ATTRIBUTES=host.name=signoz-host,os.type=linux
      - DOCKER_MULTI_NODE_CLUSTER=false
      - LOW_CARDINAL_EXCEPTION_GROUPING=false
    ports:
      - "4317:4317" # OTLP gRPC receiver
      - "4318:4318" # OTLP HTTP receiver
    restart: on-failure
    depends_on:
      clickhouse:
        condition: service_healthy
      otel-collector-migrator:
        condition: service_completed_successfully
      query-service:
        condition: service_healthy
Now run $ docker compose -f docker/clickhouse-setup/docker-compose.yaml up -d .
With just two commands, SigNoz is up and running. We can access the dashboard at http://<IP-ADDRESS>:3301/.
In the SigNoz setup, the OTel-Collector will be receiving the Docker logs of the applications on port 2255.
-
Thus, we need to open port
2255inside thedocker-compose.ymlfile in the SigNoz setup..... otel-collector: image: signoz/signoz-otel-collector:latest command: ["--config=/etc/otel-collector-config.yaml"] ports: - "2255:2255" -
Now, SigNoz's Otel-Collector stands prepared to receive Docker logs.
Within the application's server, we'll utilize a Logspout container. This container will collect all the logs from other containers and forward them to the SigNoz server.
Logspout is an open source log router, which collects logs from all the other containers running on same host and forwards them to a destination of your choice which in our case it's SigNoz
Run the below commands for logspout
$ docker run --name log-collector \
        --volume=/var/run/docker.sock:/var/run/docker.sock \
        gliderlabs/logspout \
        syslog+tcp://<host>:2255
In <host> enter the IP address of the server where signoz is running.

As we can see, two containers are running, "myapp" and "log-collector"
Now, let's check the dashboard of signoz.

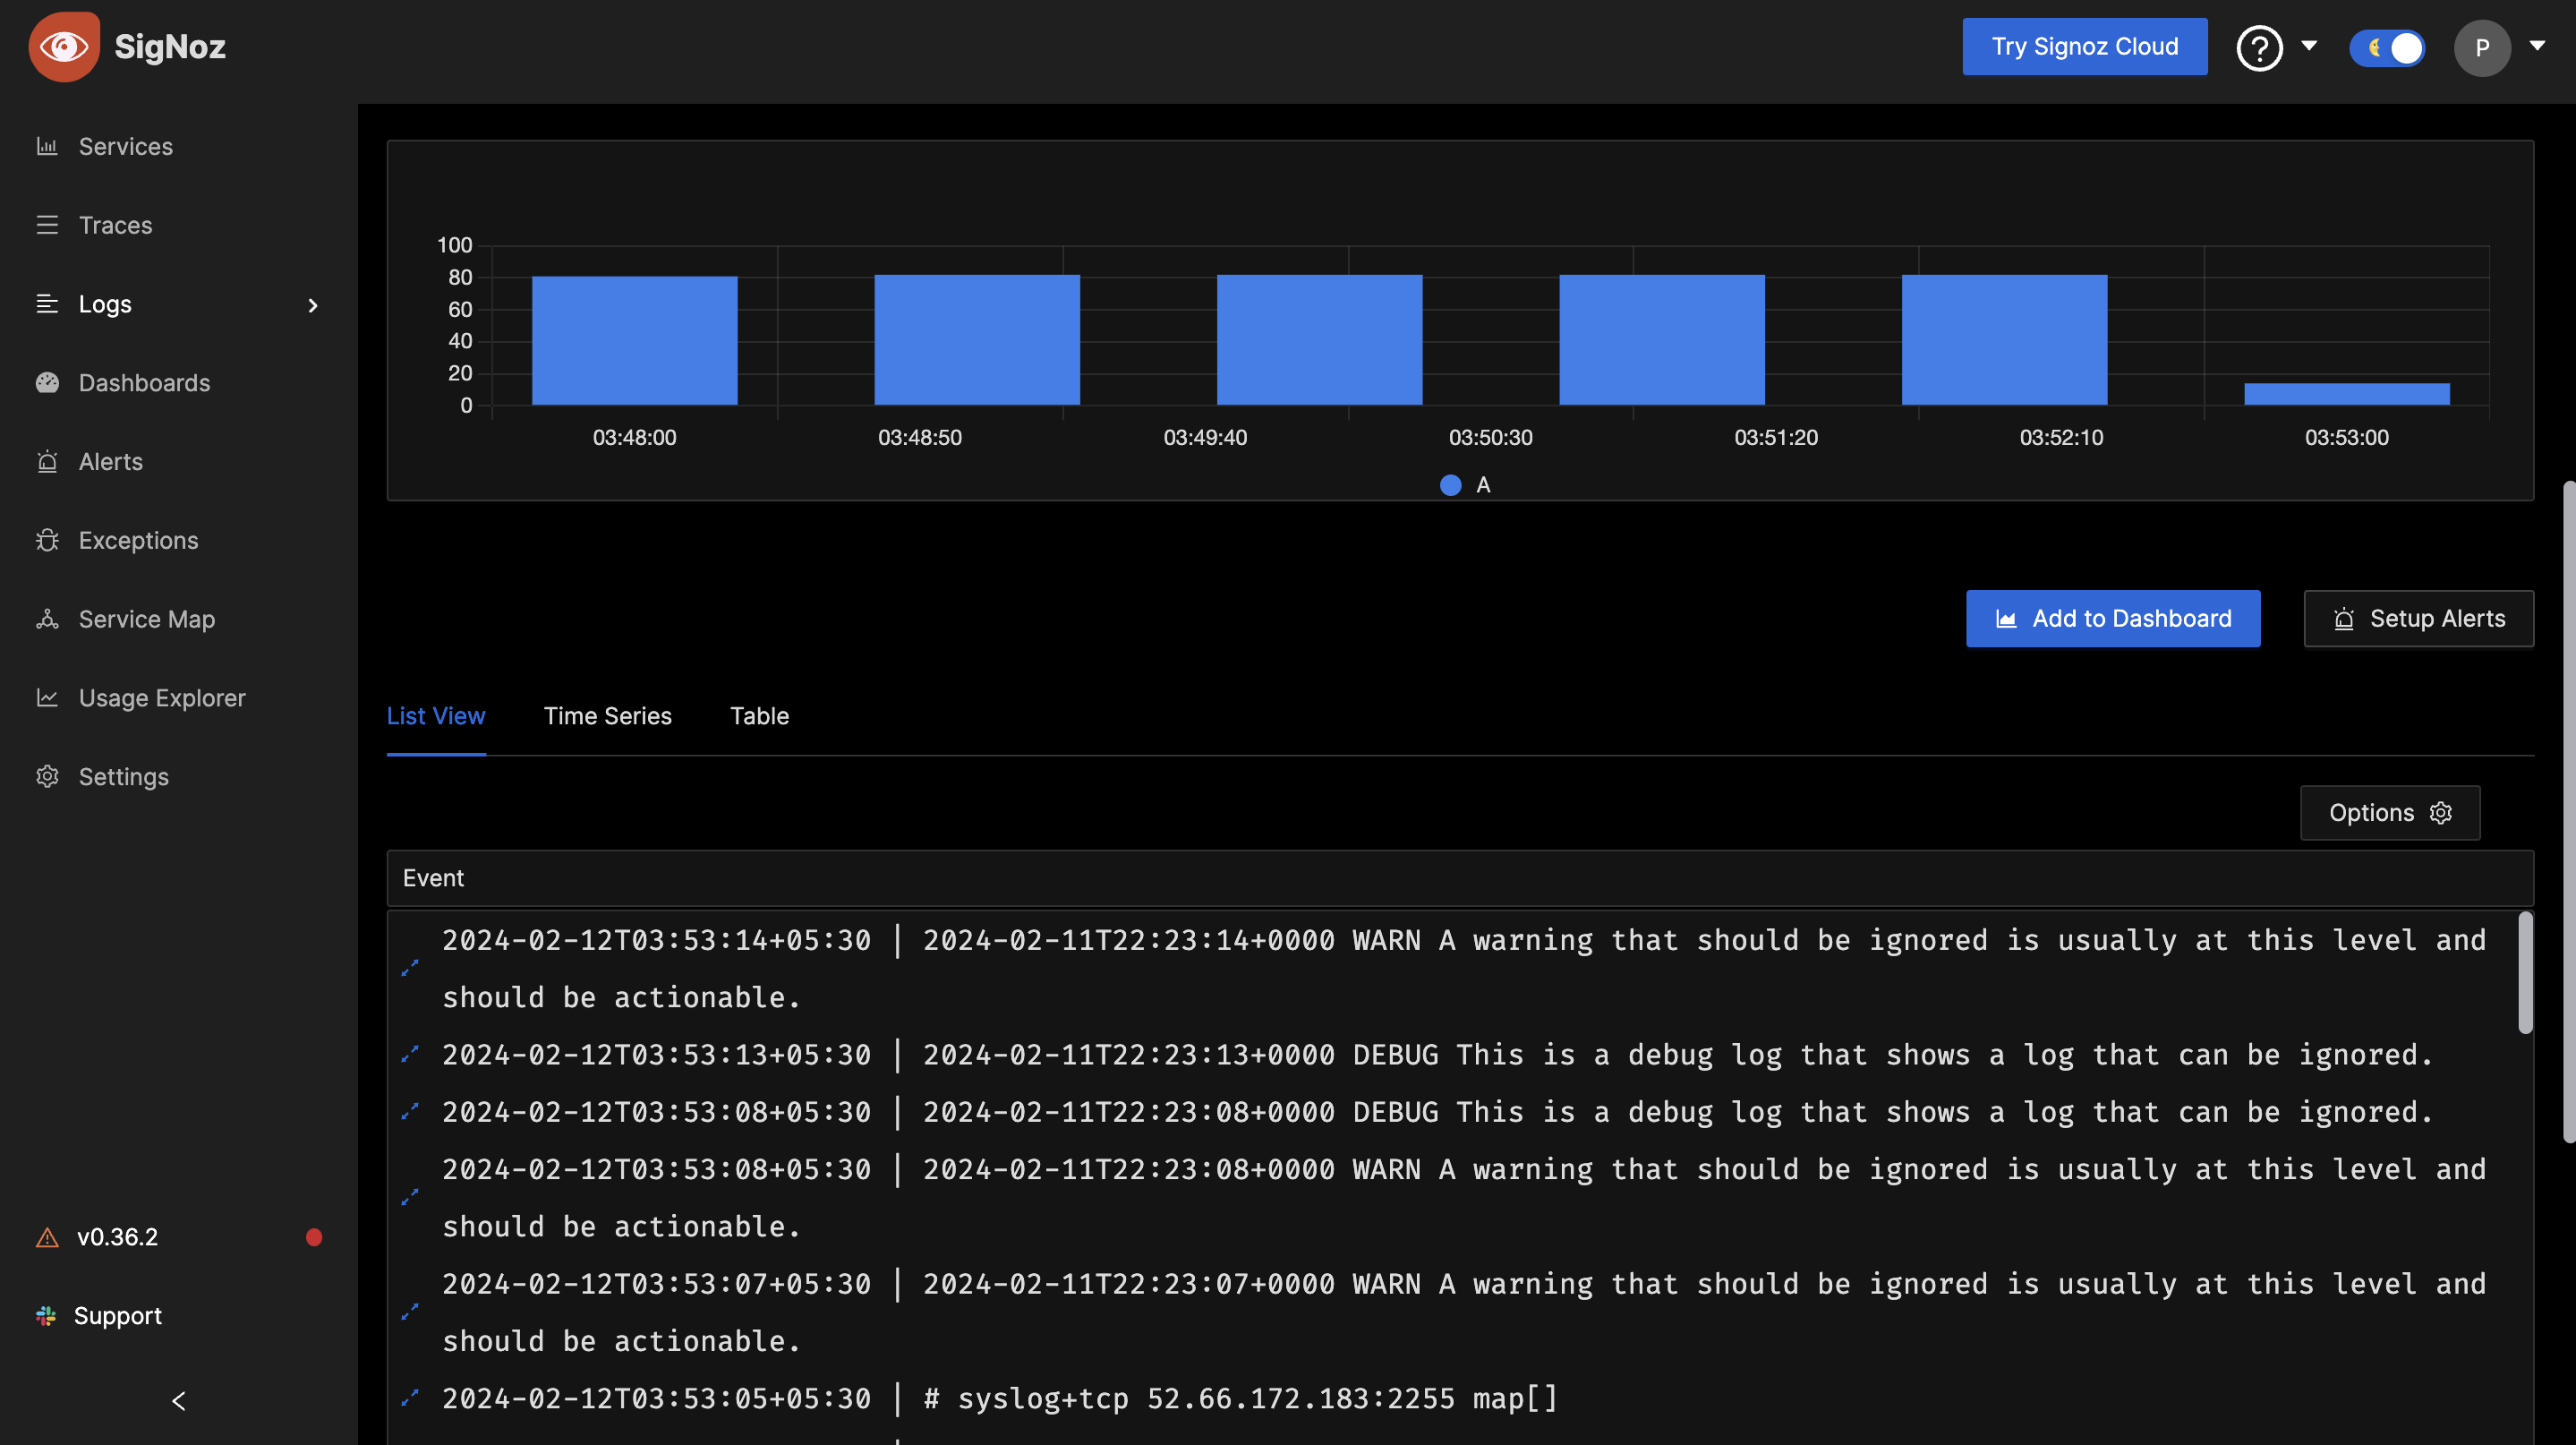
We are getting some logs in the Logs section. Click on logs detail icon.

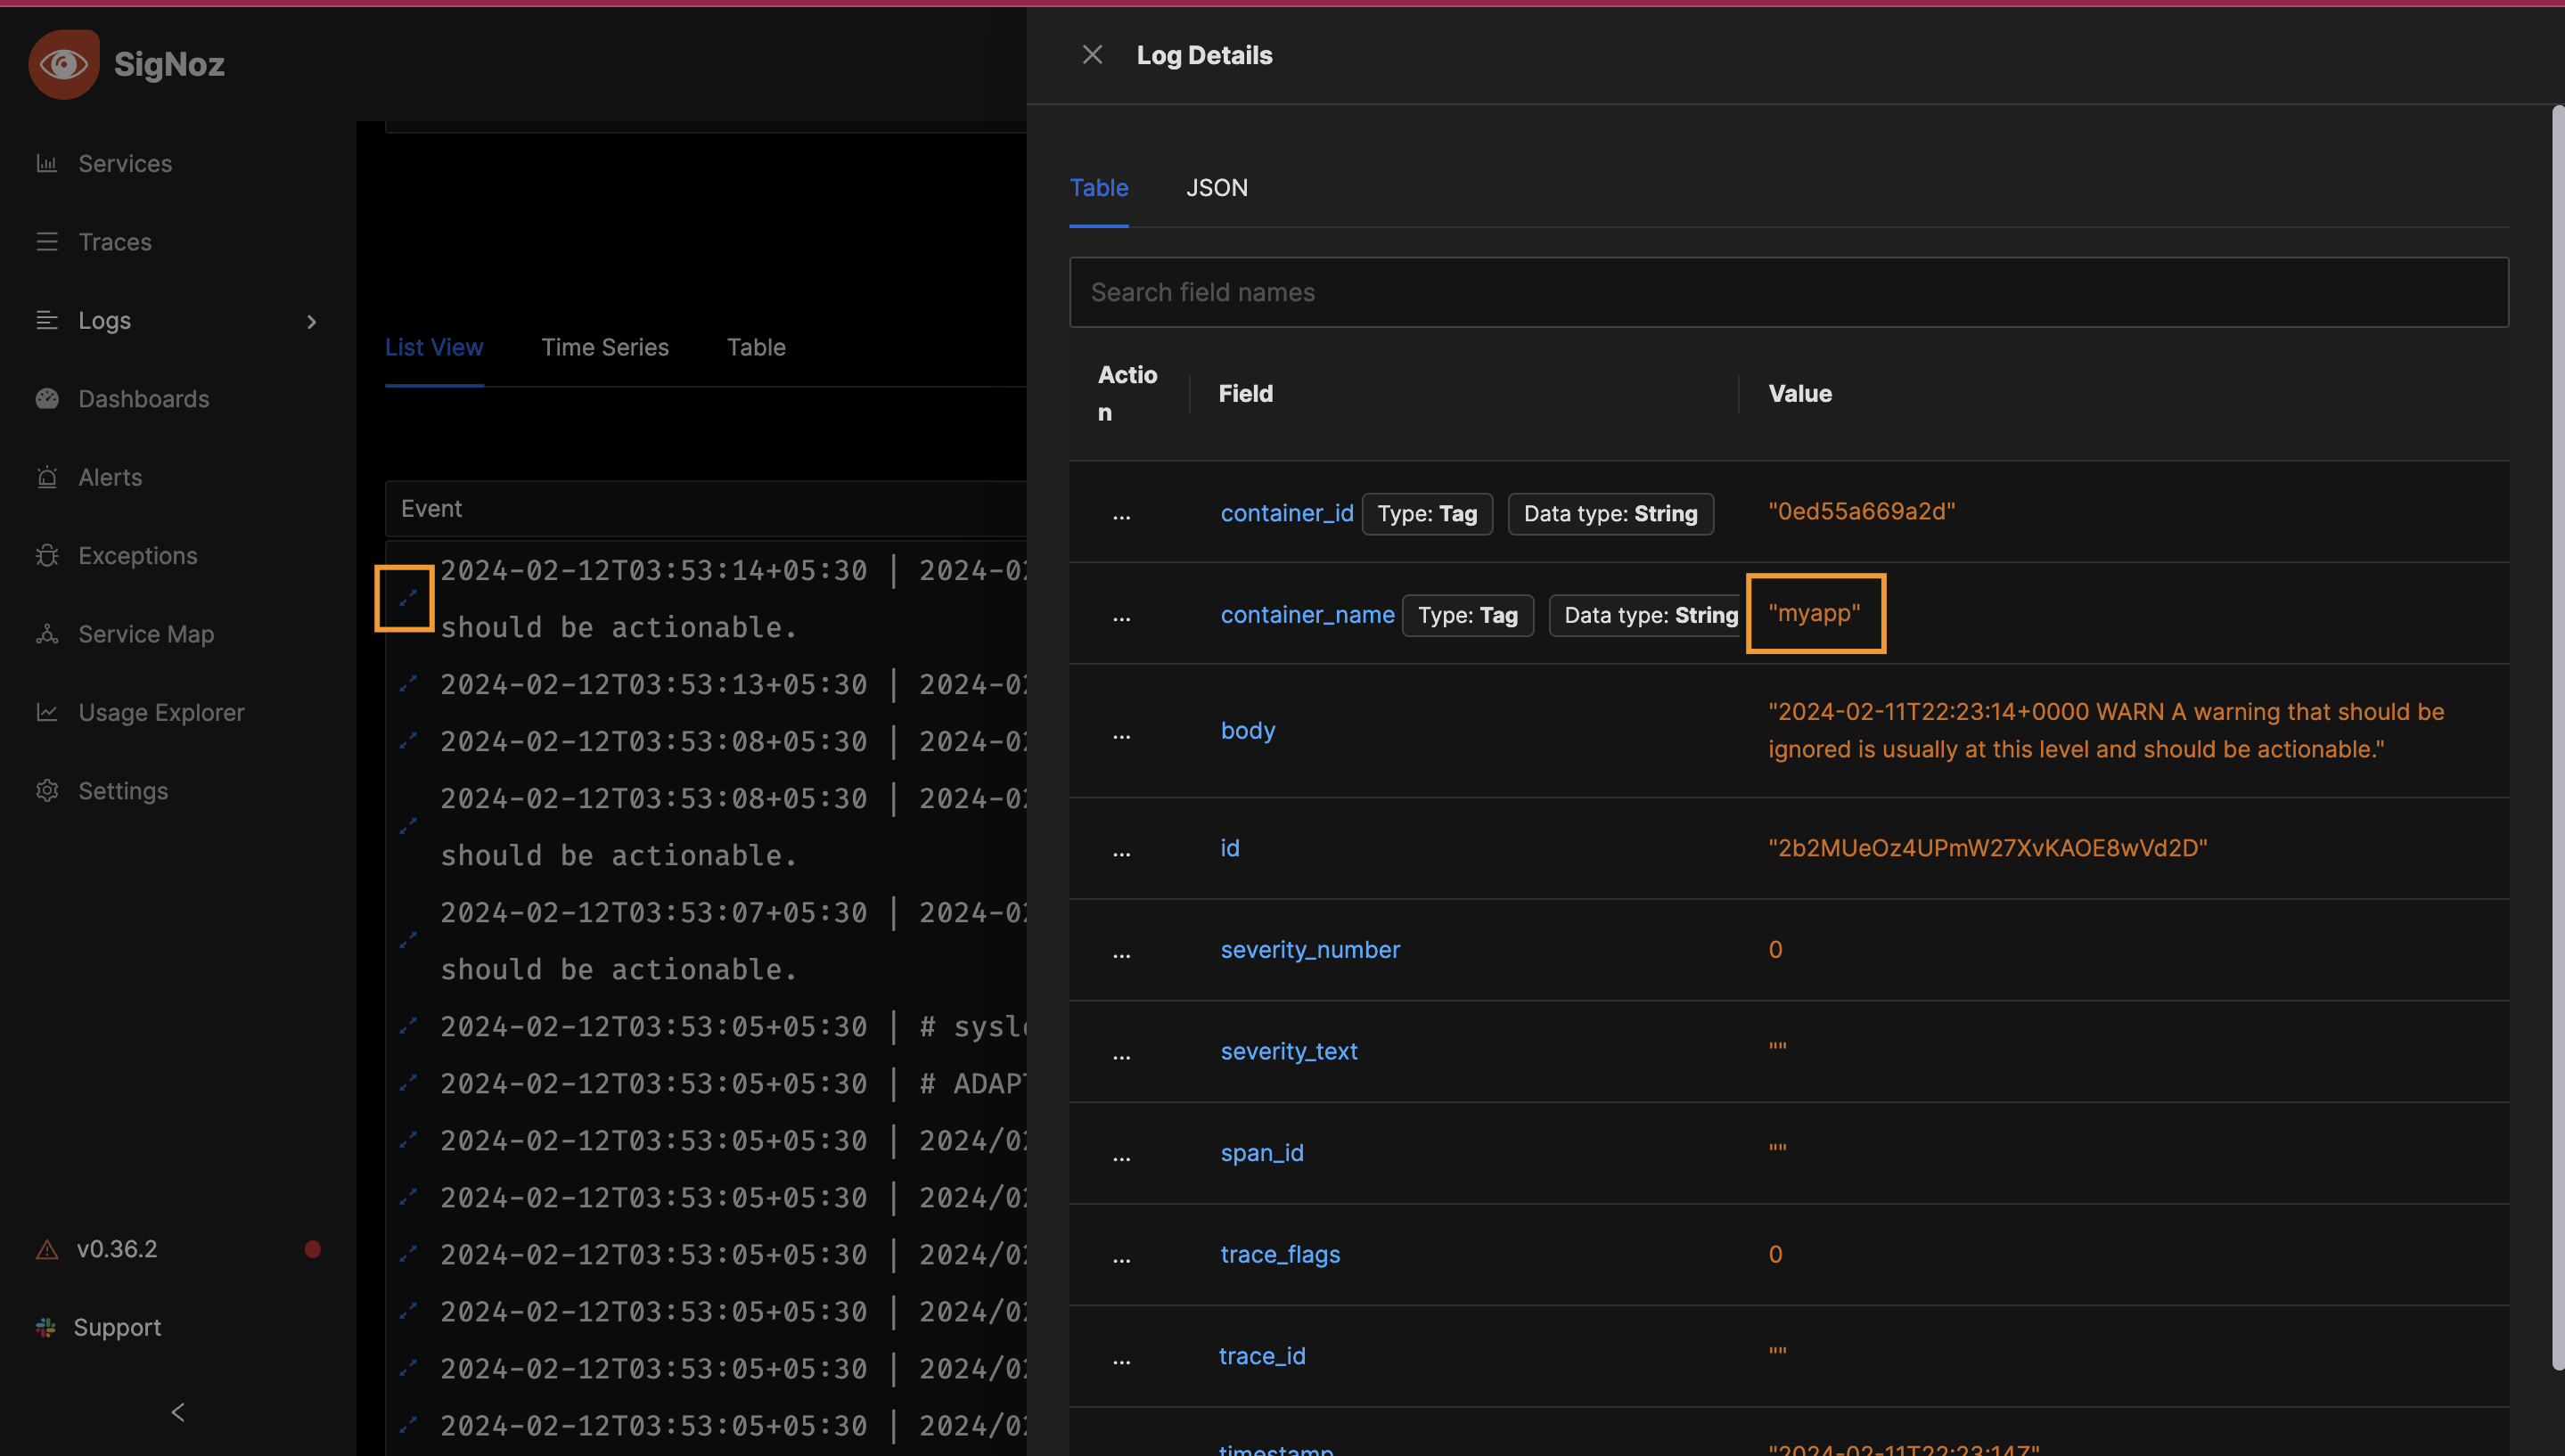
We can see our application's details here.
We've successfully set up the SigNoz server and configured our application to send Docker logs to it.
In the next part we will configure host metrics.
Stay tuned!
Thank you!🖤
Poonam Pawar — LinkedIn