Run all simple examples with:
cargo run --example <example_name>
| Example |
Image |
Description |
|
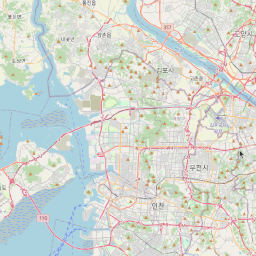
raster_tiles
|

|
- Create a map with one raster tile layer (OSM)
- Set initial map position and zoom
|
|
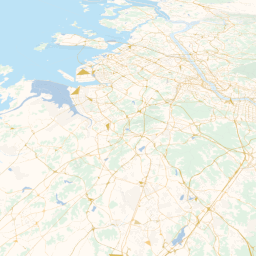
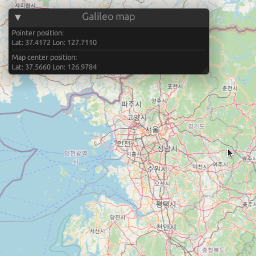
vector_tiles
|
|
- Create a map with one vector tile layer (MapLibre)
- Configure layer styling with the style file
- Get information about objects in the tiles by click
|
|
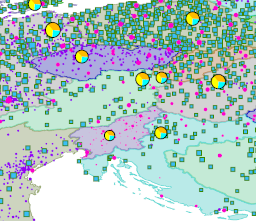
feature_layers
|
|
- Create a map with feature layers without a tile base map
- Use symbols to set advanced styles for features based on their properties
- Change properties of the features when hovering mouse over them
- Modify how the features are displayed based on changed properties
- Get information about features by click
- Hide/show features by clicking on them
|
|
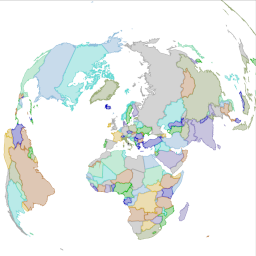
lambert
|
|
- Render feature layer in Lambert Equal Area projection
- Get and update features on cursor hover
|
|
many_points
|
|
- Render ~3_000_000 3D points over a map
|
|
las
|
|
- Read ~19_000_000 points from a LAS data set (lidar laser scanning result)
- Render all the points without pre-grouping (to demonstrate renderer performance limits)
- NOTE: before running the example, load the dataset. Read module-level docs in the example file.
- NOTE 2: You probably want to run this example in
--release mode
|
|
render_to_file
|
You can generate an image yourself running this example
|
- Run a map without a window
- Load GEOJSON file to a feature layer
- Render the map to a
.png file
|
|
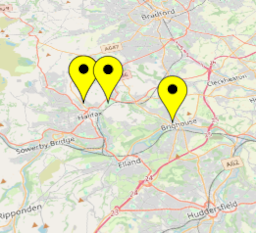
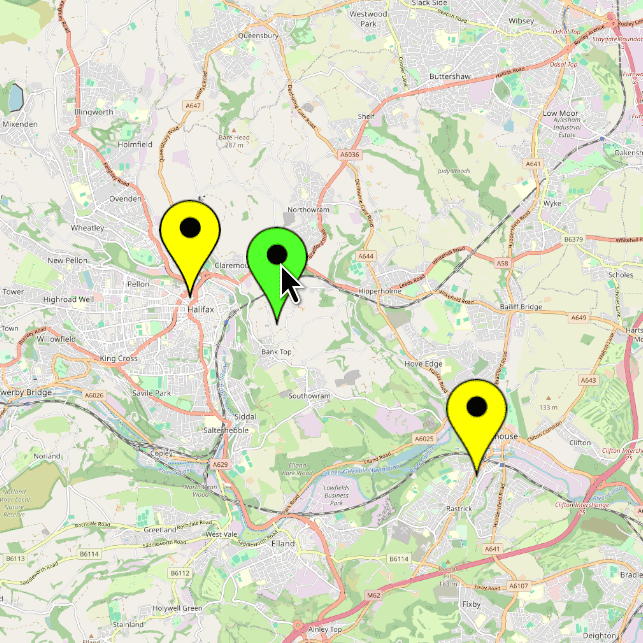
georust
|
|
- Load features as
geo-types geometries using geo-zero crate
- Display the features with pin images
|
|
with_egui
|
|
- Same as the raster tiles example, but with support for egui.
|
|
highlight_features
|
|
- Get and update features on cursor hover
- Show a different pin image based on feature state
|