We want to check your capacity of understanding and developing dimensional models, query databases, create dashboard visuals and also business and logics skills, hope you have a good time! 🙃
We expect you send us one .pdf file with the answers to all this questions. You can use the tool you feel more confortable, Microsoft Word, Excel, Apple Pages, pen and paper.
Señor Bayes is on our top 10 delivery man in Mexico City. Since he always want to grant a ★★★★★ rating and know the best roads through the city he normally makes a delivery at a 40 km/h speed to make sure he won’t break any beer bottle in the way to the client but speed up close to the city speed limit of 70 km/h with the same path to go back to get more deliveries as soon as possible. Eli, our operational manager want to make some metrics on delivery man availability and need to calculate the average speed for the whole delivery process of the stores. What, is the average speed performed by Señor Bayes on the delivery described above?
You have 11 stacks of 10 beer cans. All of the cans in one of these stacks are defected, all the other cans are not. A real can weighs 10 grammes. A defected can weighs 11 grammes. You have a scale that provides an accurate readout. What is the minimum number of weighings needed to determine which stack is defected? How you figured it out?
AB InBev is a company that brew and distribute the best beers all over the world. It has a very strong presence in the United States, Canada, Western Europe and Brazil. These are referred to as developed markets. AB InBev also has a small presence in other countries, which are called the emerging markets. The head of AB InBev has asked a ZX-Ventures team to investigate opportunities for the company to increase its sales in emerging markets in an effort to depend less on the United States and Europe market for its sales. The following table shows historic, current, and projected data on sales of beer in different parts of the world.
| Size of Beer Markets | Market size 4 years ago | Market size today | Market size in 10 years |
|---|---|---|---|
| North America | 96 | 156 | 393 |
| Other developed markets | 138 | 142 | 190 |
| Emerging markets | 52 | 61 | 134 |
The head of AB InBev has asked the ZX-Ventures team to decide on ten specific countries to investigate more thoroughly. Based on this investigation, he directed the team to identify up to five countries where they predict additional investment in AB InBev operations will show the greatest return over the next 10 years.
Based on the opinion of the head of AB InBev, which of the following statements is a valid conclusion?
-
The head of AB InBev believes that the main growth in the world’s beer sales over the next 10 years will be derived from emerging markets;
-
The head of AB InBev believes that the major growth in emerging markets’ beer sales will be greatly affected by the growth in the US market;
-
The head of AB InBev wants to invest more money in the company’s emerging markets branches relative to the US branch;
-
The head of AB InBev wants the company’s future sales growth in emerging markets to increase relative to future sales growth in the US.
Based on the data provided in table, which of the following statements is a valid conclusion about sales of beers?
-
If the forecasted trends continue, sales from emerging markets will be greater than those in developed markets outside North America in 20 years from now;
-
Looking at the past four years, the emerging markets have grown faster in terms of sales compared to the rest of the world;
-
Sales in emerging markets are expected to grow three times quicker in the next ten years than they have grown in the previous four years;
-
Four years ago, sales in emerging markets represented less than 10% of total global beer sales.
Which of the following statements, if true, best explains why future trends for North American beer sales differ from sales in other developed markets?
-
North America will have the strongest growth of all countries in ale beers sales in the future;
-
North America will have the strongest growth in homebrewing of all countries in the future;
-
Developed markets outside North America will have the strongest increase in the number of people drinking beer in the future versus the other regions;
-
Developed markets outside North America will have the most efficient beer production facilities in the future versus the other regions.
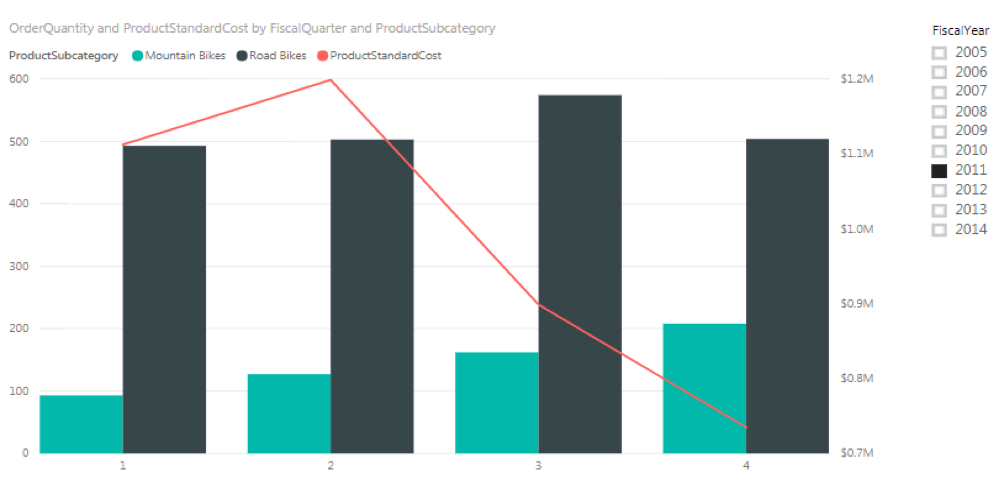
Given the field list on the table below, reproduce the following chart in the fields:
Shared Axis dimensions: ____________
Column Values metrics: ____________
Line Values metrics: ____________
Filters metrics and dimensions: ____________
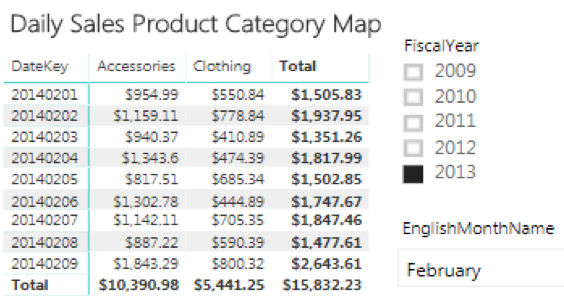
Given the field list on the page below, reproduce the table in the fields:
Rows: ____________
Columns: ____________
Values: ____________
Filters: ____________
| Customer Dimension | Date Dimension | Product Dimension | Product Category Dimension | Product Subcategory Dimension | Internet Sales Fact |
|---|---|---|---|---|---|
| Customer Key | Date Key | Model Name | Product Category | Product Subcategory | Discount Amount |
| Yearly Income | English Month Name | Product Name | Freight | ||
| Fiscal Quarter | Order Date | ||||
| Fiscal Year | Order Quantity | ||||
| Product Standerd Cost | |||||
| Sales Amount | |||||
| Sales Order Number | |||||
| Tax Amount | |||||
| Total Product Cost |
Given the charts below build a dimensional model to represent the information
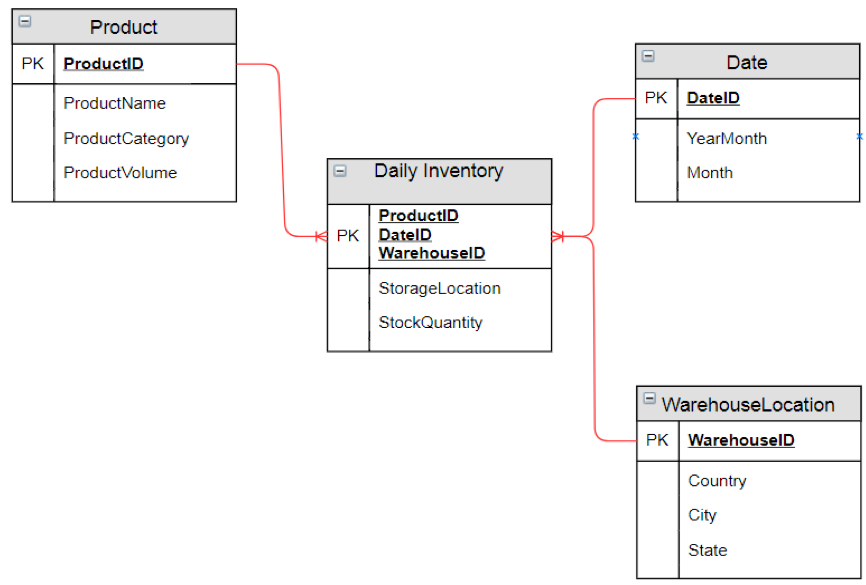 * DateID field is a date datatype
Given the dimensional model presented, build the following SQL queries:
- Returning the evolution of quantity in inventory per product category per date;
- Returning the most recent inventory position of quantity of products per category;
- Returning the quantity of distinct products that have ever been stored in each state
Share two projects that you have developed that required complex ETL, explain the complexity and how you solved it
Draw a data flow for loading data from an e-Commerce site to a Data Mart. The data will be extracted from APIs and needs to be combined with data from Excel files before it is stored in the Data Mart - explain the main components and the tools you would use. Show how the end-users will access the data.
Once you have finished the challenge, please follow these instructions.