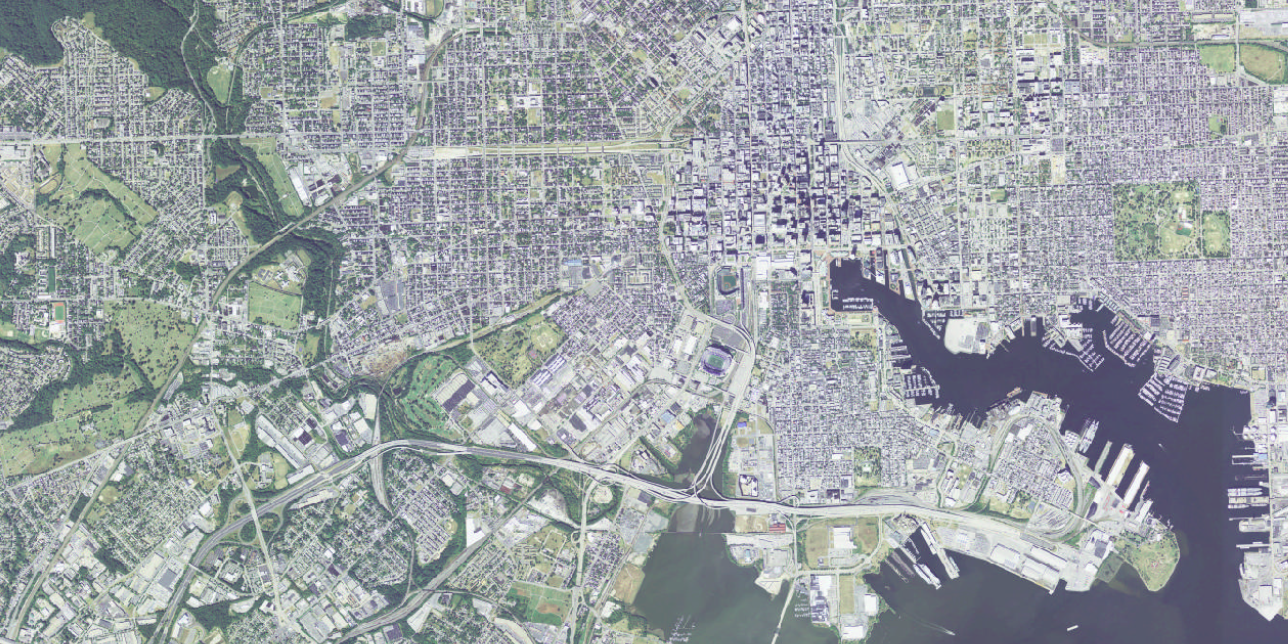
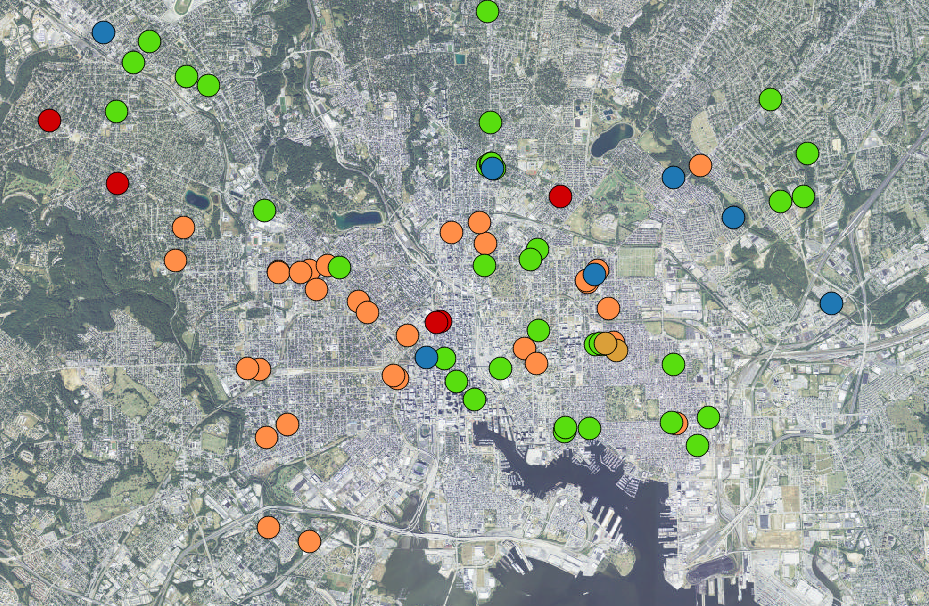
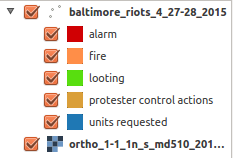
- Baltimore case study with 1. riots 1. arrests 1. fatal encounters with police
- Attribution: TIME magazine
- spatial data sources for the US and the world
- learn how to find and use open spatial data
- understand the difference between raster and vector
- open GIS layers like .tif ( raster ) and .shp ( vector ) in QGIS
- perform attribute joins
- eg, join census tables by geo_id
- perform spatial joins
- eg, counts of arrests by census block group
- subset spatial data
- eg, find all homicides in the BPD arrest record
- reproject vector datasets
- eg, between NAD83/UTM 18N and WGS84!
- use the American Community Survey (ACS) through censusreporter.org
- calculate
- heatmaps of incident points
- spatial join crime/riots/arrests on census block groups
- summarize high resolution land-cover by census blocks
- eg, percent tree over by census blocks
- this is called "zonal statistics"
- cartography
- drape layers over DEM products like hillshade
- what is . . . ?
- JSON ( hint: open with a text editor )
- TSV ( tab separated values - open in QGIS with TAB delimiter! )
download the data
or homicides
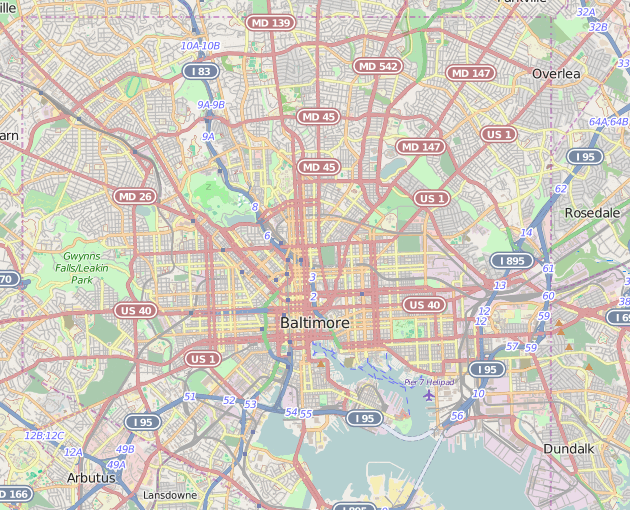
OSM (https://www.openstreetmap.org)
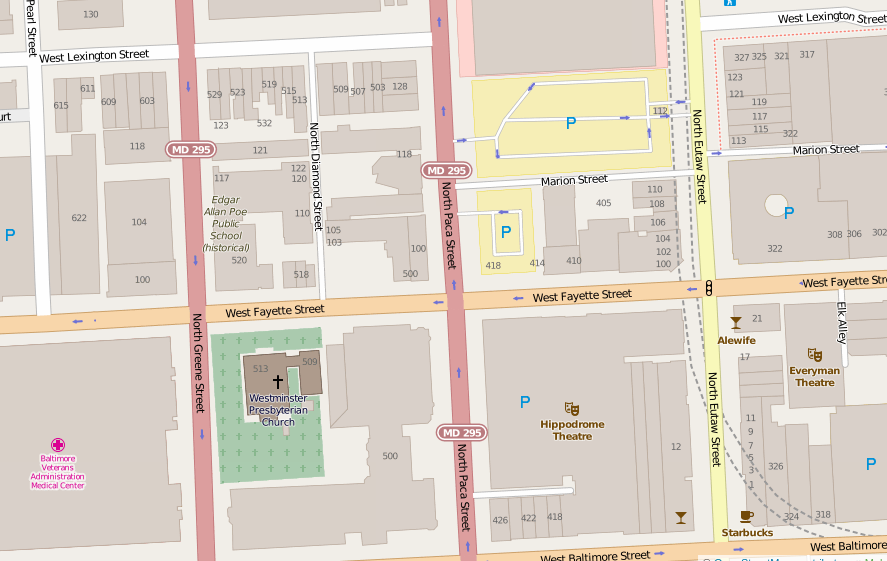
OSM (https://www.openstreetmap.org)
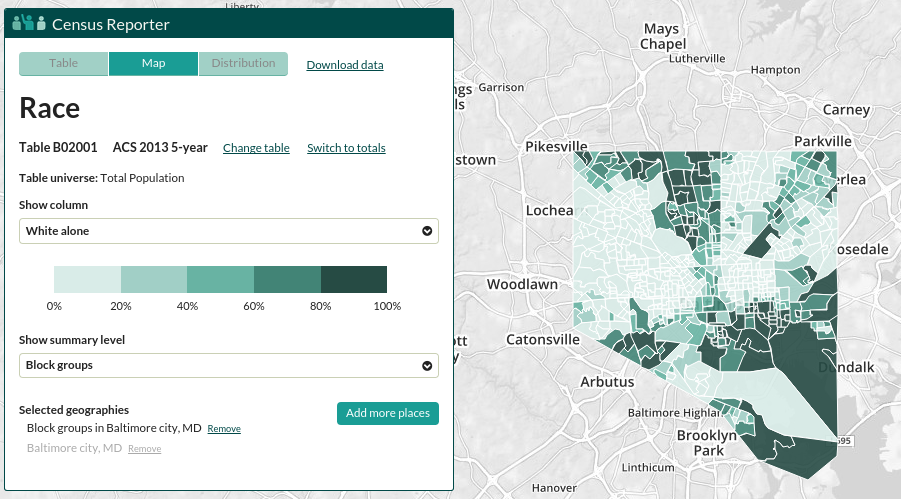
Census Reporter http://censusreporter.org
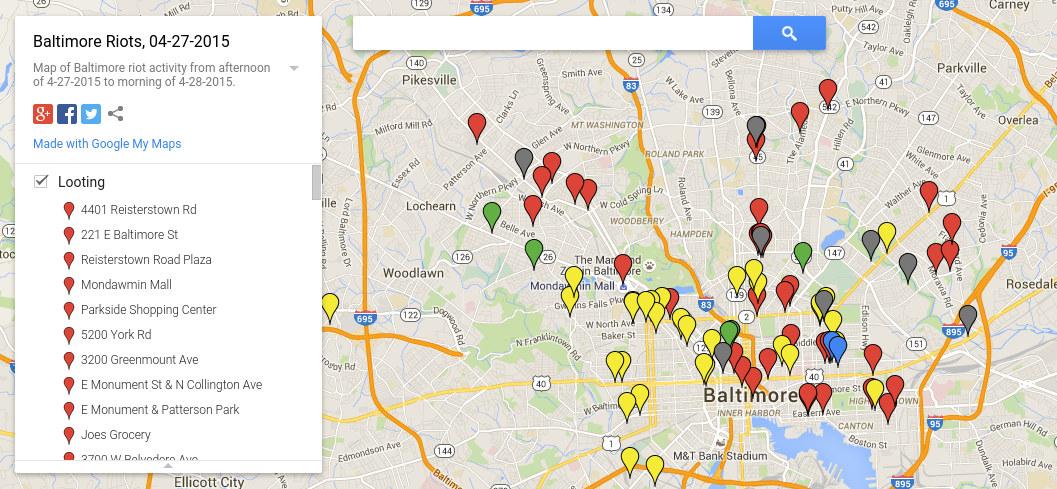
Crowd sourced data curated by @VinylFox and @Ryan_J_Smith
Generally data needs to be cleaned or re-organized before it is easily used.
We've done this ahead of time so you can get right to work!
please download the zip file of this workshop at our github repo: github.com/KAPPS-/maptime_hrva
To learn how to bring spatial data into a GIS we will make a simple map with multiple data types:
- download NAIP imagery
- download NED DEM (digital elevation model)
- download censusreporter.org shapefile
- download censusreporter.org CSV for another variable
- open QGIS, add censusreporter inputs
- right click -> properties -> joins
- join CSV to shp using census geo_id field
- delete Baltimore wide polygon with QGIS edit session
- not needed! obscures view!
- right click -> save as -> geoJSON
- just so we can keep nice field names
- right click -> styles -> choose variable and color ramp
- overlay points of interest like riot incidents, arrests, homicides, police cameras, etc
CartoDB - make web maps so fast you won't believe it
OpenRefine for the win
- text faceting
- got an XLS with free text fields gone awry? 1. "Clusters saved my life"
- numeric faceting
US Census 2000 used short and long forms, but Census 2010 only used the short form. awesome variables like income are now collected using the American Community Survey (ACS) instead
- 1 year ( most current, small sample size, only biggest communities )
- 3 year
- 5 year ( least current, huge sample size, all areas )
Which do I choose?


