I usually need to plot the moment tensors on the map, but plot them in the google earth is really cool. This week, I will blog how to do that based on this blog from my friend Thomas. Some of the API in his blog have already changed in the past, and I will make a working example. You can find all the code on Qingkai's Github.
# You need to install the pykml first if you don't have it.
# The other thing is that, it is written in python 2, if you are using python 3 as I am doing here,
# then you need to add parentheses for the print function in the factory.py file in the pykml.
!pip install pykml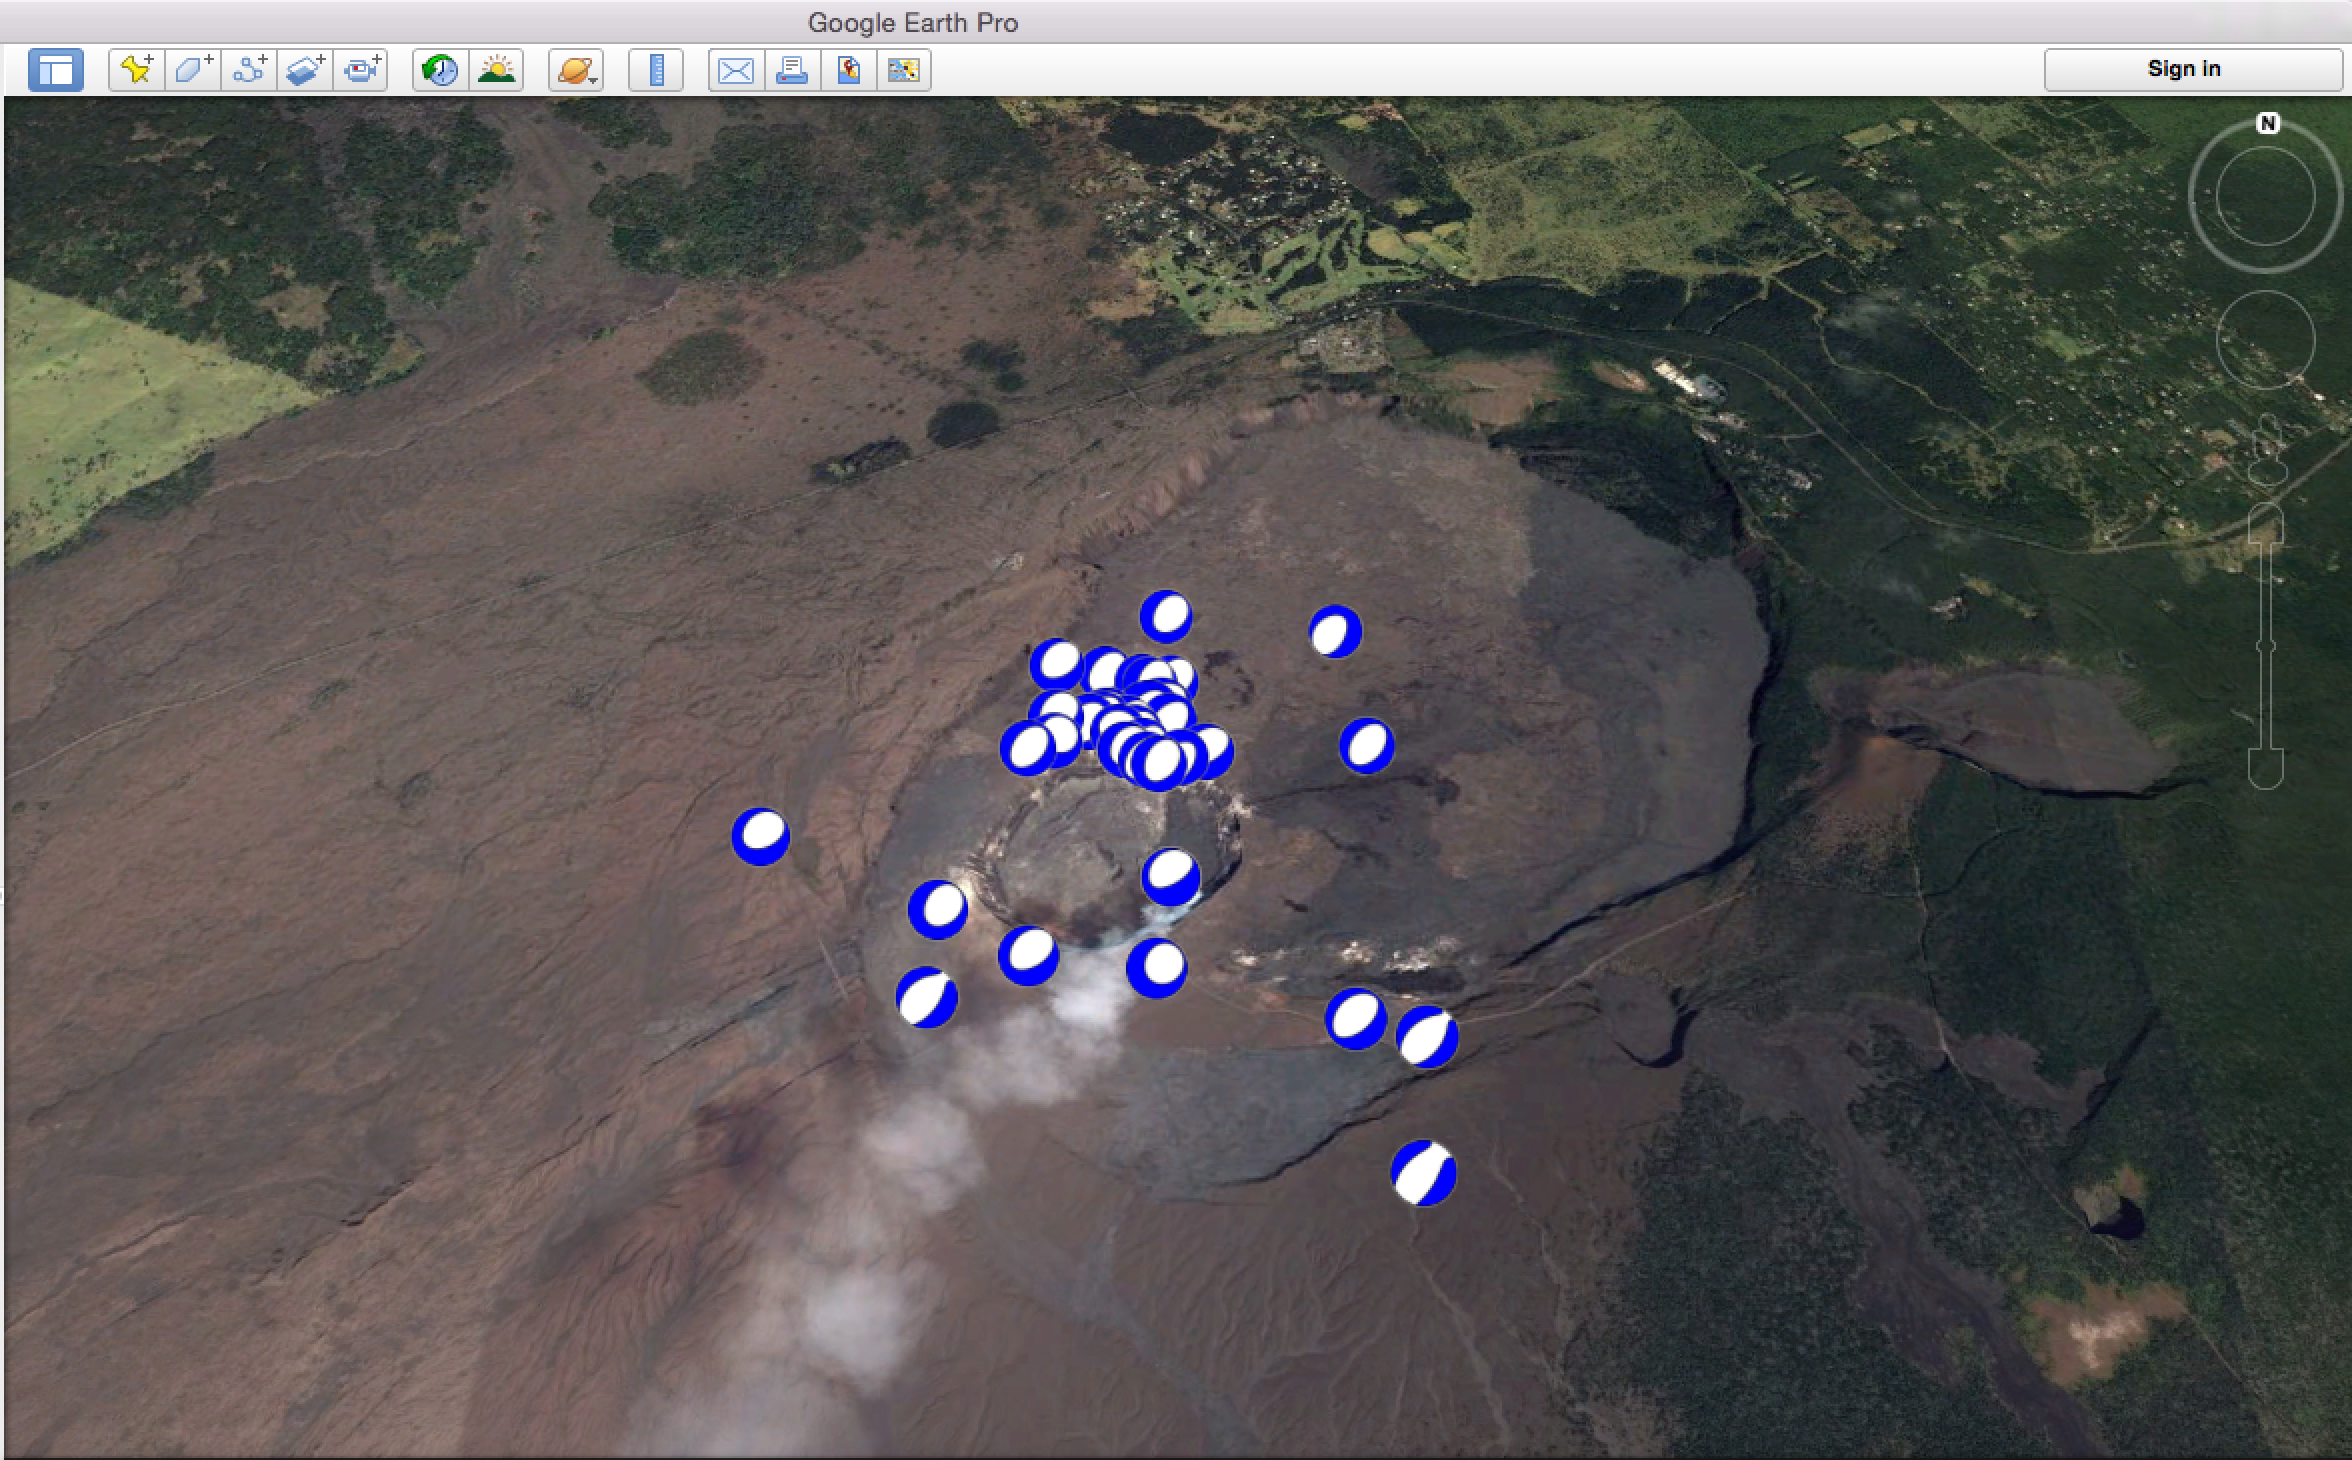
from lxml import etree      #will manage the identation of the kml script
from pykml.factory import KML_ElementMaker as KML #import pykml library
import datetime as date
import numpy as np
def beachball(data):
"""function to draw beachball using obspy library"""
import matplotlib.pyplot as plt
from obspy.imaging.beachball import beachball
mt =data[:, 9:]
event=data[:,0] #index to identify the beachball created
for j in range(len(event)):
#create and save beachball in a outfile in the directory where the .py file is
beach = beachball(mt[j, :],outfile=str(int(event[j]))) The first thing is that we need to generate a file that contains the list of event with the moment tensors, here the format is: index, yyyy, mm, dd, hr, mn, ss, lat, lon, mrr, mtt, mpp, mrt, mrp, mtp
I generated a file called mt_list, let's see the first 3 lines:
!head -n 3 ./mt_list# index, yyyy, mm, dd, hr, mn, ss, lat, lon, mrr, mtt, mpp, mrt, mrp, mtp
0.00000,2018.00000,5.00000,29.00000,11.00000,56.00000,11.00000,19.41200,-155.28383,-98650000000000000.00000,53510000000000000.00000,45140000000000000.00000,-75790000000000000.00000,9460000000000000.00000,14910000000000000.00000
1.00000,2018.00000,5.00000,30.00000,20.00000,53.00000,50.00000,19.41083,-155.28583,-107650000000000000.00000,45970000000000000.00000,61690000000000000.00000,-78720000000000000.00000,67750000000000000.00000,22930000000000000.00000
#import your data
# the first row isn't used
data=np.loadtxt('./mt_list',skiprows=1, delimiter=',')
latitude = data[:,7]
longitude = data[:,8]
yyyy,mm,dd=data[:,1],data[:,2],data[:,3]
hr,mn,ss = data[:,4],data[:,5],data[:,6]
index=data[:,0]

#call beachball function   --> put in comment this line if you don't want to draw again all beachballs
beachball(data)

######################################################################################################
# create a document element with multiple label style
kmlobj = KML.kml(
    KML.Document(
    )
)

for j in range(len(yyyy)):  #create the ref icons we will use
    kmlobj.Document.append(
        KML.Style(
            KML.IconStyle(
                KML.Icon(
                    KML.href('%s.png'%str(int(index[j]))),
                    KML.scale(0.6),   #scale the beachball in googleEarth
                ),
                KML.heading(0.0),
            ),
        id='beach_ball_%i'%j    #gives the icon a ref that will be used later
        ),
    )

# add images to the document element
for i in range(len(yyyy)):
    datum = str(date.date(int(yyyy[i]),int(mm[i]),int(dd[i])))
    ev_time = str(date.time(int(hr[i]),int(mn[i]),int(ss[i])))

    kmlobj.Document.append(
        KML.Placemark(
            #~ KML.name('%s'%str(int(index[i]))),   #uncomment this to add a name to the placemark (will always appear in GoogleEarth)
            KML.ExtendedData(                       #I add information about the earthquake, it appears in a table ('info' : value)
                KML.Data(
                    KML.value('%s'%datum),          #add value of the specific info
                name ='date'                        #name of'info' you add.
                ),
                KML.Data(
                    KML.value('%s'%ev_time),        #add value of the specific info
                name ='time'                        #name of 'info' you add.
                ),                                     #more data can be added, following the same structure (line 65-68)
            ),
            KML.styleUrl('#beach_ball_%i'%i),       #get the correct beachball in the directory as marker
            KML.Point(
                KML.coordinates(longitude[i],',',latitude[i]),
            ),

        ),
    )

print(etree.tostring(etree.ElementTree(kmlobj),pretty_print=True))

outfile = open('Focal_mechanism_devy.kml', 'wb') #save the kml structure code
outfile.write(etree.tostring(kmlobj, pretty_print=True))