This example demonstrates a simple SignalGenerator and how to add a generated GUI, that can be completely styled without programming.
It also demonstrates how to add an Oscilloscope to visualise the outgoing Signal.
The setup is a standard JUCE Audio Plugin project.
Add the module foleys_gui_magic to the project. It has a dependency to the juce::dsp module to create FFT and FrequencyResponce curves.
Instead of juce::AudioProcessor inherit from foleys::MagicProcessor.
Remove the following methods (from the declaration and the implementation a.k.a from the .h and .cpp file:
- bool hasEditor() const
- juce::AudioProcessorEditor* createEditor()
- void setStateInformation (const char*, int)
- void getStateInformation (juce::MemoryBlock&)
There are different kinds of visualisers, one is driven by MagicPlotSource. You can inherit that class to provide your own individual plot types.
To add the oscilloscope you can use the existing MagicOscilloscope. To use it, add a member, so you can push the samples for displaying:
private:
    foleys::MagicPlotSource* oscilloscope = nullptr;
And register it as a new MagicPlotSource in your AudioProcessor's constructor giving it an ID to recognise it in the GUI later:
oscilloscope = magicState.addPlotSource ("oscilloscope", std::make_unique<foleys::MagicOscilloscope>(0));
For the visualiser to work, you need to call the prepareToPlay on your magicState from your processor's prepareToPlay():
void SignalGeneratorAudioProcessor::prepareToPlay (double sampleRate, int samplesPerBlock)
{
    // ...
    magicState.prepareToPlay (sampleRate, samplesPerBlock);
}
And finally we push the samples to display. Note by choosing the place in your code you can decide, what to visualise. For instance you could create one plot before and one plot after your DSP code:
oscilloscope->pushSamples (buffer);
This is all that's necessary in the code.
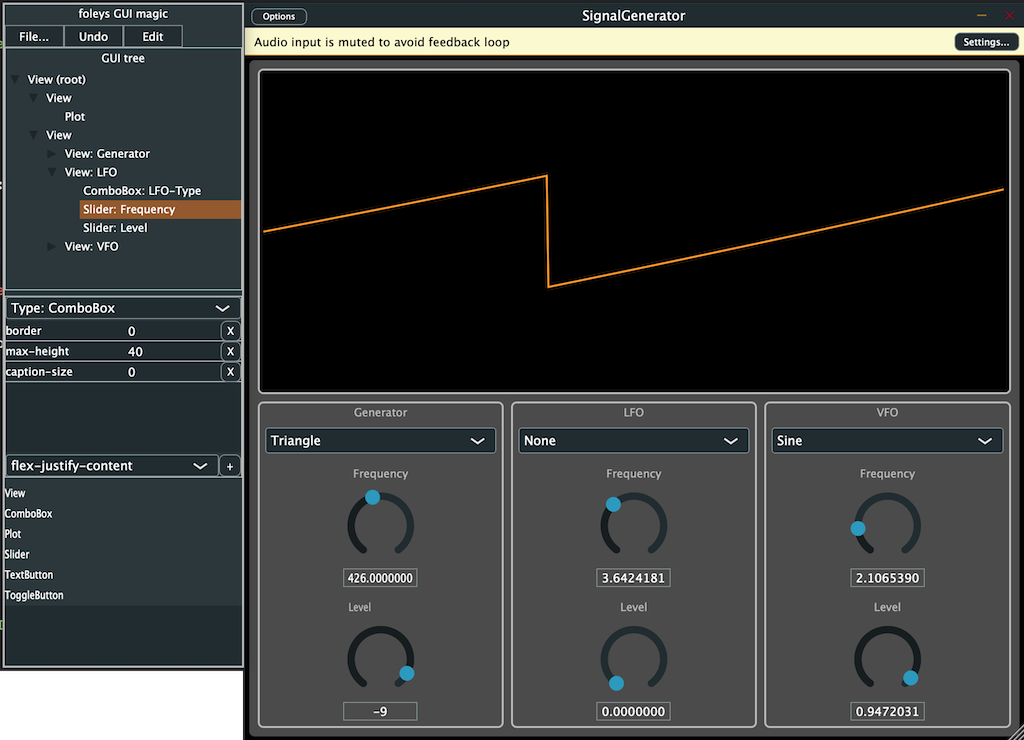
If you enabled in the foleys_gui_magic module the setting FOLEYS_SHOW_GUI_EDITOR_PALLETTE (the default), the you see the palette attached to your Plugin Editor. Here you can move the Nodes around and specify the properties.
To add the oscilloscope, drag a Plot node into a View add the source
property and select the oscilloscope from the dropdown. You should
see the generated Oscilloscope immediately.
Once you designed your GUI, you can save the resulting XML in your Project (Source or create a Resources folder) and use the Projucer to add it as binary resource. Re-save the Project and change the line to create the editor to this (assuming you named the GUI magic.xml):
return new foleys::MagicPluginEditor (magicState, BinaryData::magic_xml, BinaryData::magic_xmlSize);
And adding FOLEYS_SHOW_GUI_EDITOR_PALLETTE=0 to the preprocessor
defines in release avoids shipping your plugin with the Editor
attached :-)
That should be all.
Enjoy playing with it and let me know, if it works or what you wish to improve it.