The idea is to develop a webapp with "Plotly Dash - python" to allow the user to create its own star by inserting only two simple inputs:
- relative dimensions with respect to sun (R/R0)
- relative luminosity (L/L0)
By the knowledge of this information and using a mathematical, statistical, and graphical approach, such as the position and evolution on the Hertzsprung-Russell diagram and studied stars’ light curve, the dash App allows to see the star twinkle and its eventual end of life, through the use of simplified but attracting sequence of images and animation generated according to input data.
- In the main page the user will introduce two input parameters of the star he wants to create (radius and luminosity with respect to the Sun to give a clearer idea to the user about this values), the star position will be plotted on the HR diagram, in order to show where it’s positioned with respect to other known stars. According to the statistical, mathematical and graphical approach, useful and user-friendly tools will show the temperature, size, colour class of the star and, connected to that, the name of the star category.
- In the second page, will be created according to input data a catchy animation that shows the twinkle of the star, following the position of the red dot on the graph on the right making easy to understand that luminosity is varying in time, as well as allowing the user to see the periodicity of this luminosity change.
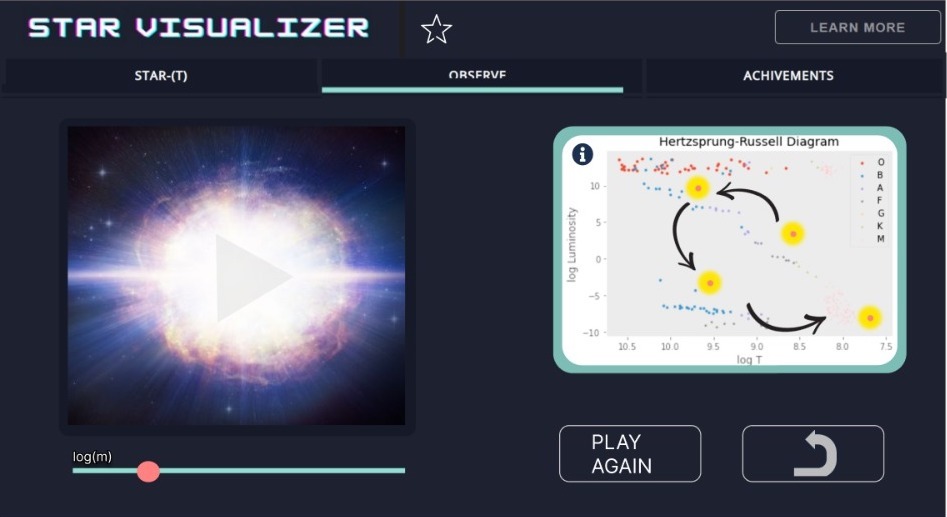
- In page 2 after clicking the button "end my star" the player will be able to observe the end of life of the star: this will start a short animation that describe all the phases of star evolution with some informative comments, as scientifically accurate as possible taking into account the initial mass, and also the path that the star follows on the HR diagram
- In the last page, there is a list of locked achievements that will be unlocked when the user “discovers” a new star type, if the correct parameters are selected in the initial page. The achievements will show not only the name of the star and a catchy icon, but also a short description of it in order to increase the knowledge of the user on the existing types of stars. The presence of achievements is also a useful way to make the webapp more stimulating, introducing in the player the curiosity on all the implemented stars, with the aim to “catch them all”.
The aim of the project is not to be an academic tool, but it’s made with the aim to increase curiosity of the majority of the public about the star variability topic and to make the public conscious about the evolution of it up to the end of life. The hope is that this simplified tool will encourage people more and more of this argument in order to enter in the already big space community. The user can retrieve information about graphs and data (e.g. what an HR diagram is) through different info box placed in strategic points into the app. The tools used to develop the webapp were Python and CSS for the coding and graphical part of the app, while Matlab was used for the preliminary data analysis.
The following space agency sources were consulted during the hackathon journey:
- https://gea.esac.esa.int/archive/documentation/GEDR3/Data_processing/chap_simulated/sec_cu2UM/ssec_cu2_variab.html
- https://starchild.gsfc.nasa.gov/docs/StarChild/questions/cepheids.html
- https://imagine.gsfc.nasa.gov/science/toolbox/timing1.html
- https://heasarc.gsfc.nasa.gov/docs/tess/software.html
- https://www.cosmos.esa.int/web/hipparcos/java-tools/light-curve
The space agency data were used to gain information about how the variability and luminosity of a star is measured and studied and data about variability and luminosity of the many different kind of star analyzed in the webapp.
Sources:
- https://www.cosmos.esa.int/web/hipparcos/java-tools/light-curve
- https://ui.adsabs.harvard.edu/abs/2002PASP..114..689W/abstract
- https://ui.adsabs.harvard.edu/abs/2002PASP..114..689W/abstract
- https://ui.adsabs.harvard.edu/abs/2017MNRAS.465..173P/abstract
- https://www.aavso.org/sites/default/files/vsots/rvtau.pdf
- https://astronomy.swin.edu.au/cosmos/c/cepheid+variable+stars#:~:text=There%20are%20actually%20two%20classes,between%2010%20and%20100%20days.
- http://ogle.astrouw.edu.pl/atlas/delta_Sct.html
- P. van Heerden, P. Martinez, D. Kilkenny , “Determination of the rotation periods for the roAp stars HD 9289 and HD 190290 and non-detection of rotational amplitude modulation in the roAp stars HD 75425 and HD 217522”, Monthly Notices of the Royal Astronomical Society, Volume 426, Issue 2, 21 October 2012, Pages 969–974, https://doi.org/10.1111/j.1365-2966.2012.21814.x
- Karttunen, “Fundamental Astronomy”, 1996, https://link.springer.com/book/10.1007/978-3-662-03215-2
- C. Sneden et al., “The RRc Stars: Chemical Abundances and Envelope Kinematics”, The Astrophysical Journal, Volume 848, Number 1.
- M. J. Ireland et al. “Pulsation of M-type Mira variables with moderately different mass: search for observable mass effects”, Monthly Notices of the Royal Astronomical Society, Volume 355, Issue 2, December 2004, Pages 444–450
- https://mast.stsci.edu/portal/Mashup/Clients/Mast/Portal.html
- https://gea.esac.esa.int/archive/documentation/GEDR3/Data_processing/chap_simulated/sec_cu2UM/ssec_cu2_variab.html
- Plotly Dash - ptyhon
- Figma
- Github
- Python ®
- CSS


