-
Notifications
You must be signed in to change notification settings - Fork 3
/
P3_rasterPackage_solutions_I-v1.Rmd
228 lines (153 loc) · 4.23 KB
/
P3_rasterPackage_solutions_I-v1.Rmd
1
2
3
4
5
6
7
8
9
10
11
12
13
14
15
16
17
18
19
20
21
22
23
24
25
26
27
28
29
30
31
32
33
34
35
36
37
38
39
40
41
42
43
44
45
46
47
48
49
50
51
52
53
54
55
56
57
58
59
60
61
62
63
64
65
66
67
68
69
70
71
72
73
74
75
76
77
78
79
80
81
82
83
84
85
86
87
88
89
90
91
92
93
94
95
96
97
98
99
100
101
102
103
104
105
106
107
108
109
110
111
112
113
114
115
116
117
118
119
120
121
122
123
124
125
126
127
128
129
130
131
132
133
134
135
136
137
138
139
140
141
142
143
144
145
146
147
148
149
150
151
152
153
154
155
156
157
158
159
160
161
162
163
164
165
166
167
168
169
170
171
172
173
174
175
176
177
178
179
180
181
182
183
184
185
186
187
188
189
190
191
192
193
194
195
196
197
198
199
200
201
202
203
204
205
206
207
208
209
210
211
212
213
214
215
216
217
218
219
220
221
222
223
224
225
226
227
---
title: "P3 Solutions to exercises with raster data (parts 1-2)"
author: "João Gonçalves"
date: "28 de Novembro de 2017"
output:
html_document:
self_contained: no
---
```{r setup, include=FALSE}
knitr::opts_chunk$set(echo = TRUE)
knitr::opts_chunk$set(fig.path = "img/")
knitr::opts_chunk$set(fig.width = 5, fig.height = 4.5, dpi = 80)
```
Below are the solutions to [these](http://r-exercises.com/2017/12/27/exercises-with-raster-data-parts-1-2/)
exercises on raster data analysis (parts 1-2).
```{r P3_solution_ex1}
####################
# #
# Exercise 1 #
# #
####################
library(raster)
## Create a folder named data-raw inside the working directory to place downloaded data
if(!dir.exists("./data-raw")) dir.create("./data-raw")
## If you run into download problems try changing: method = "wget"
download.file("https://raw.githubusercontent.com/joaofgoncalves/R_exercises_raster_tutorial/master/data/srtm_pnpg.zip",
"./data-raw/srtm_pnpg.zip", method = "auto")
## Uncompress the zip file
unzip("./data-raw/srtm_pnpg.zip", exdir = "./data-raw")
# Load raster file into R
rst <- raster("./data-raw/srtm_pnpg.tif")
# Number of rows, columns and layers
dim(rst)
# Number of rows
nrow(rst)
# Number of columns
ncol(rst)
# Number of layers
nlayers(rst)
# Number of cells
ncell(rst)
```
```{r P3_solution_ex2}
####################
# #
# Exercise 2 #
# #
####################
# Spatial resolution (pixel size in x and y dimensions)
res(rst)
# Coordinate reference system: Datum/Ellipsoid: WGS 1984, Projection: UTM 29N, Units: meters
crs(rst)
```
```{r P3_solution_ex3}
####################
# #
# Exercise 3 #
# #
####################
# The extent object
extent(rst)
# Lenght in meters
xmax(rst) - xmin(rst)
# Height in meters
ymax(rst) - ymin(rst)
```
```{r P3_solution_ex4}
####################
# #
# Exercise 4 #
# #
####################
# Mean
cellStats(rst, mean)
# Standard-deviation
cellStats(rst, sd)
```
```{r P3_solution_ex5}
####################
# #
# Exercise 5 #
# #
####################
# Raster quantiles
cellStats(rst, stat = function(x, ...) quantile(x, probs = c(0.01, 0.25, 0.5, 0.75, 0.99), ...))
```
```{r P3_solution_ex6, eval=FALSE, echo=TRUE}
####################
# #
# Exercise 6 #
# #
####################
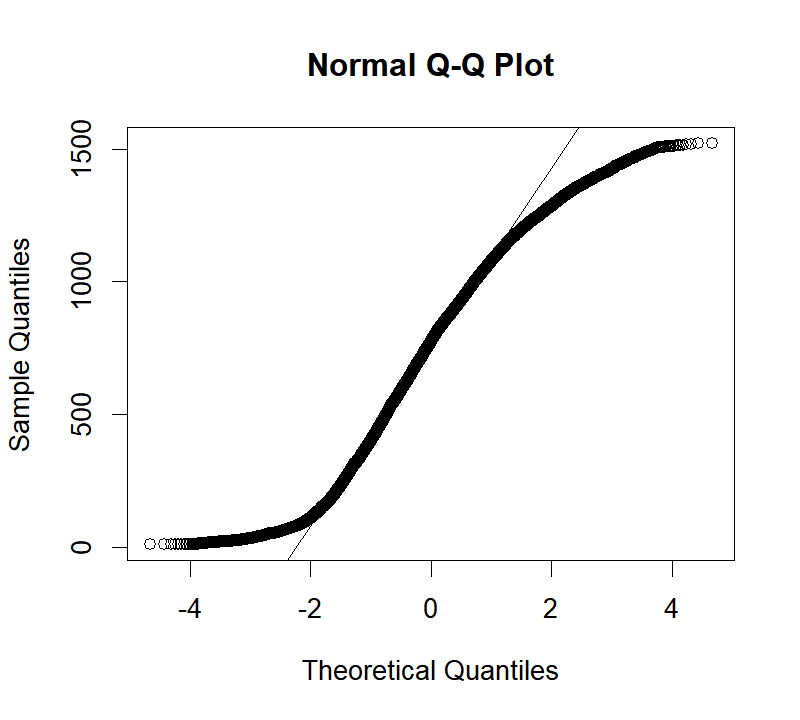
# Get values for the raster (memory may be an issue)
x <- values(rst)
# Make the plot (notice higher deviations for values above the average)
qqnorm(x)
qqline(x)
```

```{r P3_solution_ex7}
####################
# #
# Exercise 7 #
# #
####################
set.seed(12345)
# Generate random points with uniform distribution bounded by the raster extent
xyRandPoints <- data.frame(x = runif(100, xmin(rst), xmax(rst)), y = runif(100, ymin(rst), ymax(rst)))
# Convert the initial data frame into a SpatialPoints objects for clarity
xyRandPoints <- SpatialPoints(xyRandPoints, proj4string = crs(rst))
# Extract values
xyVals <- extract(rst, xyRandPoints)
print(xyVals)
```
```{r P3_solution_ex8}
####################
# #
# Exercise 8 #
# #
####################
rstFt <- rst / 0.3048
rstStack <- stack(rst, rstFt)
print(rstStack)
```
```{r P3_solution_ex9}
####################
# #
# Exercise 9 #
# #
####################
# Bounding coordinates
xmin <- 554615
xmax <- 589015
ymin <- 4618355
ymax <- 4654705
# Create the extent object by defining the bounding coordinates
newExtent <- extent(xmin, xmax, ymin, ymax)
# Crop
cropRst <- crop(rst, newExtent)
print(cropRst)
```
```{r P3_solution_ex10}
####################
# #
# Exercise 10 #
# #
####################
# Target CRS
targetCRS <- CRS("+init=epsg:3035")
# Reproject data
rst_ETRS89_LAEA <- projectRaster(rst, crs = targetCRS, res = 100, method = 'bilinear')
print(rst_ETRS89_LAEA)
```