Hello
First of all, this is a thought around a website metrics management, is not the only way, but is one way for a high level overview.
How to read this ...
- i'm focused to share some concept about website monitoring
- i'm sharing a possible way to manage in kubernetes
- i'm using some other tools in kubernetes just because i'm evaluating this for other purpose
However you can reach the GOAL just using docker and crontab for example
Well ... a website is a product itself,
it could be a Wordpress, a Magento ecommerce or a structured multiple applications that owns each ones a different section of the website.
However if running a business on top, you should move your evolution as a customer perspective:
- how long does is take the website asnwer ?
- is the response time common for all sections ?
- new versions/deployments are better than before for the customer ?
You know, if the response time is more than X seconds ... and you are selling a common gadgets that could be retrieved elsewhere , you are losing money and customer affiliation.
There are also some others problems... when someone in your company or a customer will say ... the website il slow
- Faster from my fiber home connection
- Faster from my mobile premium plus SIM
- Slow from wireless
- Fast from wireless
- No idea
- Faster than … ?!?! compared to ... ?!?!
No, look how it's slow (2g connection in the sahara desert)
Now, we know what we need ... DATA
Evaluate those during a long therm periode looking for performance
- release by release
- feature by feature
- etc etc
First of all we have to test our websites on the customer position... so no 1gbit inline connection with 0.00001 roundtrip :)
From the multitude of products , webtest , lighthouse , selenium and so on i really like sitespeed.io
- be able to have an objective trend
- check the goodness of releases
You have to know your product and your customer ...
If you own the product you know that the customer is "forced" to buy by you. Immgine to are Apple, you know that customers are affiliated to you... so if something is slow, probably even if the device is available in other websites the customer will wait the answer.
On the opposite side if you are a retailer , and the product is quite common
with no brandlove etc etc ... if the website is slow the user will change immediatly the website to land to somewhere else.
we usually define a slowness by a perception.
However , in 2020 you know the Data that comes from GA and understand when people leave a page , after some amount of time.
Consider those, rate and the timing to tune the threadshold
- Bounce
- Leave/Exit
and create the awareness about the limits and improvements you can achieve.
Example. If a search take more than 10seconds, say ciao ciao to the customer.
As said, when you mesure the speed you have to move yourself in the customer side ... so not all people has 1gbit connection , maybe the major are using mobile , maybe your host is in US and the customer in KR.
So ... internet connection should reflect the avg/wrost scenario
Believe me that those data https://www.speedtest.net/global-index are quite optimistic :) i appreciate instead the documentation of sitespeed that has classified 4 networks
https://www.sitespeed.io/documentation/sitespeed.io/connectivity/
- 3g
- 3gfast
- 3gslow
- cable
I'd like to say that in 2020 cable and 3gfast cover perfectly the wrost scenario
Even if you don't agree with the speed category, remember to look the graphs and the metrics considering the DELTA
This tool is open source , has a huge extension , in this scenario
i'll use only parts of that since i don't need the video recording, or HAR files and so on.
A full report could be useful to check all feature and you can find here
https://lorenzogirardi.github.io/sitespeedio-results/
and you can have those results only with using the docker image
docker run --rm -v "$(pwd):/sitespeed.io" sitespeedio/sitespeed.io:15.2.0 https://www.k8s.it/
is know easy understand that you can extend in crontab this code and add some other option to store metrics and results files in s3 for example
/usr/bin/docker run --privileged --shm-size=1g --rm --network=cable sitespeedio/sitespeed.io httos://www.example.com -v -b chrome --video --speedIndex -c cable --browsertime.iterations 1 --s3.key S3_KEY --s3.secret S3_SECRET --s3.bucketname S3_BUCKET --s3.removeLocalResult true --s3.path S3_PATH www.ecample.com --graphite.host GRAPHITE_HOST --graphite.port GRAPHITE_PORT --graphite.namespace GRAPHITE_PREFIX
Since we have identified the tool i have to specify the use case
- I need only metrics in this example because, so i don't need to store the output artifact
- I want to store the metrics in influxdb
- I want to run it not as a docker but inside kubernetes
- TBD i'd like to orchestrate actions
The sitespeed.io docker fit perfectly in a kubernetes cronjob vision
https://kubernetes.io/docs/concepts/workloads/controllers/cron-jobs/
is done to start, execute an action and exit
However i'd like to explore a workflow manager ... not just for this case but also to exend some other jobs
I chose this product because i was interested to have something similar to Rundeck , but with more extended capability in order to be possible build a ci/cd without spinnaker
https://argoproj.github.io/
The installation is quite easy , i've just trick a configmap due to volume mount problem genereted by my small kubernetes installation
For a basic installation you need to create a dedicated namespace
kubectl create namespace argo
and than deploy the argo infrastructure (server and workflow)
kubectl apply -n argo -f https://raw.githubusercontent.com/argoproj/argo/stable/manifests/install.yaml
NAMESPACE      NAME                                       READY   STATUS      RESTARTS   AGE
argo           argo-server-6c886c5b77-l8jfv               1/1     Running     1          2d13h
argo           workflow-controller-65948977d-zc9vt        1/1     Running     0          2d14h
As mentioned before i discover a bug (just because i use containerd instead docker in microk8s) , running the firt job
MountVolume.SetUp failed for volume "docker-lib" : hostPath type check failed: /var/lib/docker is not a directory
However adding
data:
  config: |
    containerRuntimeExecutor: pns
in workflow-controller-configmap
i fixed the issue.
Well now Argo is running and you can interact with the web UI or creating a services and a ingress configuration or with the port forwarding.
Since i'm now experimenting the solution i'm just using the second option.
$ kubectl -n argo port-forward deployment/argo-server 2746:2746
Forwarding from 127.0.0.1:2746 -> 2746
Forwarding from [::1]:2746 -> 2746
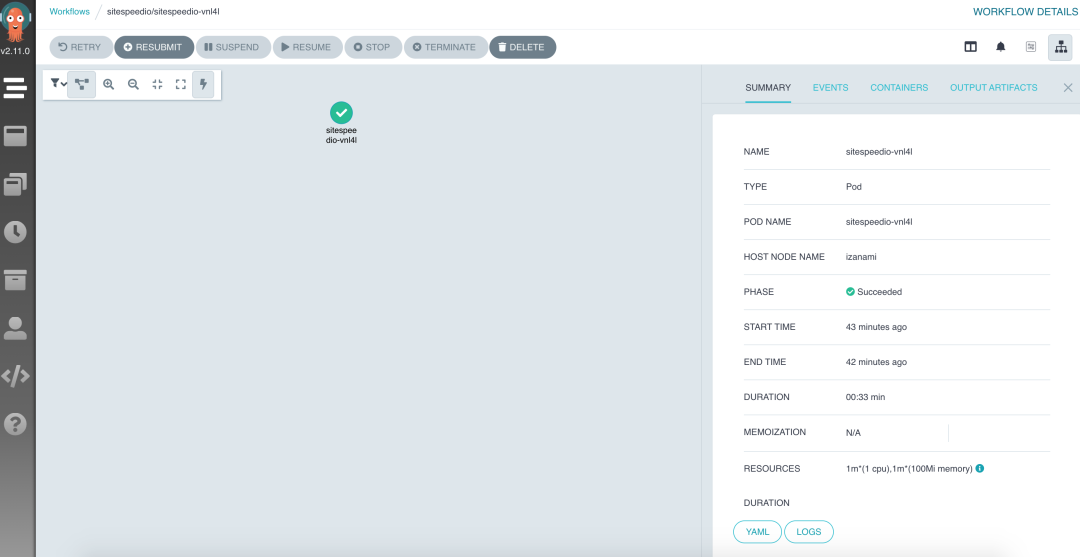
The UI interface is pretty clean and the authentication model follow the RBAC policy
The editor as well is really good and if i have to think about a solution to share to other teams/depts , this has a good level of abstraction (at least you need to know what is contab)
All informations are shared with the most relevant needs
Events could be retrieved and evaluated as well
Last but not least .... logs are in the UI
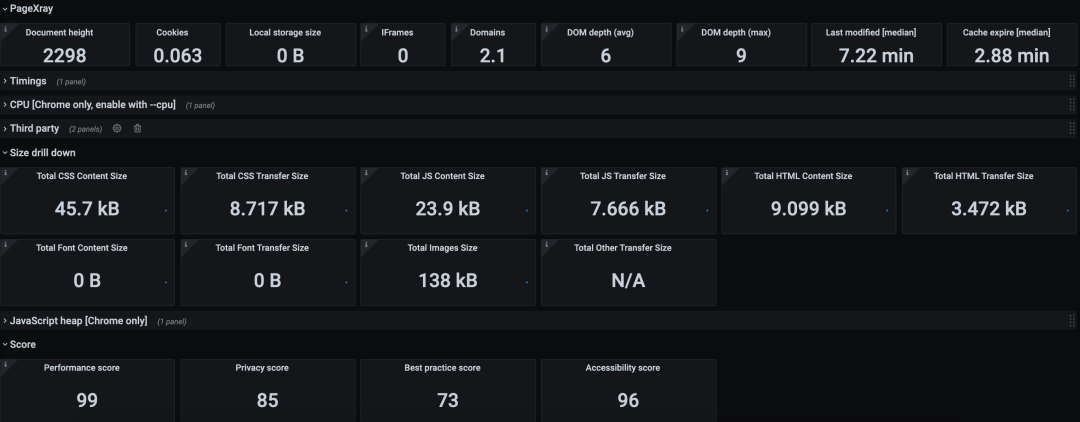
We are now able to see the metrics in grafana...
you have 2 option , what is used in the
001-argo-job-sitespeedio.yaml
is the influxdb backend that could be rendered using
LIVE VIEW https://services.k8s.it/grafana/d/000000053/pagesummary-influxdb?orgId=2&refresh=15m
However you can also use graphite backend with the same metrics (even more with provided dashboards)
Sitespeed is really good to have an high level view but also details that probably could save load time.
The introduction of Argo can orchestrate multiple checks on all pages/application you need to monitor without a specific crontab time for each job but considering a producer/consumer workflow.


