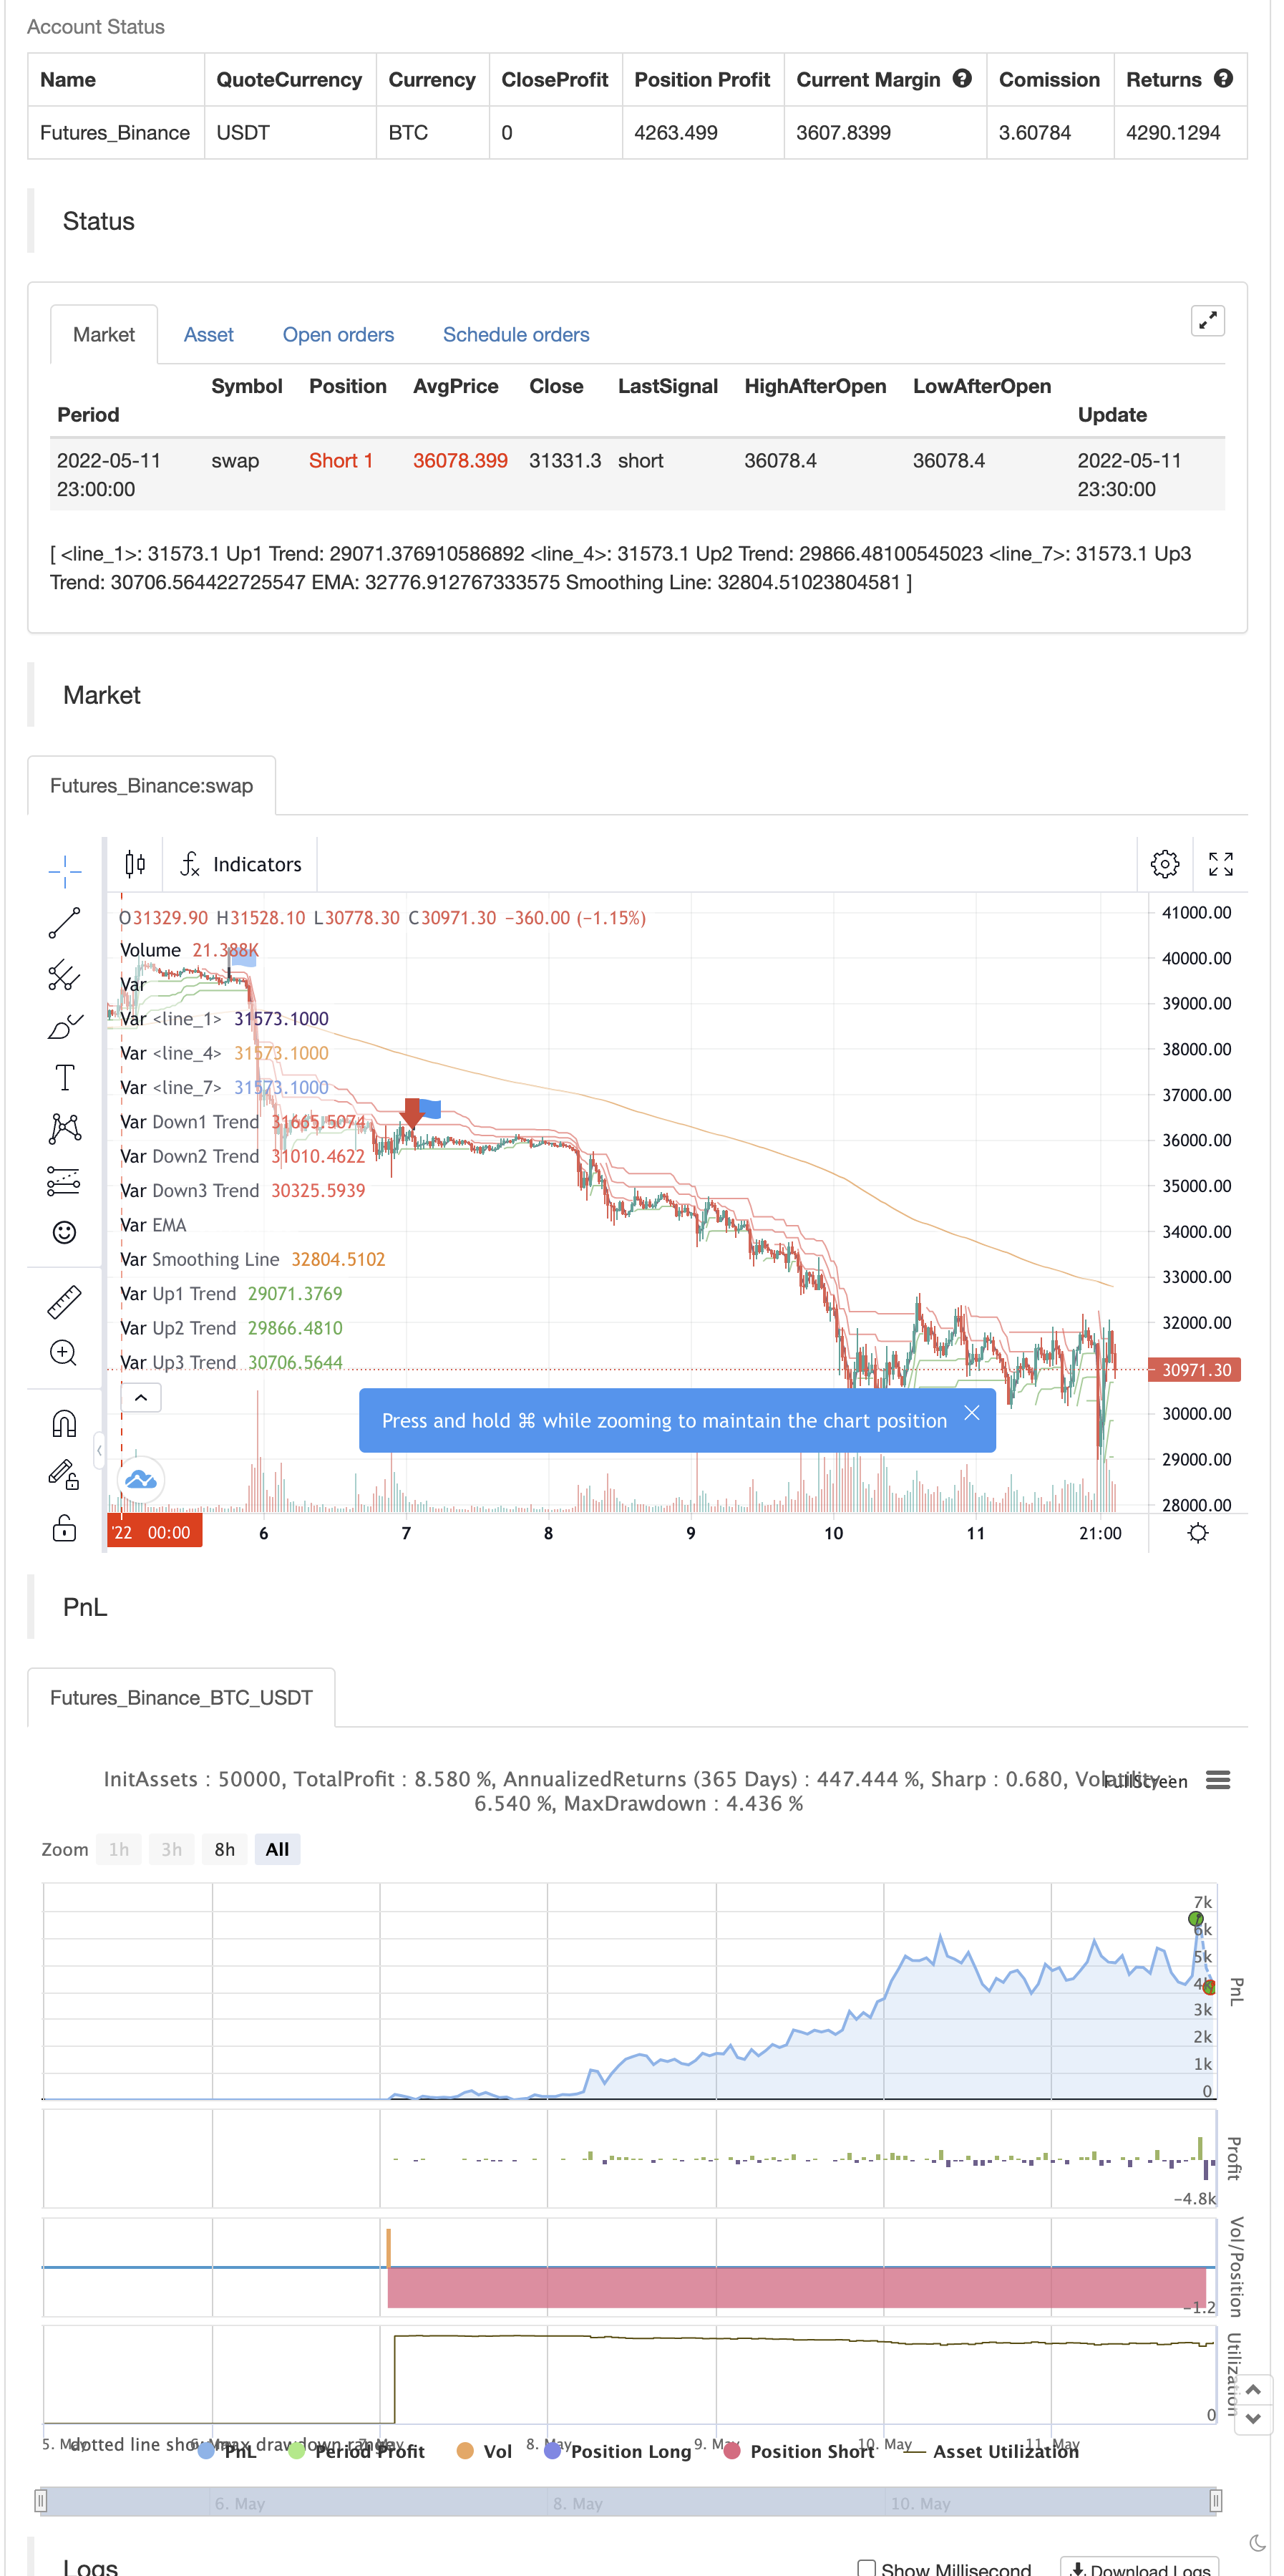
策略名称
Crodl's Supertrend
策略作者
张超
策略描述
This Indicator is using the supertrend with 3 different inputs as confirmation as well as the 200 EMA which will give us the data for an up or down trend. then it is looking for the stoch indicator to confirm if there is a cross under 30 for a long and above 70 for a short.
backtest
策略参数
| 参数 | 默认值 | 描述 |
|---|---|---|
| v_input_1 | 12 | ATR1 Length |
| v_input_float_1 | 3 | Factor1 |
| v_input_2 | 11 | ATR2 Length |
| v_input_float_2 | 2 | Factor2 |
| v_input_3 | 10 | ATR3 Length |
| v_input_float_3 | true | Factor3 |
| v_input_int_1 | 200 | Length |
| v_input_4_close | 0 | Source: close |
| v_input_int_2 | false | Offset |
| v_input_5 | 13 | Length |
| v_input_6 | 7 | MA Length |
| v_input_int_4 | 14 | %K Length |
| v_input_int_5 | true | %K Smoothing |
| v_input_int_6 | 3 | %D Smoothing |
| v_input_string_1 | 0 | (?Smoothing)Method: SMA |
| v_input_int_3 | 5 | Length |
源码 (PineScript)
/*backtest
start: 2022-05-05 00:00:00
end: 2022-05-11 23:59:00
period: 30m
basePeriod: 15m
exchanges: [{"eid":"Futures_Binance","currency":"BTC_USDT"}]
*/

// Visit Crodl.com for our Premium Indicators
// https://tradingbot.crodl.com to use our free tradingview bot to automate any indicator.
//@version=5
indicator("Crodl's Supertrend", overlay=true, timeframe="", timeframe_gaps=true)

atrPeriod1 = input(12, "ATR1 Length")
factor1 = input.float(3.0, "Factor1", step = 0.01)

[supertrend1, direction1] = ta.supertrend(factor1, atrPeriod1)

bodyMiddle1 = plot((open + close) / 2, display=display.none)
upTrend1 = plot(direction1 < 0 ? supertrend1 : na, "Up1 Trend", color = color.green, style=plot.style_linebr)
downTrend1 = plot(direction1 < 0? na : supertrend1, "Down1 Trend", color = color.red, style=plot.style_linebr)

atrPeriod2 = input(11, "ATR2 Length")
factor2 = input.float(2.0, "Factor2", step = 0.01)

[supertrend2, direction2] = ta.supertrend(factor2, atrPeriod2)

bodyMiddle2 = plot((open + close) / 2, display=display.none)
upTrend2 = plot(direction2 < 0 ? supertrend2 : na, "Up2 Trend", color = color.green, style=plot.style_linebr)
downTrend2 = plot(direction2 < 0? na : supertrend2, "Down2 Trend", color = color.red, style=plot.style_linebr)

atrPeriod3 = input(10, "ATR3 Length")
factor3 = input.float(1.0, "Factor3", step = 0.01)

[supertrend3, direction3] = ta.supertrend(factor3, atrPeriod3)

bodyMiddle3 = plot((open + close) / 2, display=display.none)
upTrend3 = plot(direction3 < 0 ? supertrend3 : na, "Up3 Trend", color = color.green, style=plot.style_linebr)
downTrend3 = plot(direction3 < 0? na : supertrend3, "Down3 Trend", color = color.red, style=plot.style_linebr)

len = input.int(200, minval=1, title="Length")
src = input(close, title="Source")
offset = input.int(title="Offset", defval=0, minval=-500, maxval=500)
out = ta.ema(src, len)
plot(out, title="EMA", color=color.white,linewidth=2, offset=offset)

ma(source, length, type) =>
    switch type
        "SMA" => ta.sma(source, length)
        "EMA" => ta.ema(source, length)
        "SMMA (RMA)" => ta.rma(source, length)
        "WMA" => ta.wma(source, length)
        "VWMA" => ta.vwma(source, length)

typeMA = input.string(title = "Method", defval = "SMA", options=["SMA", "EMA", "SMMA (RMA)", "WMA", "VWMA"], group="Smoothing")
smoothingLength = input.int(title = "Length", defval = 5, minval = 1, maxval = 100, group="Smoothing")

smoothingLine = ma(out, smoothingLength, typeMA)
plot(smoothingLine, title="Smoothing Line", color=#f37f20, offset=offset, display=display.none)
//////
l = input(13, title='Length')
l_ma = input(7, title='MA Length')
t = math.sum(close > close[1] ? volume * (close - close[1]) : close < close[1] ? volume * (close - close[1]) : 0, l)
m = ta.sma(t, l_ma)


//////
periodK = input.int(14, title="%K Length", minval=1)
smoothK = input.int(1, title="%K Smoothing", minval=1)
periodD = input.int(3, title="%D Smoothing", minval=1)
k = ta.sma(ta.stoch(close, high, low, periodK), smoothK)
d = ta.sma(k, periodD)

stochbuy= float(k) < 30  and ta.crossover(k,d)
stochsell=float(k) > 70  and ta.crossover(d,k)

long =(( ((direction1 < 0 and direction2 < 0 ) or (direction2 < 0  and direction3 < 0 ) and (direction1 < 0 or direction3 < 0 ) )and open > out) and t > 0) and stochbuy
short=(( ((direction1 > 0 and direction2 > 0 ) or (direction2 > 0  and direction3 > 0 ) and (direction1 > 0 or direction3 > 0 ) )and open < out) and t < 0) and stochsell

plotshape(long, title = "Long Signal", location=location.belowbar, style=shape.labelup, color=color.green, textcolor=color.white, size=size.small, text="Long")
plotshape(short, title = "Short Signal", location=location.abovebar, style=shape.labeldown, color=color.red, textcolor=color.white, size=size.small, text="Short")

alertcondition(long, title='Long Signal', message=' Buy')
alertcondition(short, title='Short Signal', message=' Sell')

if long
    strategy.entry("Enter Long", strategy.long)
else if short
    strategy.entry("Enter Short", strategy.short)
策略出处
https://www.fmz.com/strategy/362916
更新时间
2022-05-13 17:43:21
