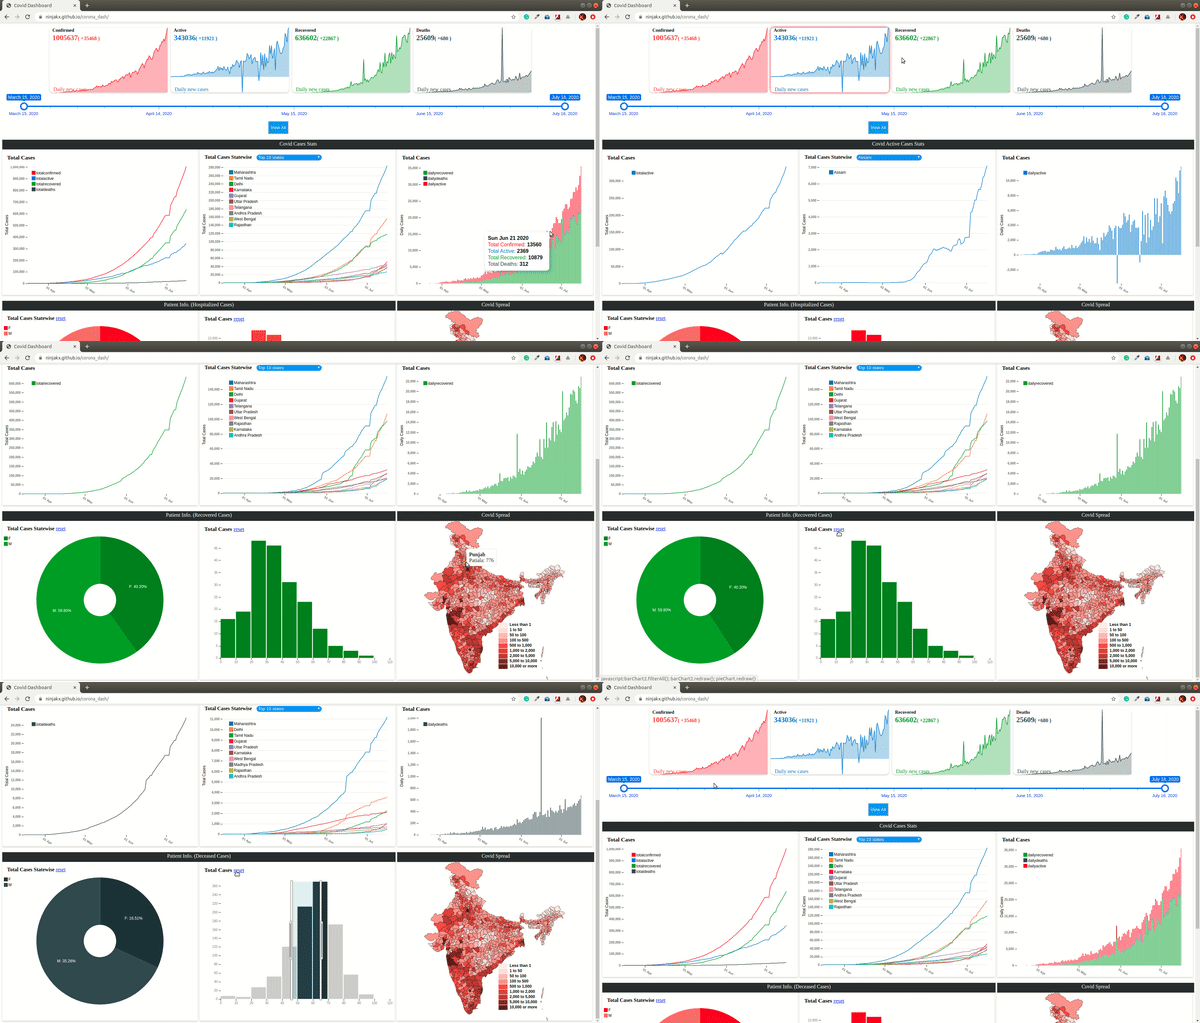
Data have been fetched from COVID19-India's API
They were using google analytics charts so I have ported all the graphs to d3/dc starting from the scratch and have added more functionality to it.
Works best on Desktop/Tablet.
Special thanks to Gordon who helped me clearing my doubts and queries with a great explanation.
Note: There may be some bugs which are overlooked by me. Being a non web dev this is the best I can do 😊
Note: Since there are some changes made in the api so some of the functionalities won't work including hover info box and filter by label on map.
The total cases and Statewise Cases Graphs are having constant values after 26th Oct 2020. It's due to the Api :
- https://api.covid19india.org/data.json
- https://api.rootnet.in/covid19-in/unofficial/covid19india.org/statewise/history
They are storing the same values after october 2020.
