A novel strategy for interpreting laboratory values in intensive care unit patients: What is normal in the era of precision medicine?
Abstract:
Importance: Laboratory data are frequently collected throughout the care of critically ill patients. Currently, these data are interpreted by comparison to values from healthy outpatient volunteers. Whether this is the most useful comparison has yet to be demonstrated.
Objective: We sought to understand how the distribution of intensive care unit (ICU) laboratory values differs from the reference range, and how these distributions are related to patient outcomes. We hypothesized that the distributions of the laboratory values for critically ill patients would diverge significantly from the hospital reference interval, and that there might be differences in the value range among critically ill patients that are associated with specific outcomes.
Design: Cross-sectional study of a large critical care database, the Medical Information Mart for Intensive Care database (MIMIC), from 2001 to 2012. All patients in MIMIC for the years above were included. Common laboratory measurements over the time window of interest were sampled.
Setting: The MIMIC database is collected from ICU data from a large tertiary medical center in Boston, MA, USA. The data is collected from medical, cardiac, neurologic, and surgical ICUs.
Participants: All patients from all ICUs during the study period were included.
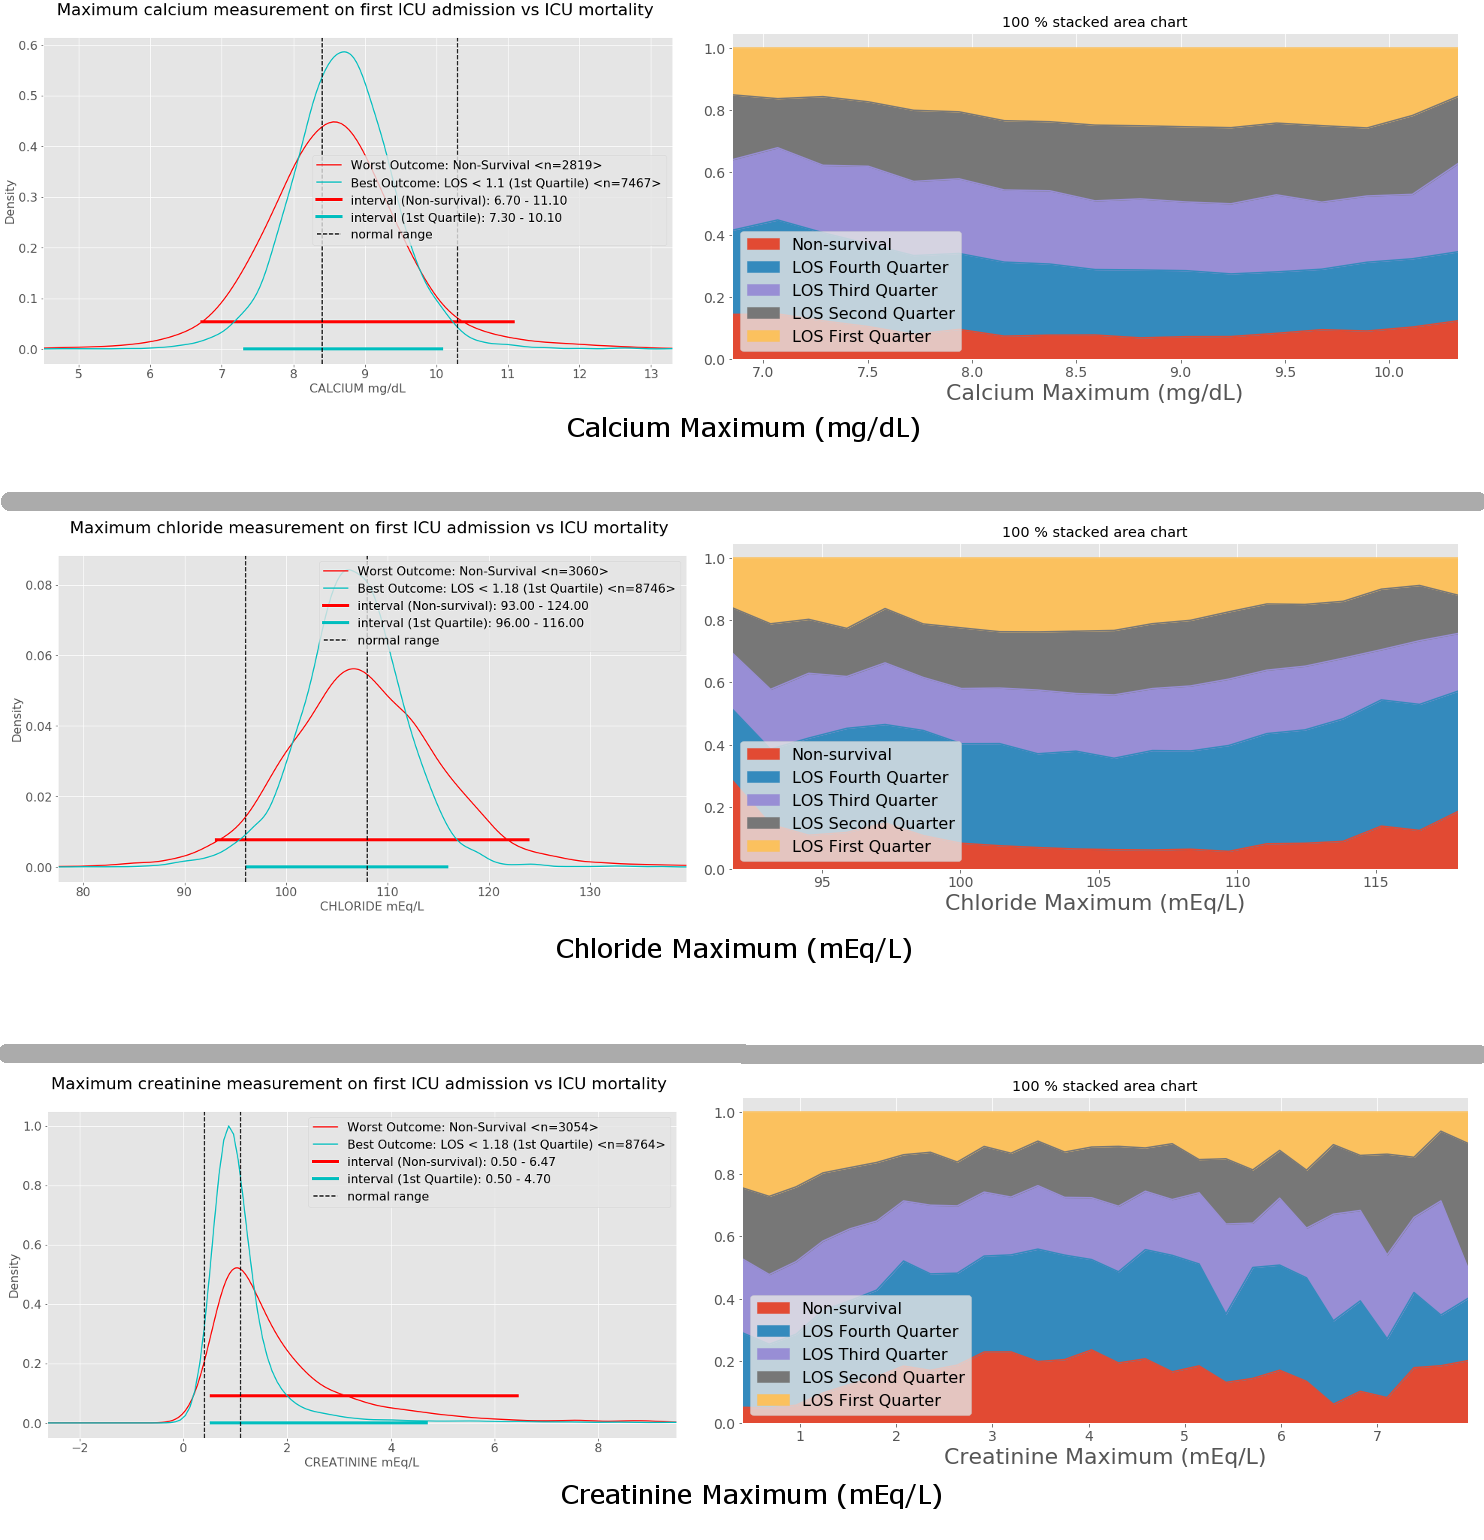
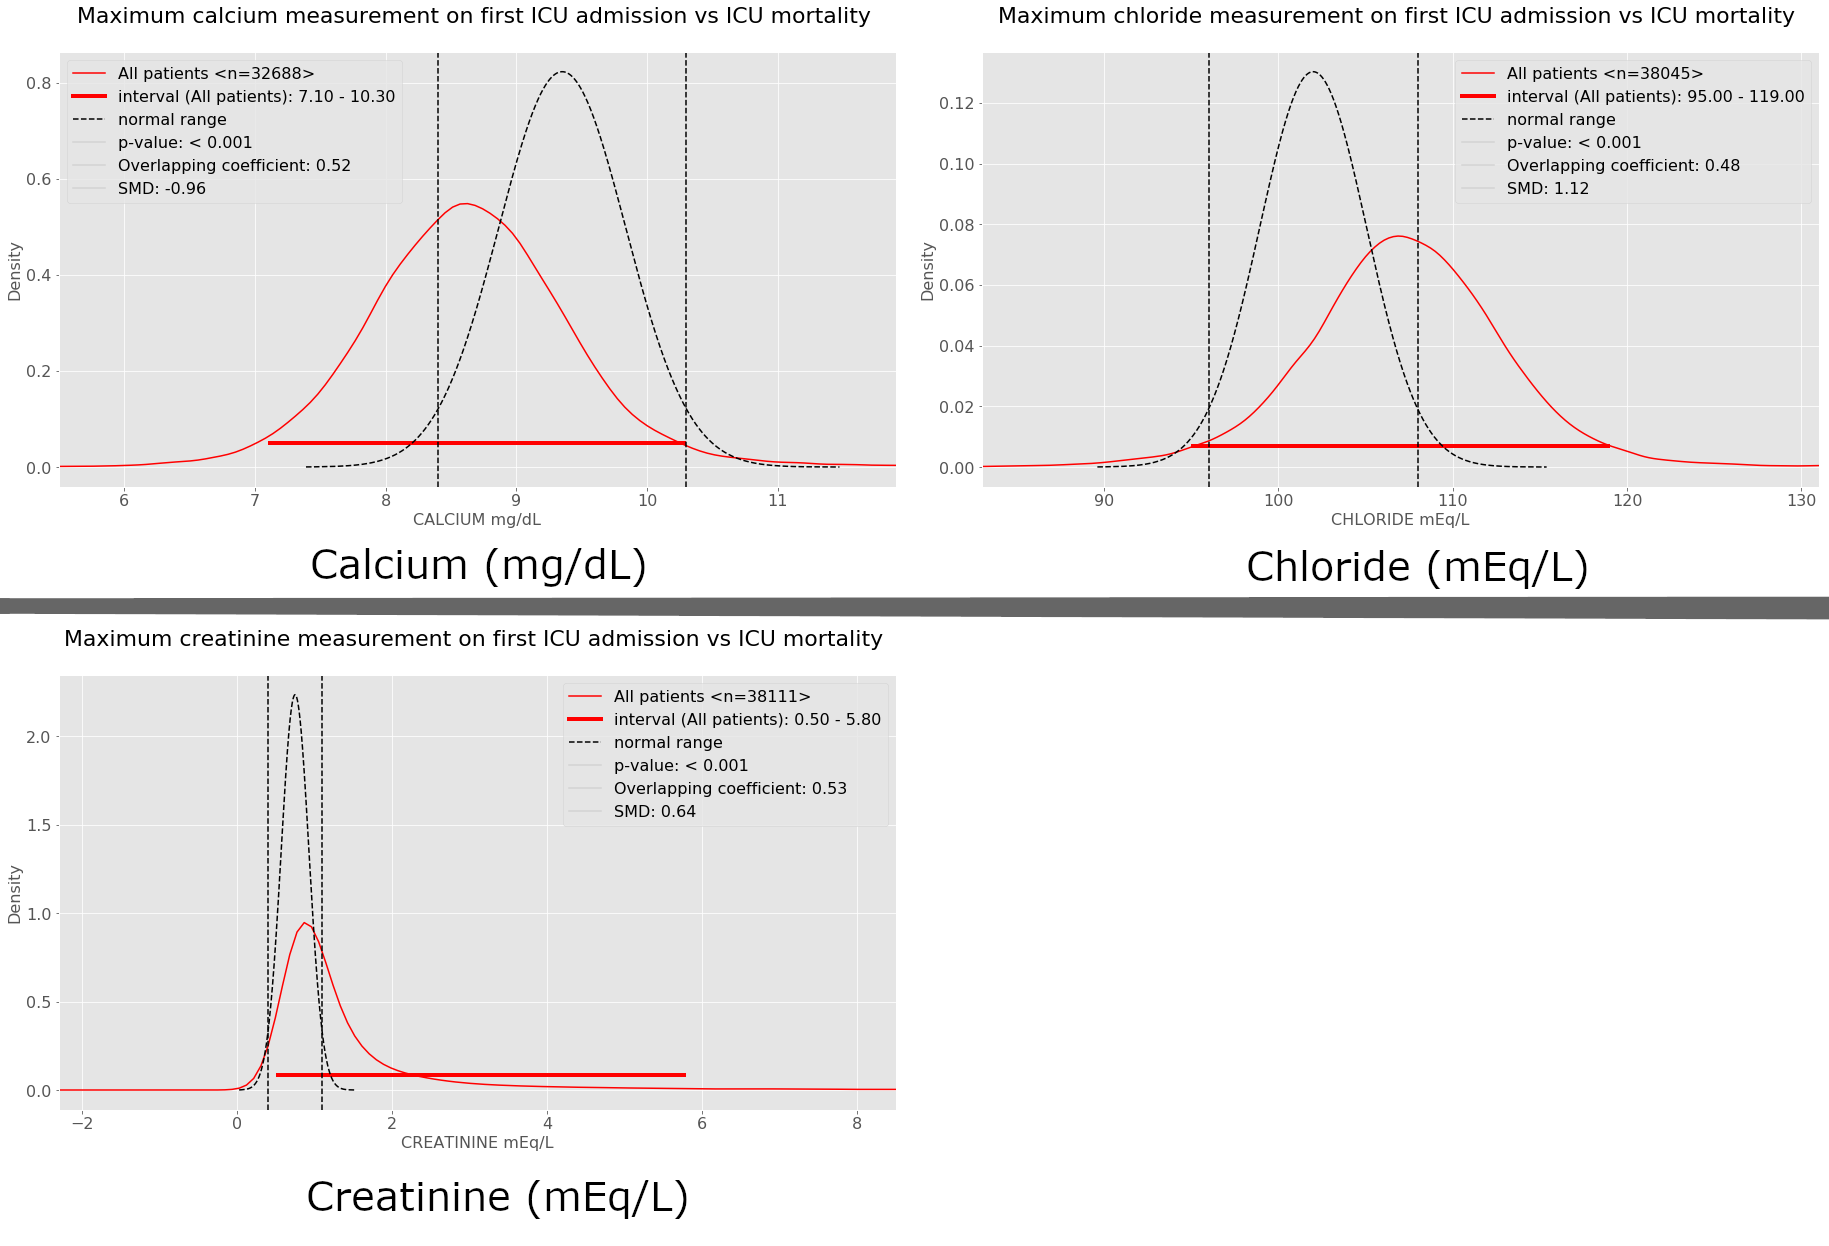
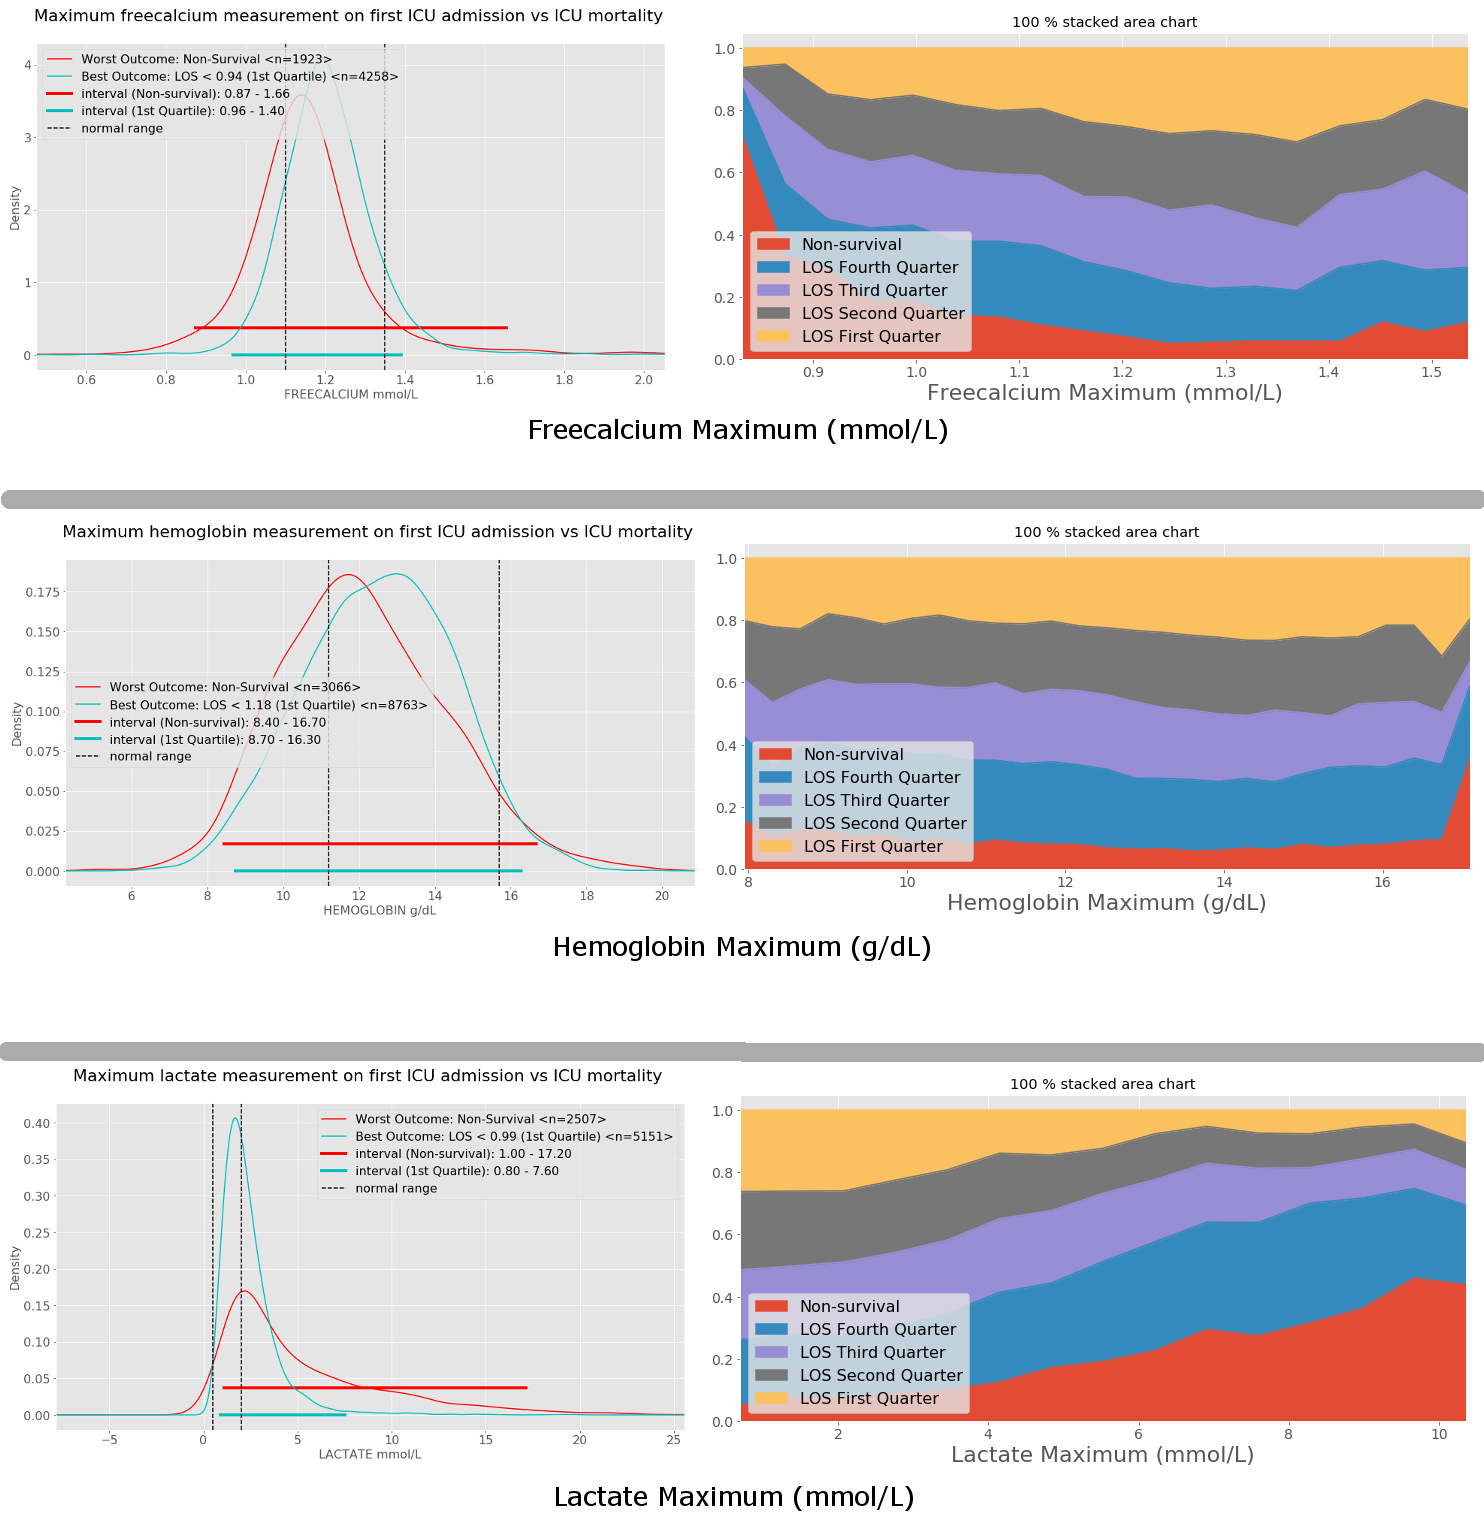
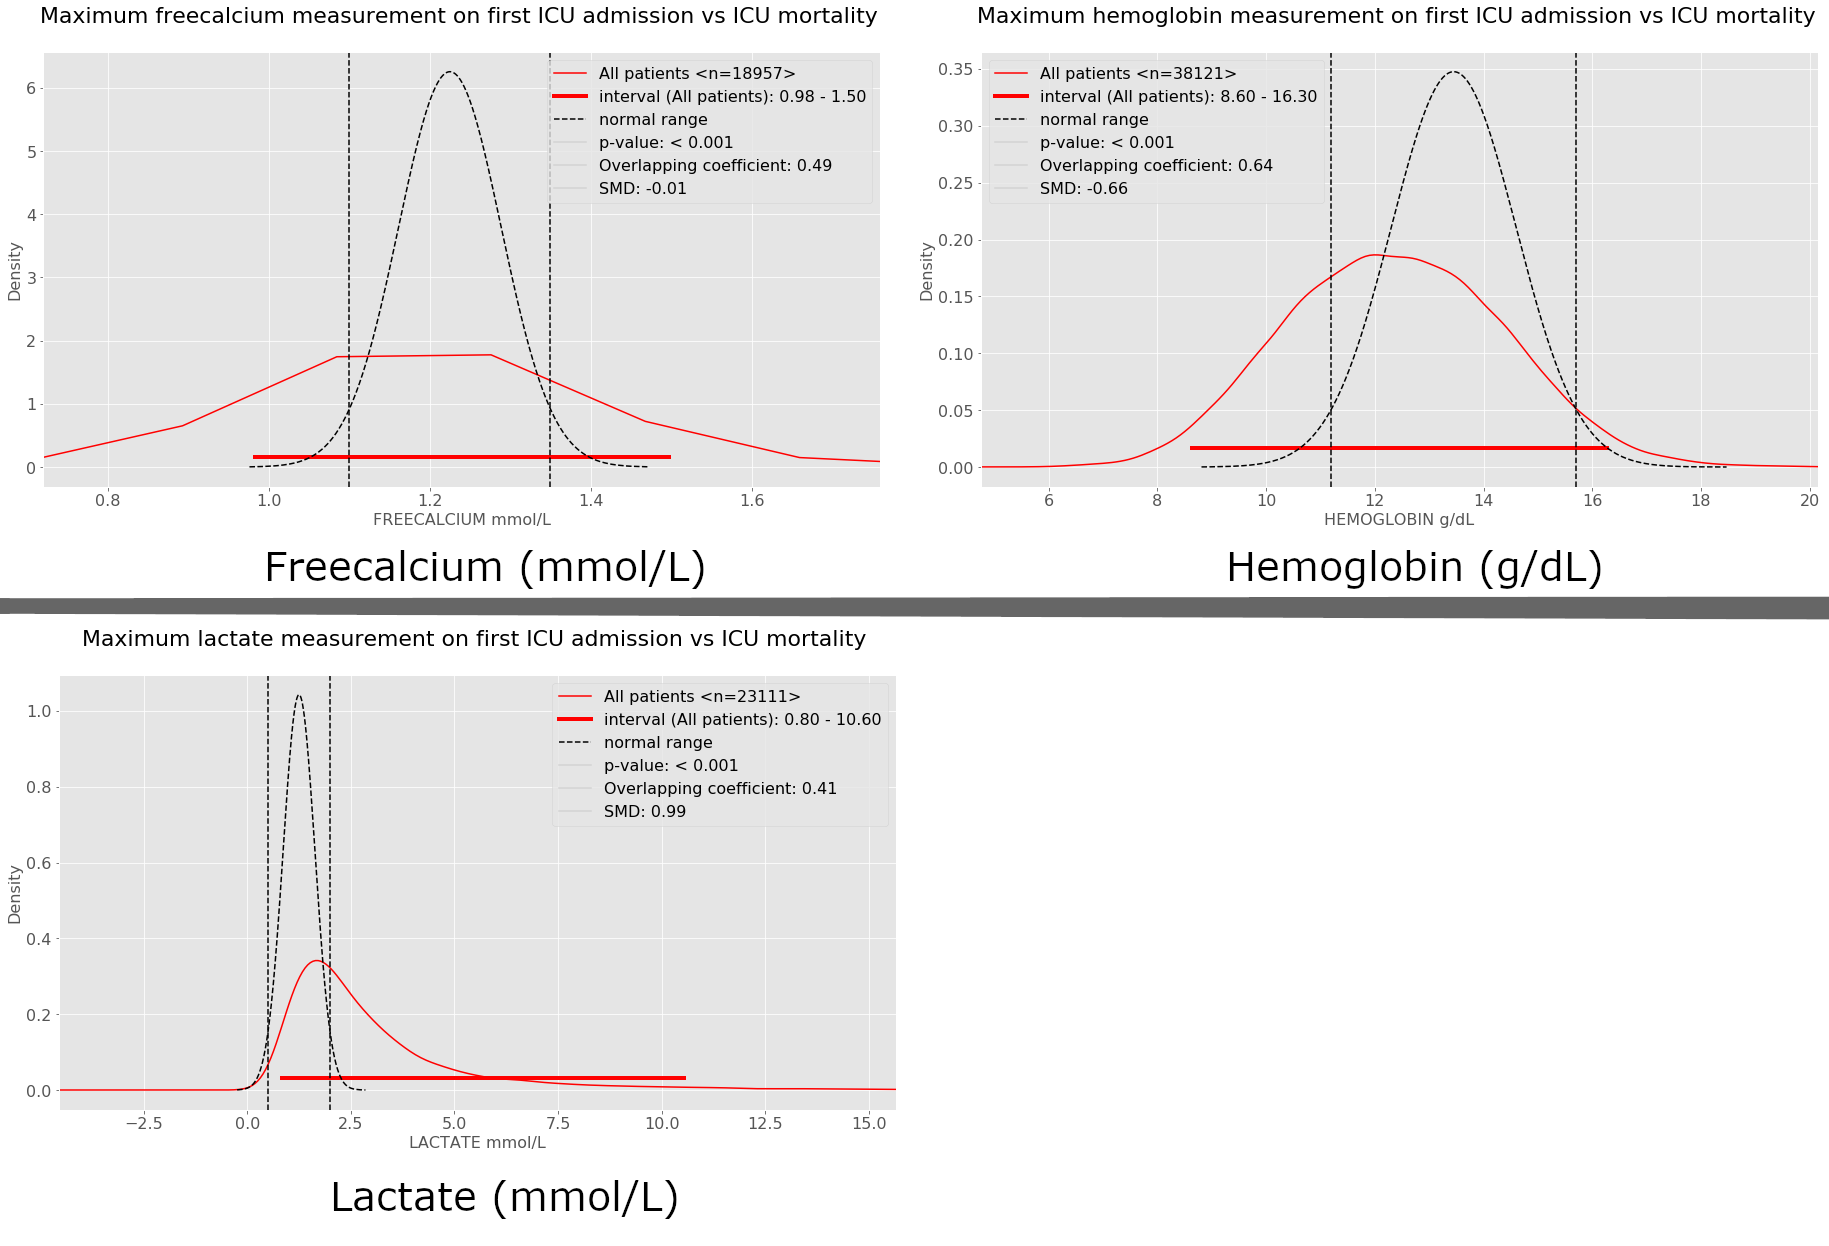
Main Outcomes and Measures: We calculated the overlapping coefficient (OVL) and Cohen’s standardized mean difference (SMD) between distributions, and created kernel density estimate visualizations for the relationship between laboratory values and the probability of death or quartile of ICU length-of-stay (LOS).
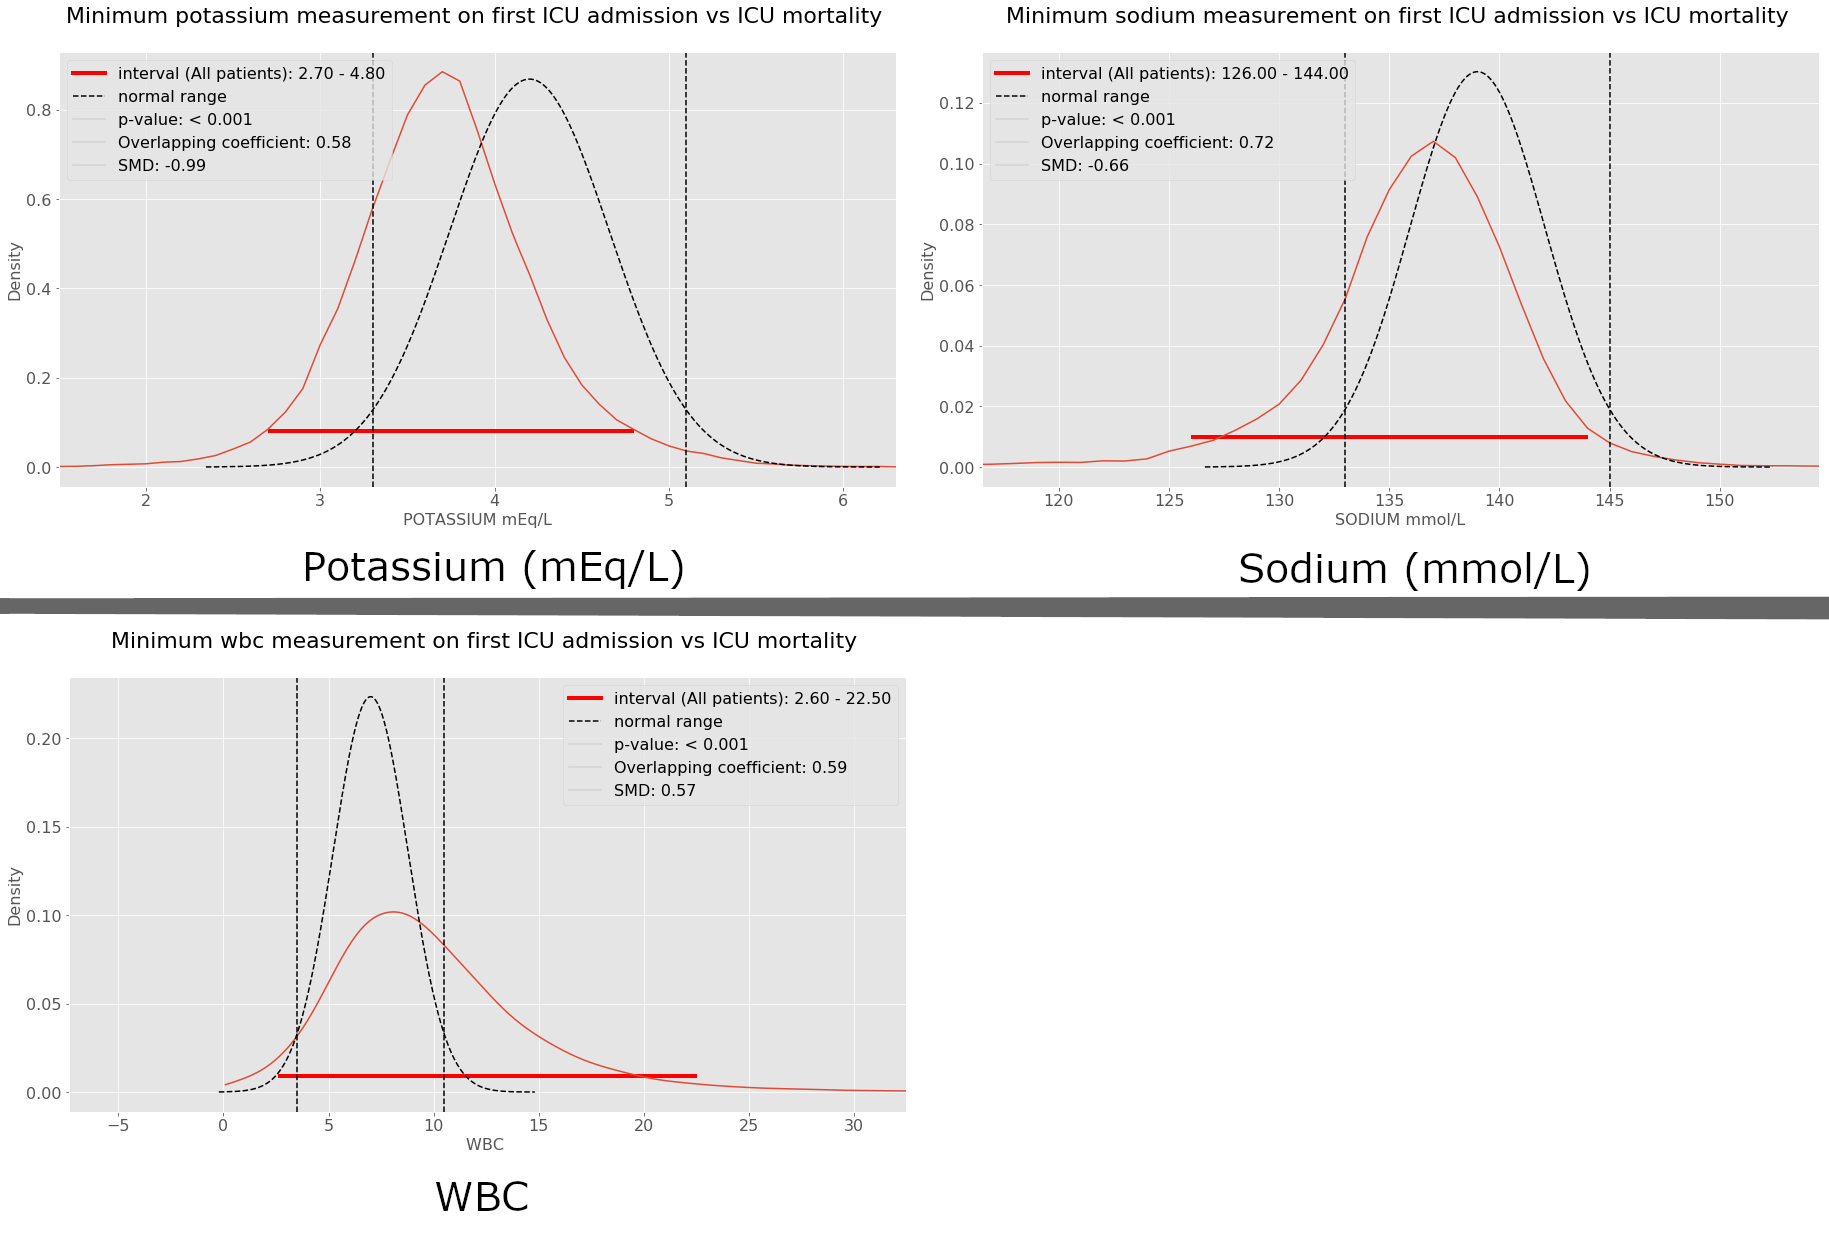
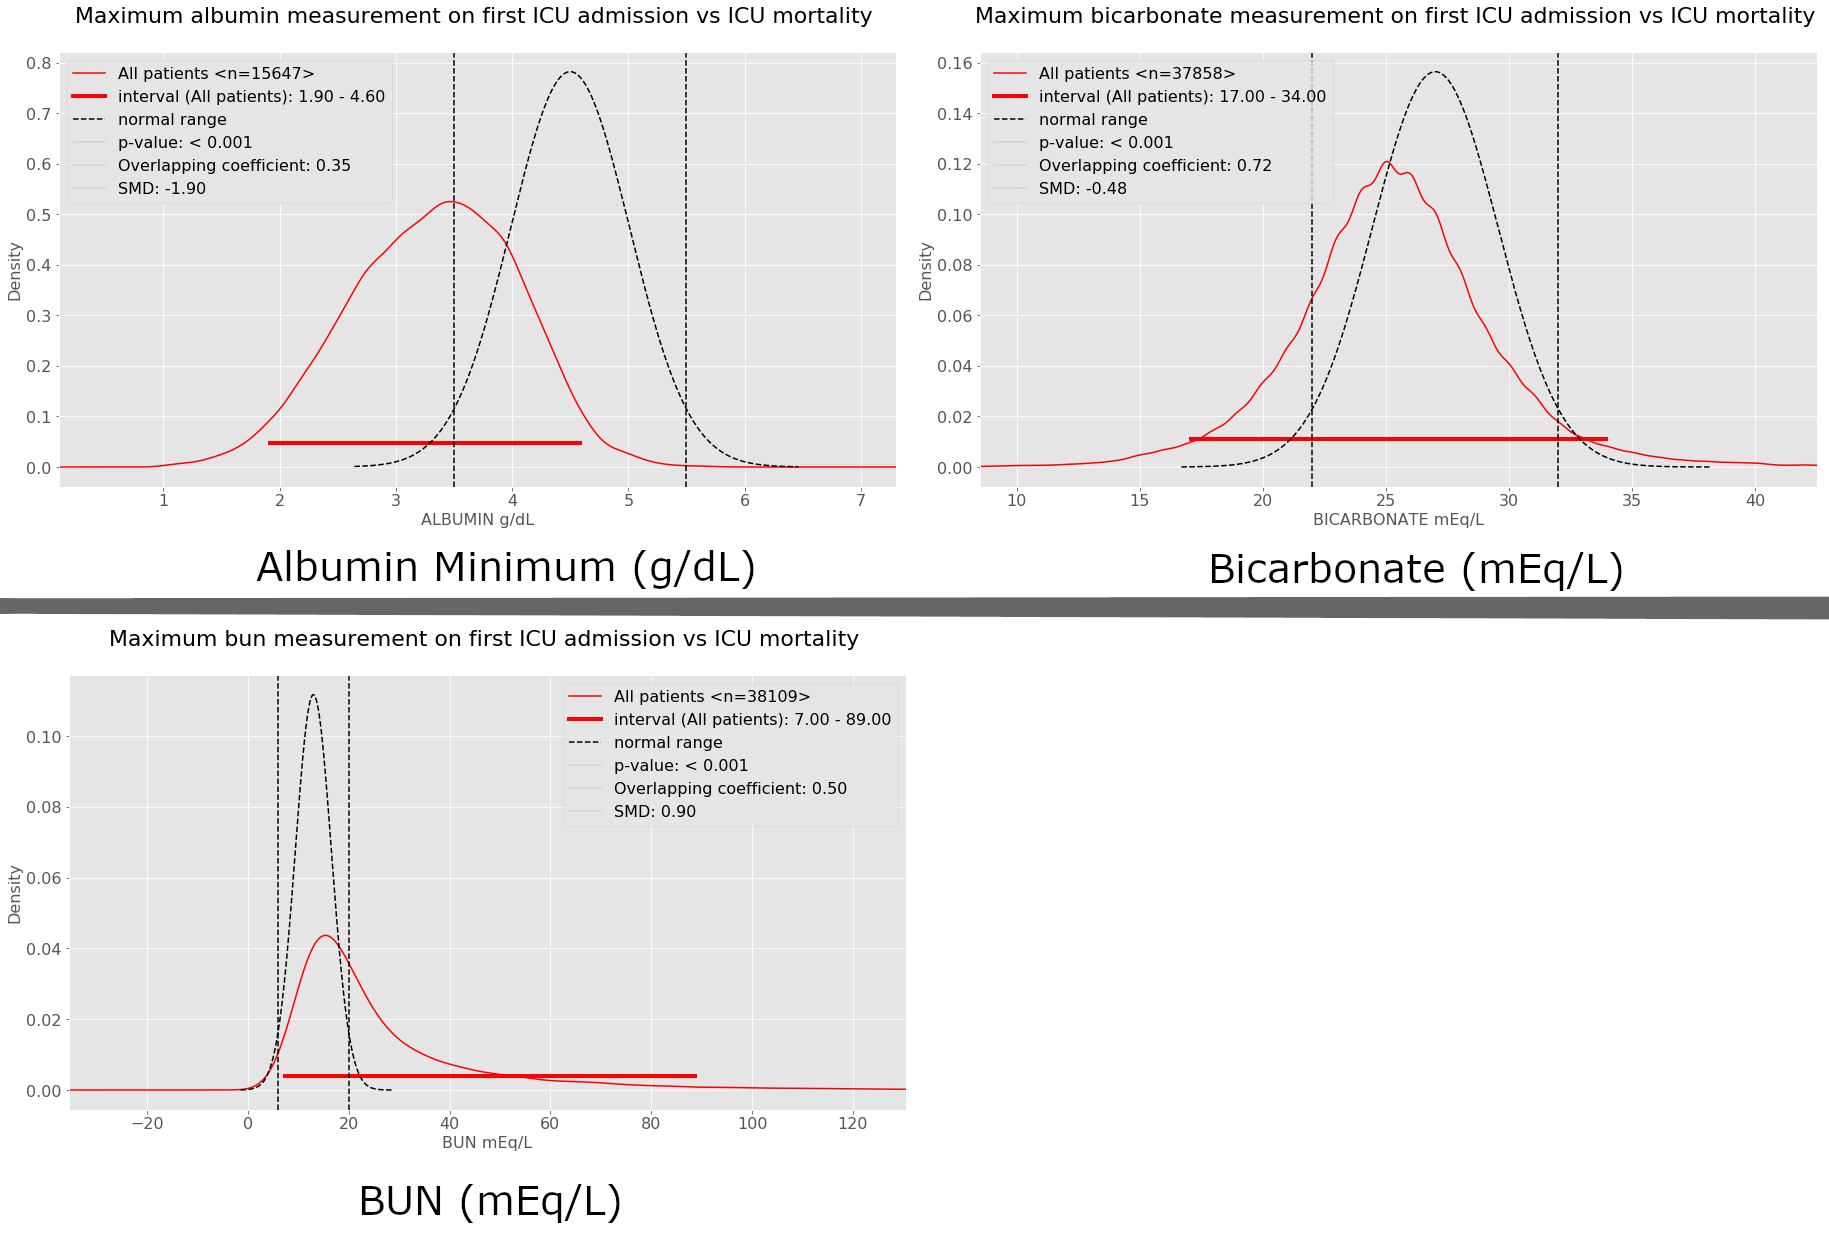
Results: Among 38,603 extracted ICU, 8878 (23/%) have the “best outcome” (ICU survival, shortest quartile LOS) and 3090 (8%) have the worst outcome (ICU non-survival). ICU-based distribution curves differed significantly from the hospital standard range (mean OVL 0.51, 0.32-0.69). All laboratory values for the best outcome group differed significantly from those in the worst outcome group. Both the best and worst outcome group curves revealed little overlap with and marked divergence from the reference range.
Conclusions: The standard reference range of laboratory values obtained from healthy volunteers differs from the analogous range generated from ICU patient data. Laboratory data interpretation may benefit from greater consideration of clinically contextual and outcome-related factors.
Missing Values
For each ICU stay, we extracted worst first day results for a panel of laboratory tests routinely ordered for ICU patients. Missing data in laboratory tests was handled as follows: if a patient had values for all the tests except albumin, the patient was included in all analyses except that for albumin. The proportion of patients missing each lab test are shown in the following figure. Albumin was ordered for only 41% of patients; free (ionized) calcium for 50%; serum lactate for 60%; with the remainder of the study laboratory tests ordered for more than 80% of patients.
- Summary of the percentages of missing values for various lab test results.
Additional Results
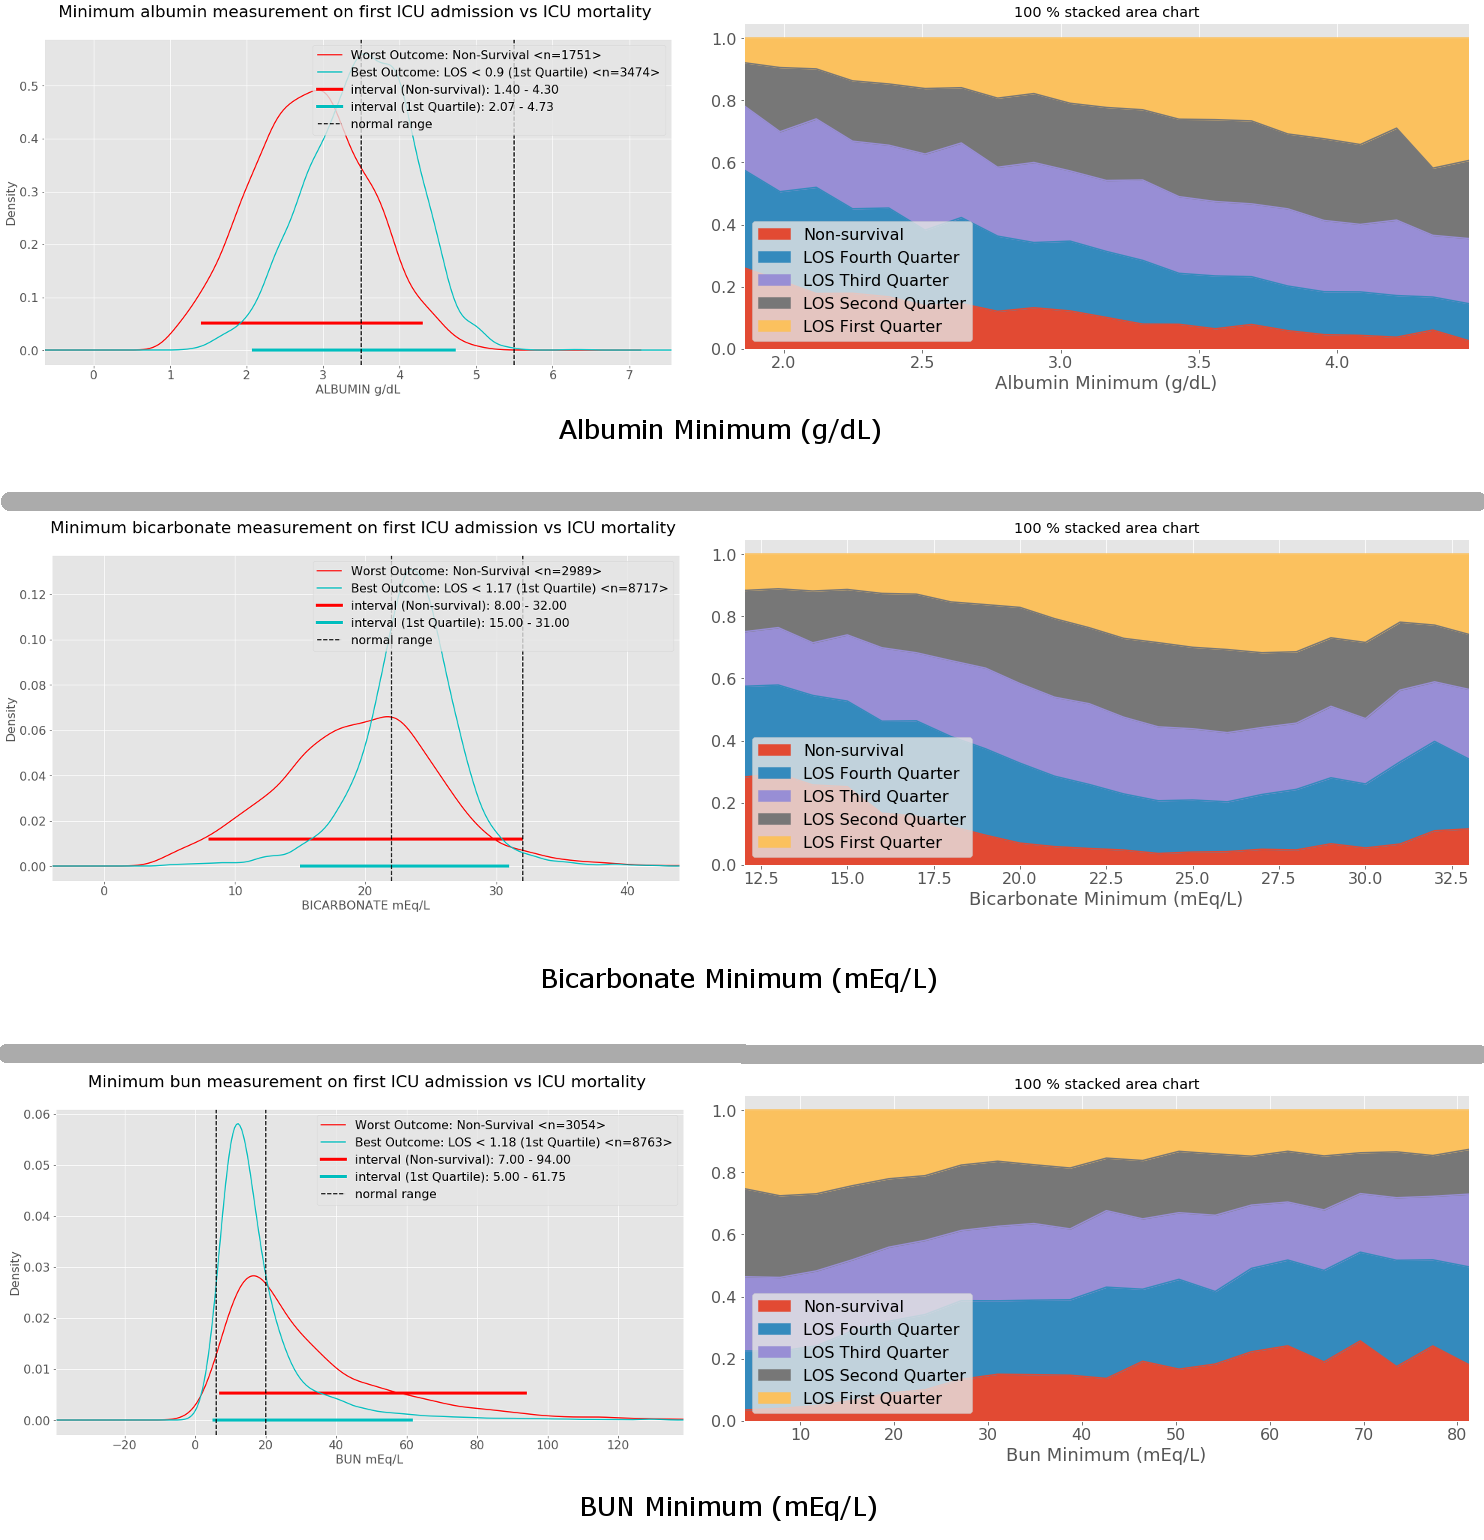
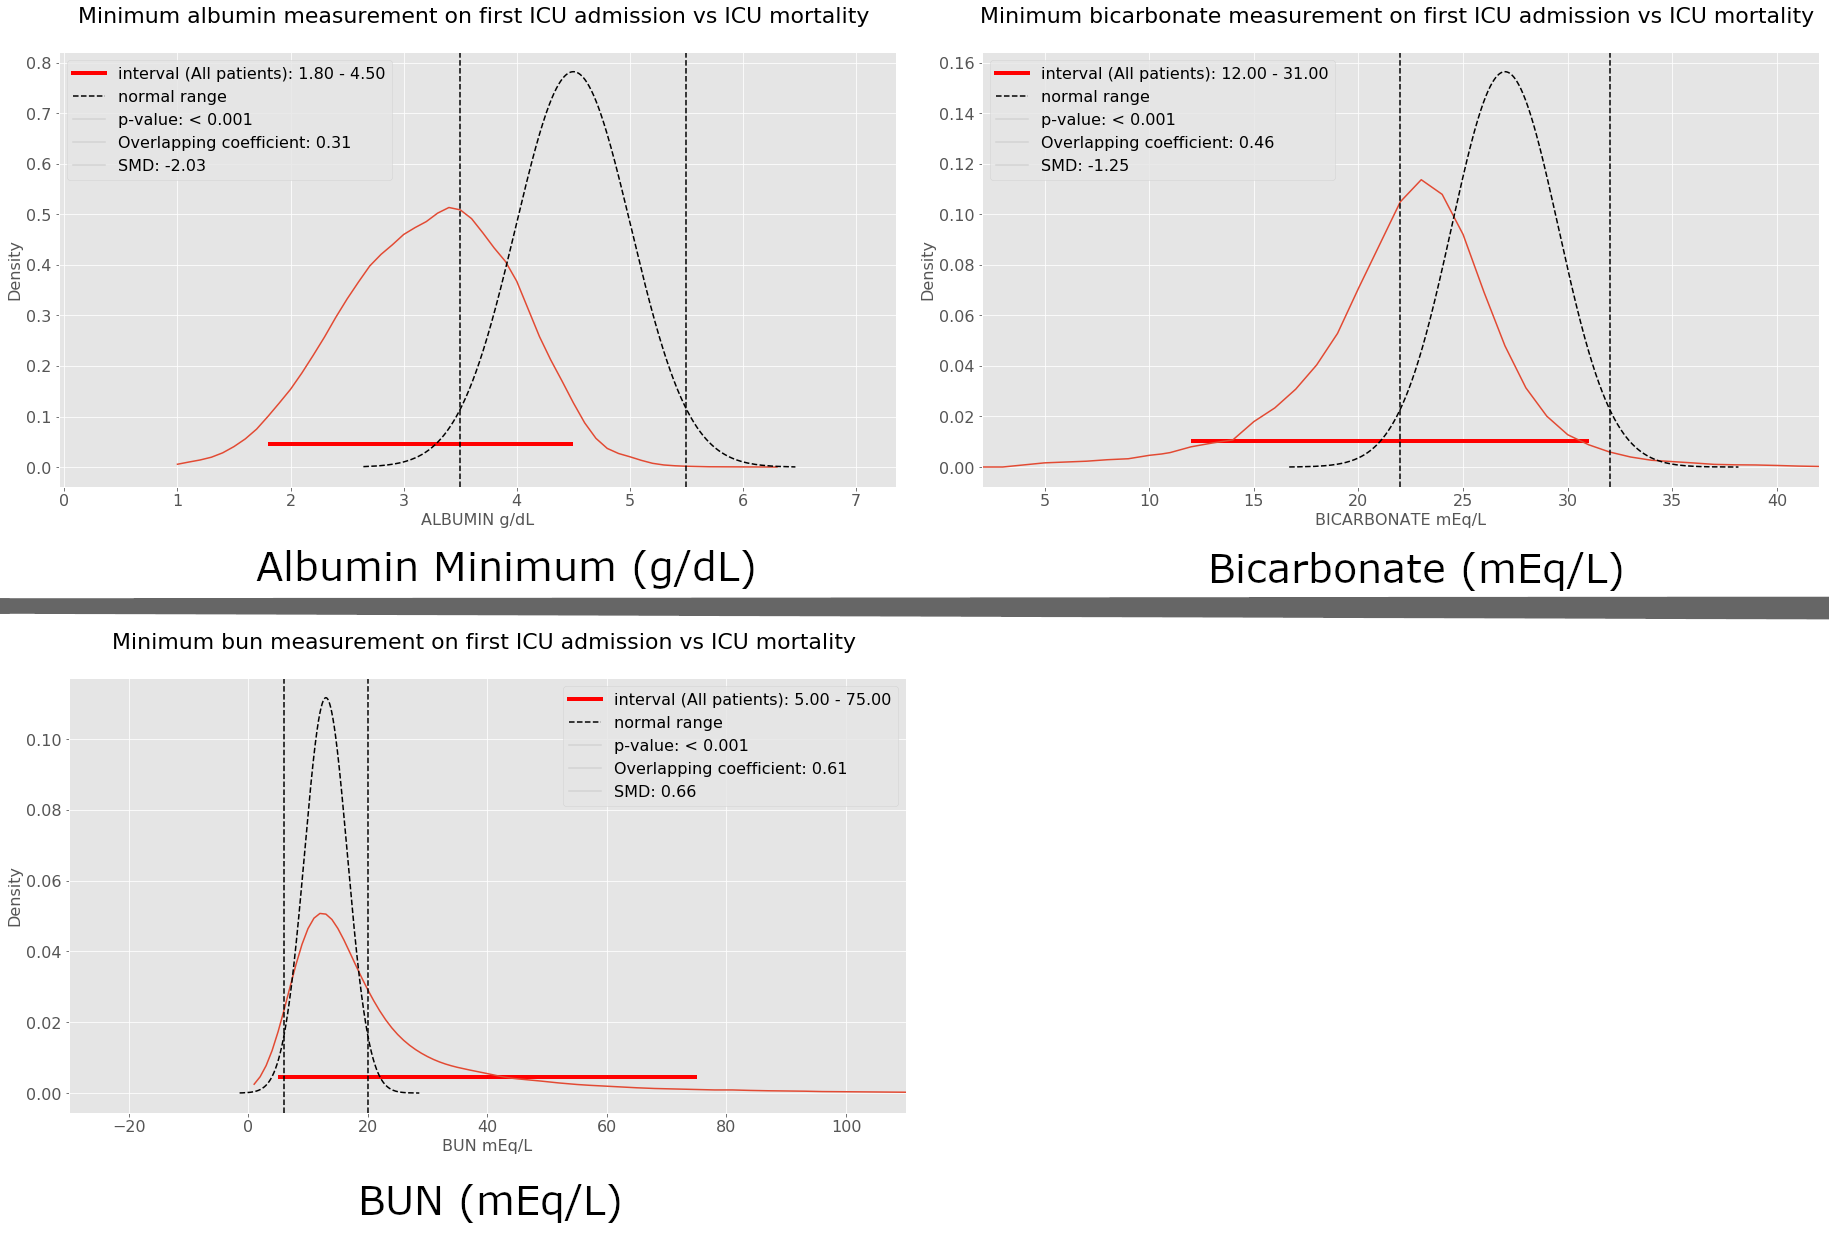
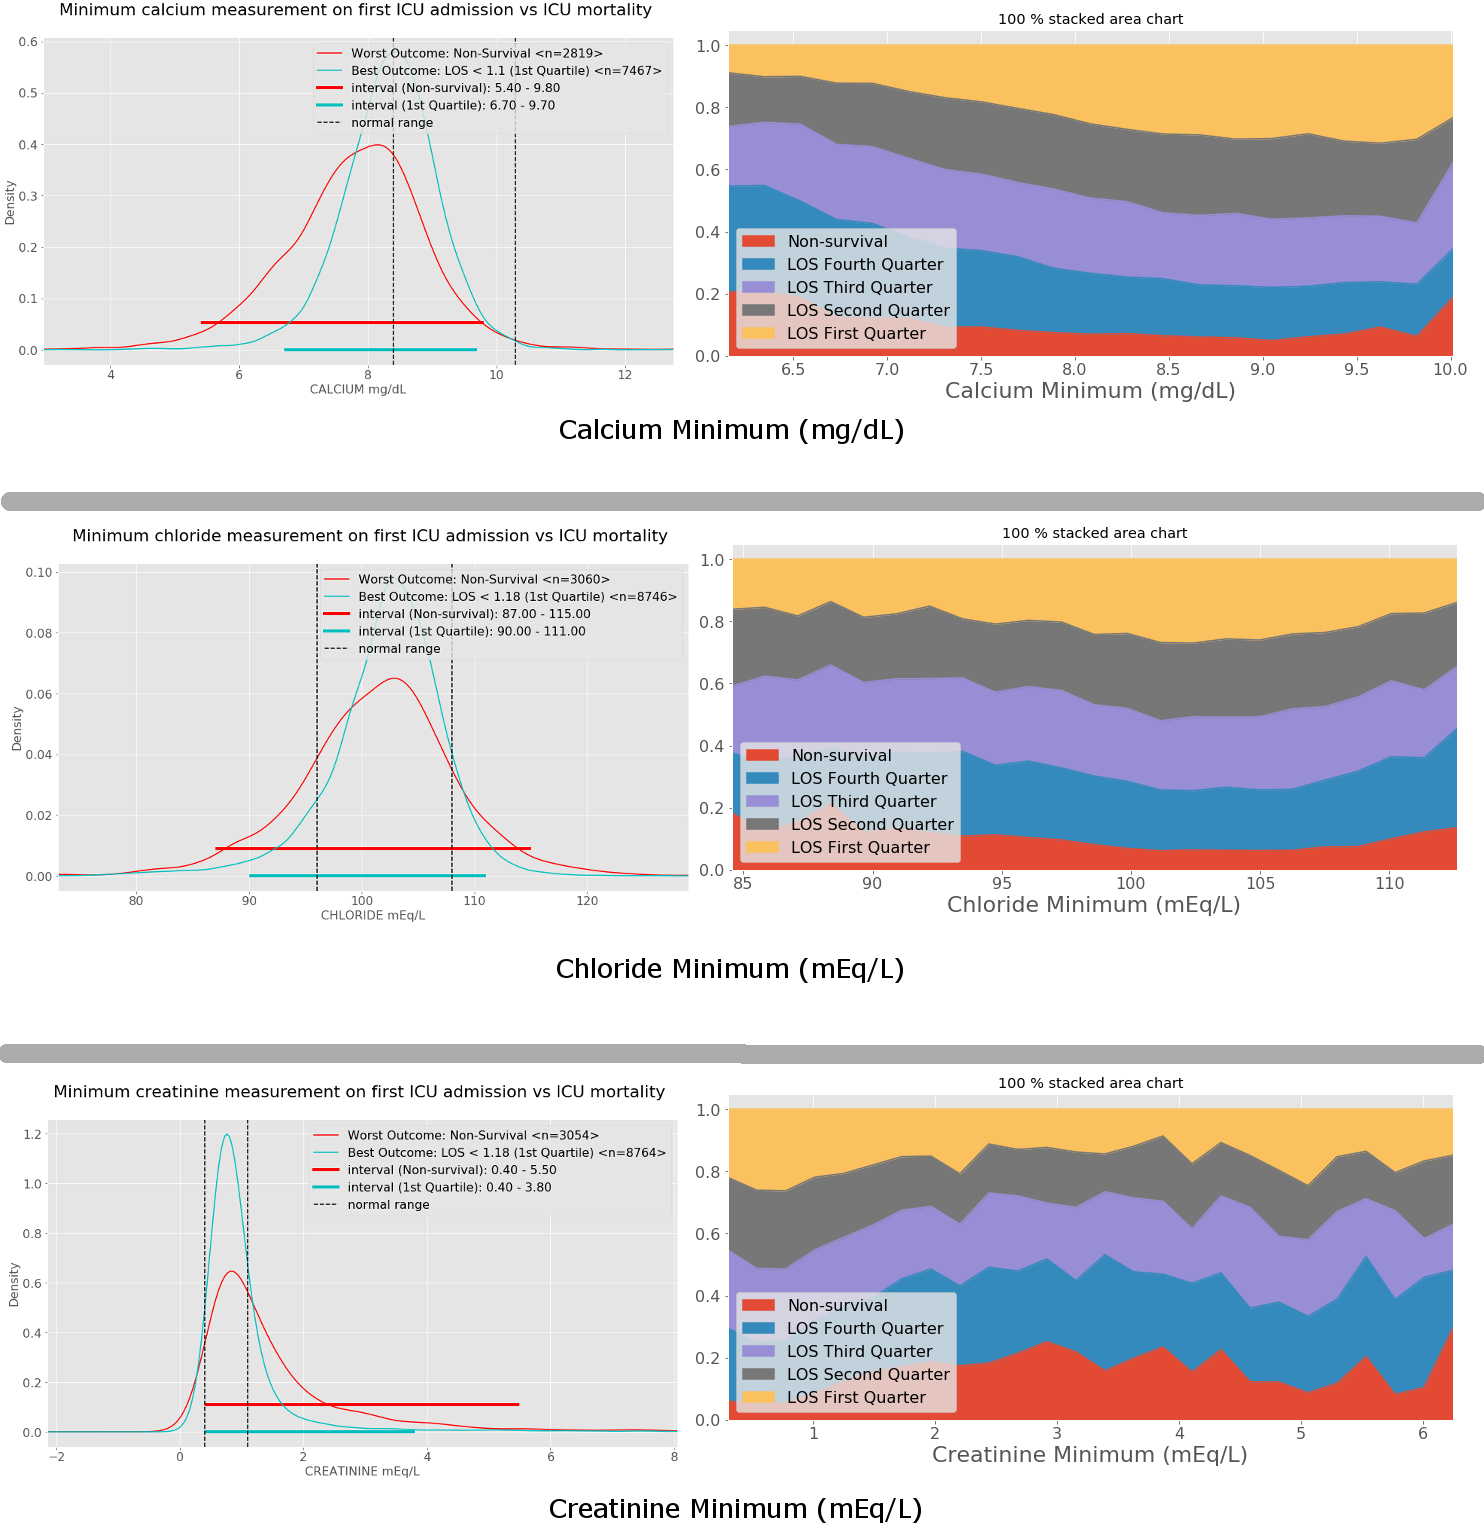
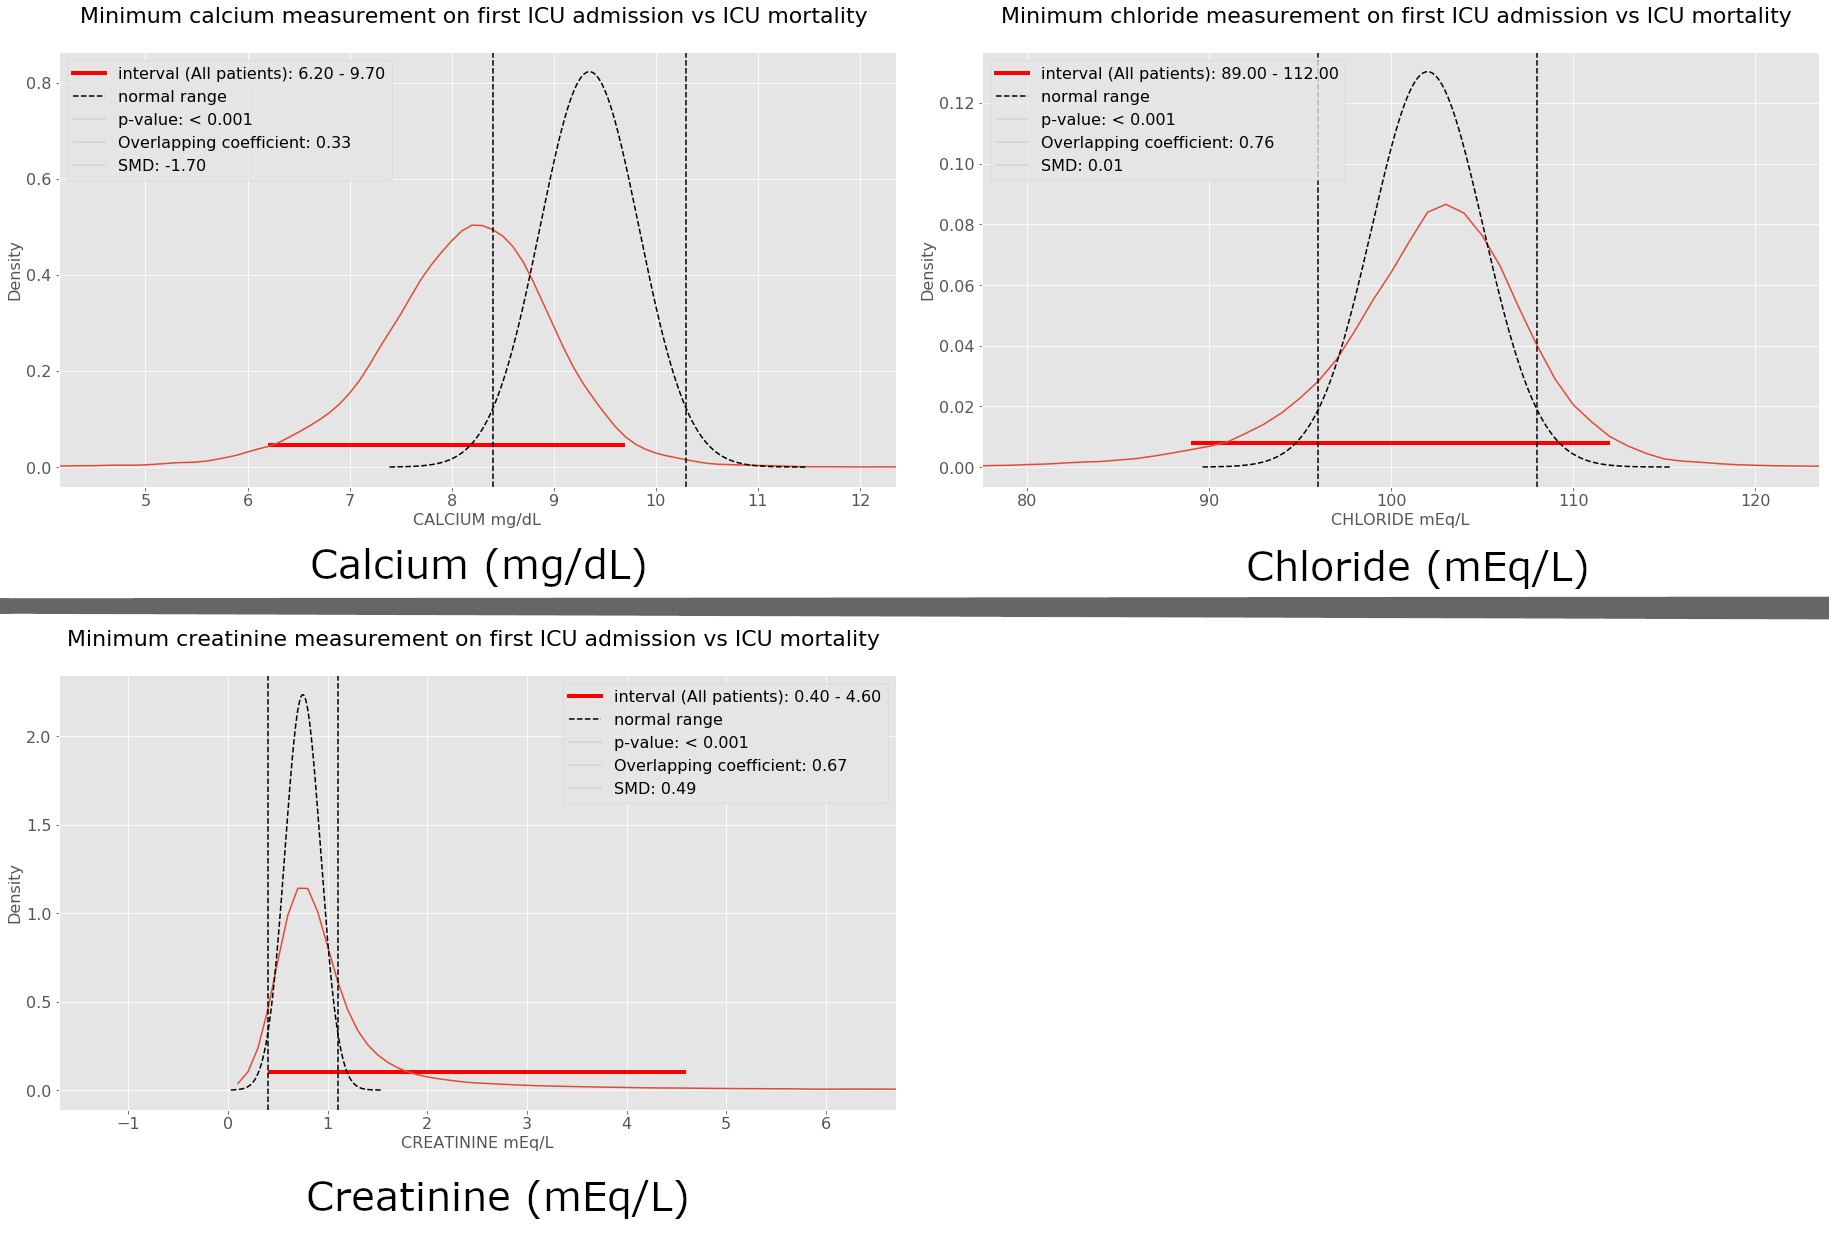
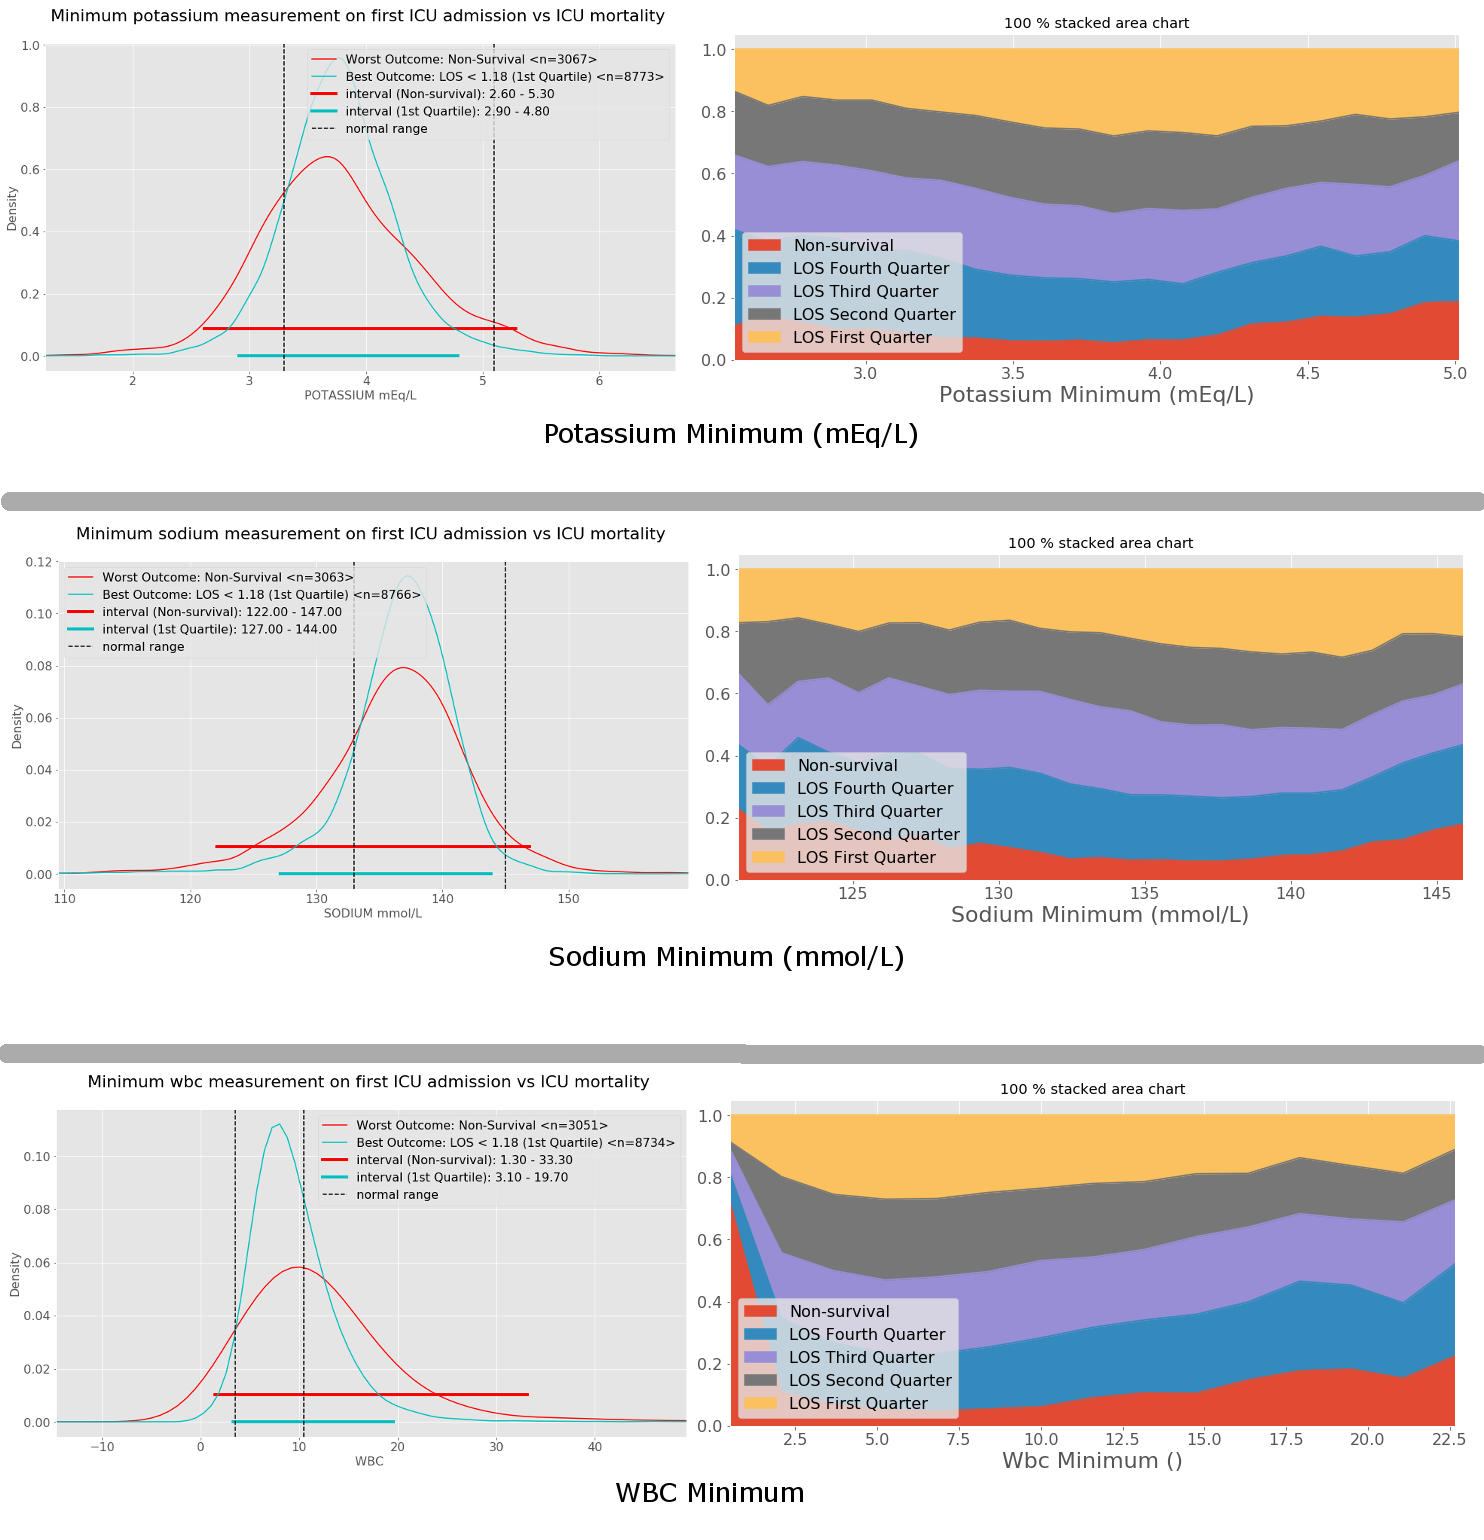
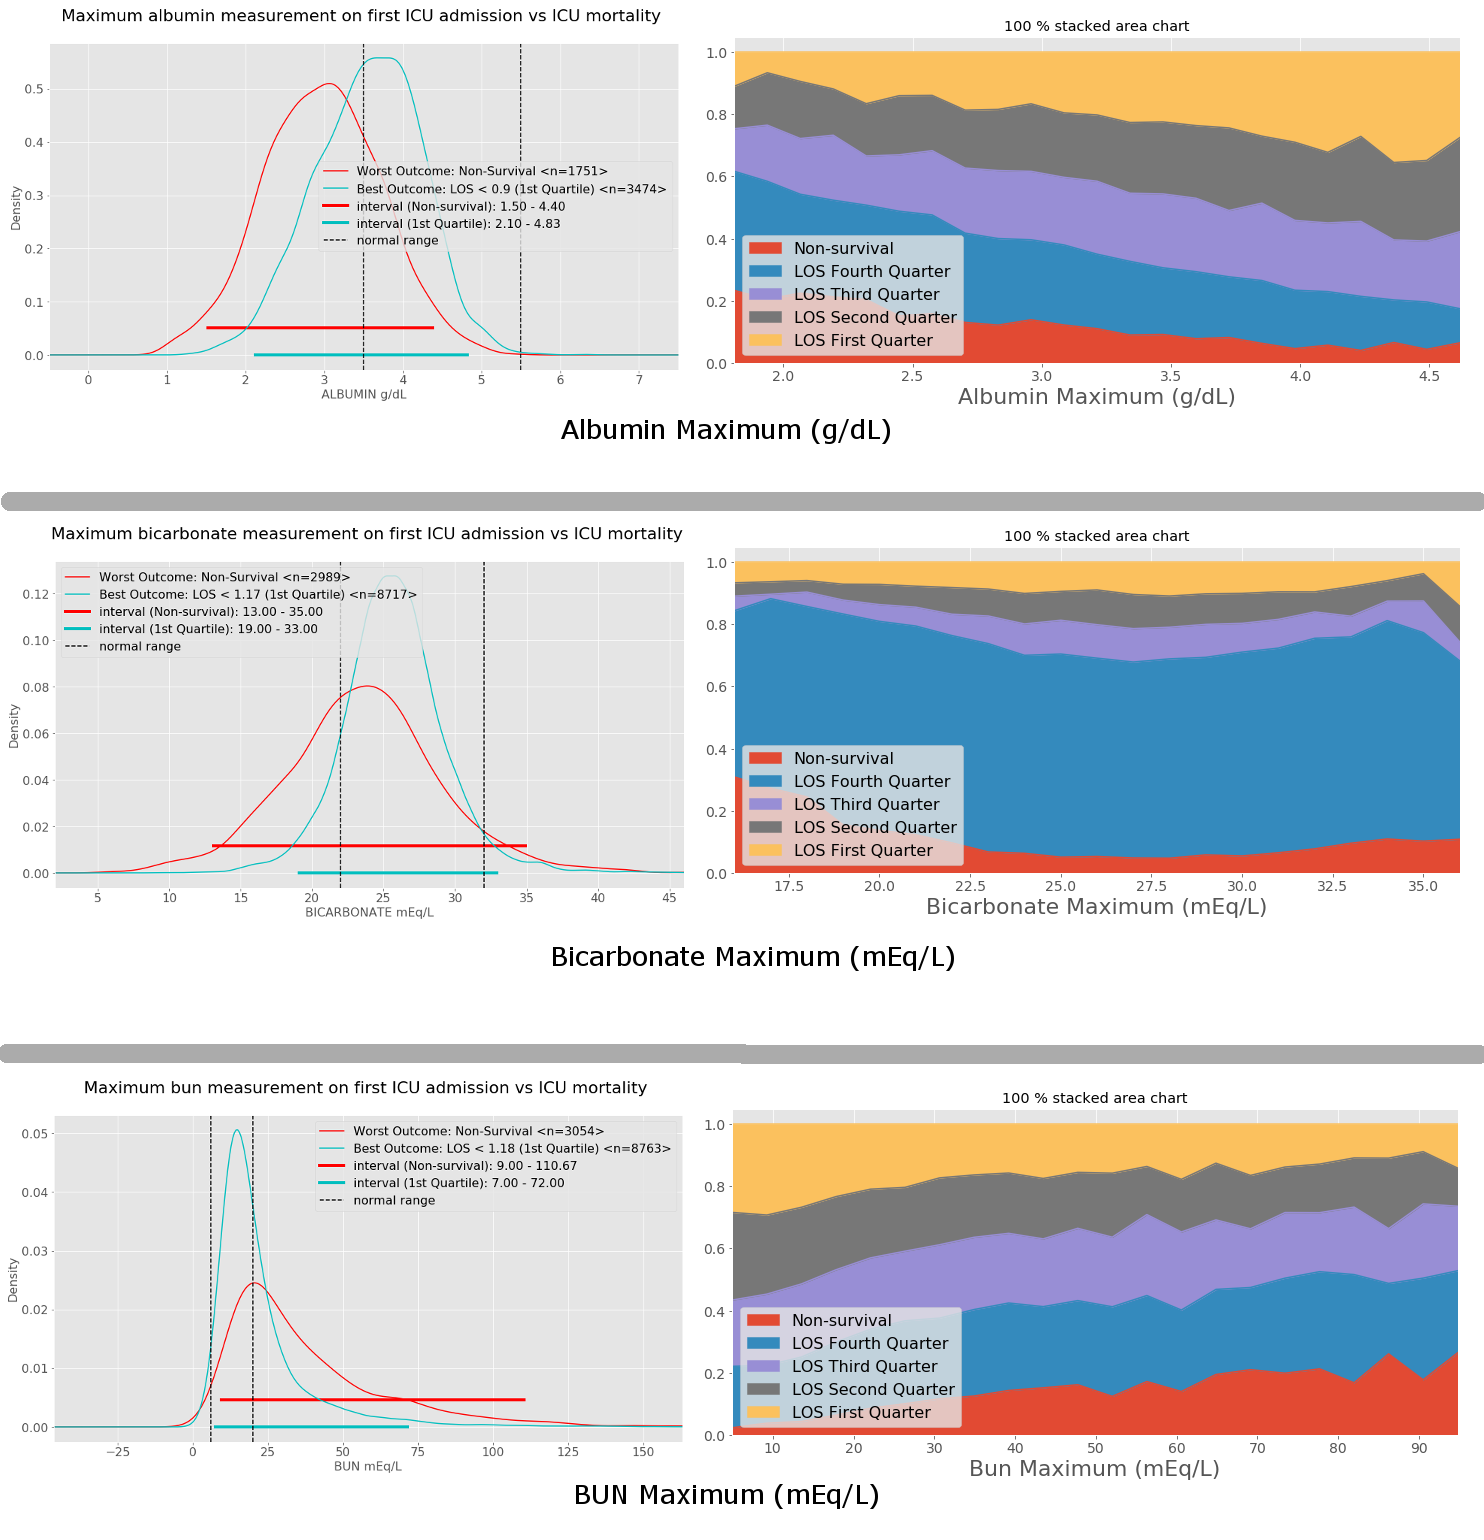
For each stay, we extracted worst first day results for a panel of laboratory tests routinely ordered for ICU patients. We focused on clinically relevant laboratory values: minimum for albumin, ionized calcium, hemoglobin, and platelets; maximum for creatinine and lactate; and both minimum and maximum for bicarbonate, calcium, magnesium, phosphate, potassium, sodium, and white blood cell count.
Minimal values
- Albumin, Bicarbonate and BUN minimum
- Calcium, Chloride and Creatinine minimum
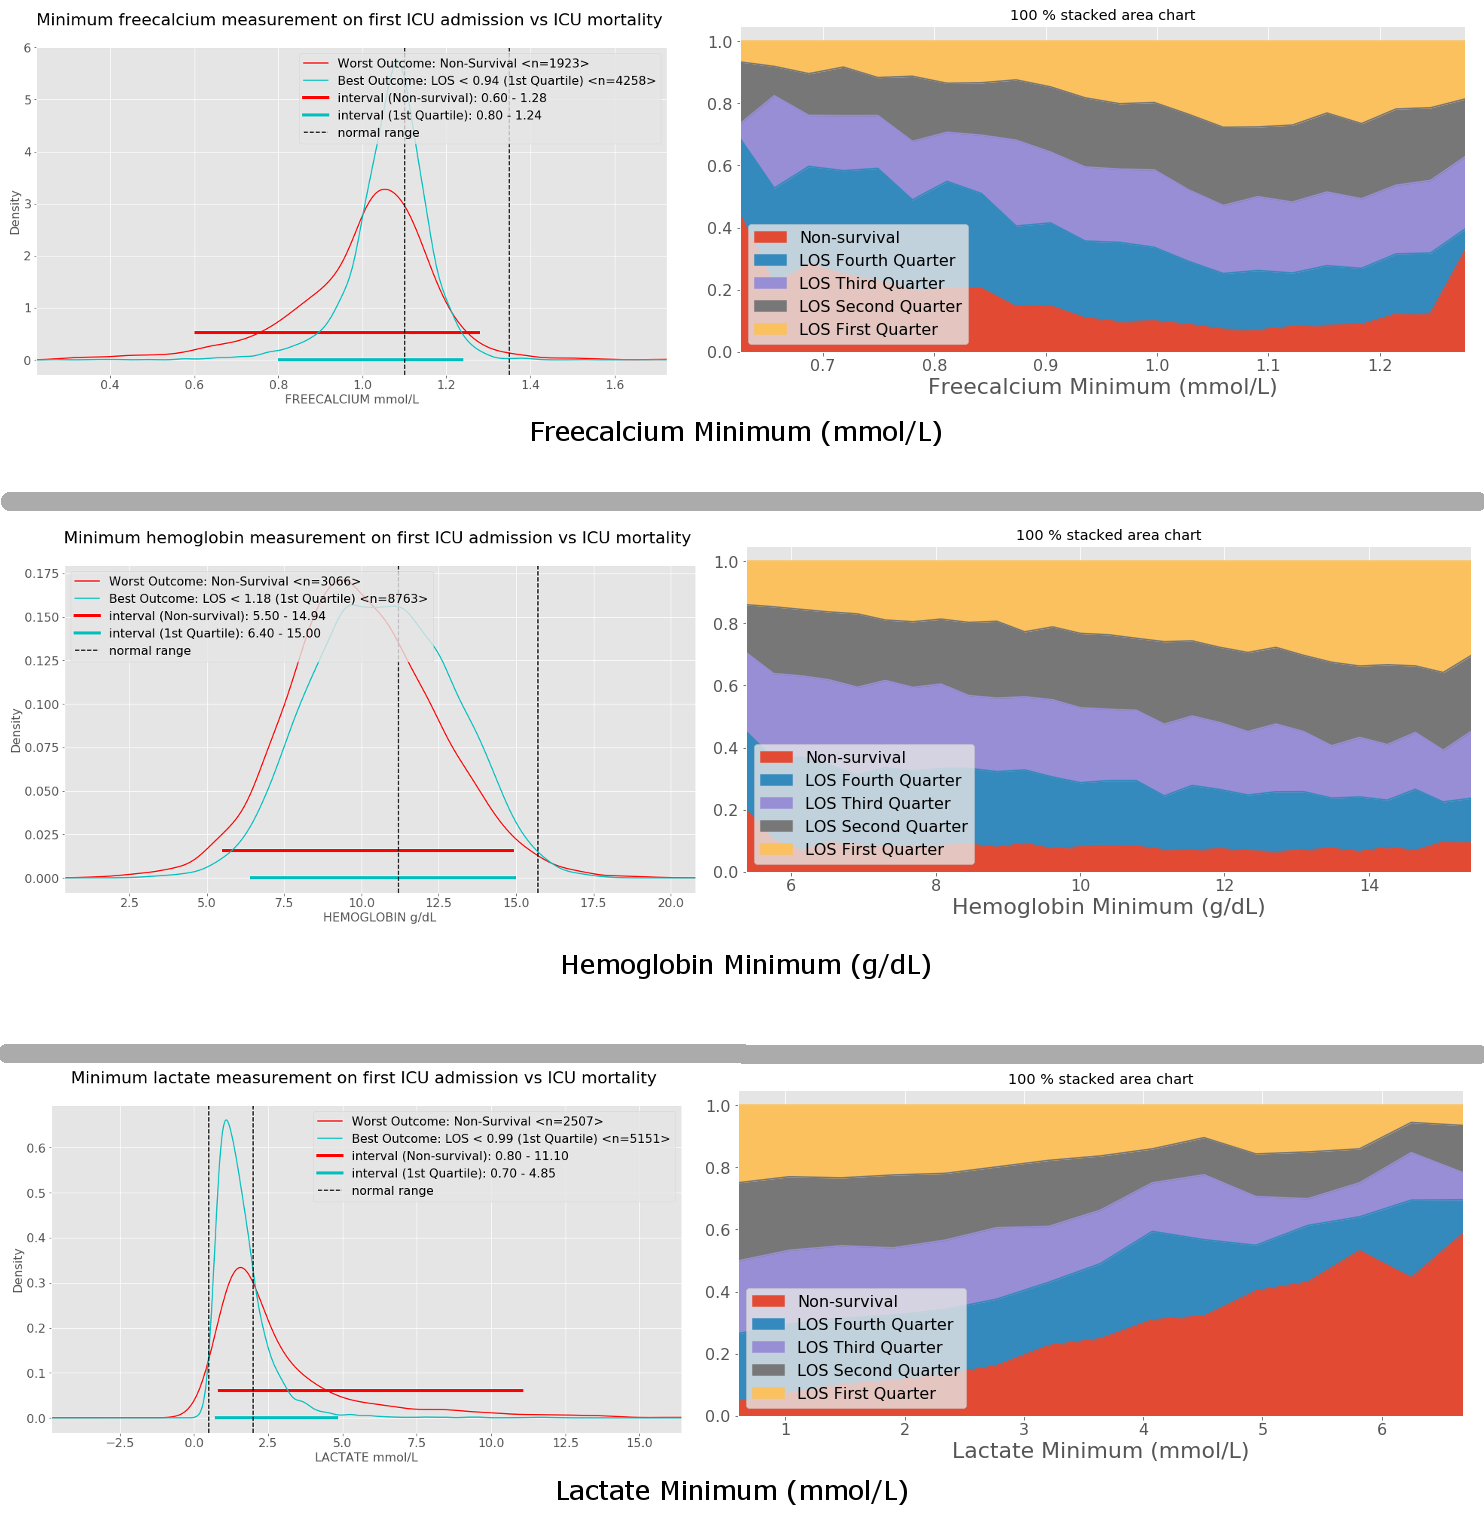
- Freecalcium, hemoglobin and lactate minimum
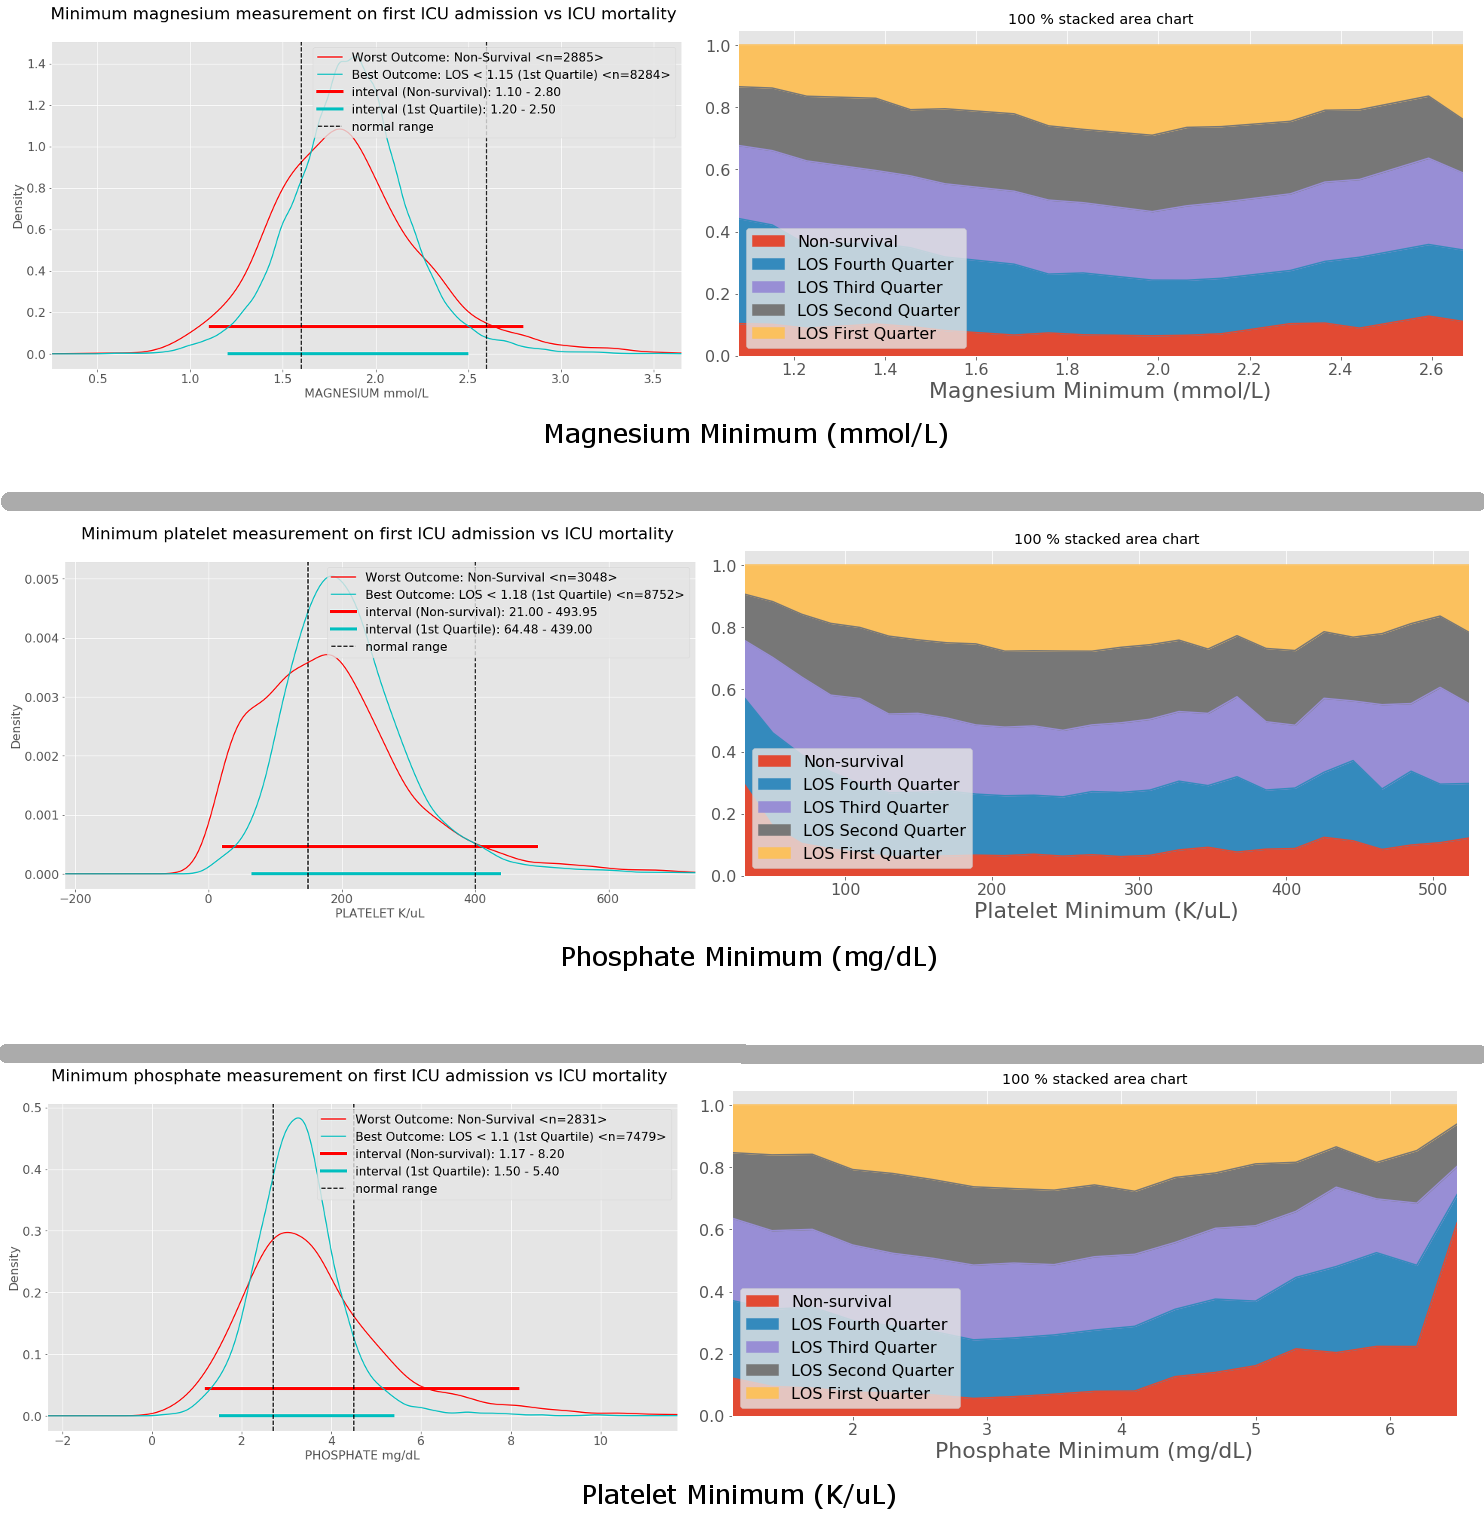
- Magnesium, Phosphate and Platelet minimum
- Potassium, Sodium and WBC minimum
Maximal values
- Albumin, Bicarbonate and BUN maximum
- Calcium, Chloride and Creatinine maximum
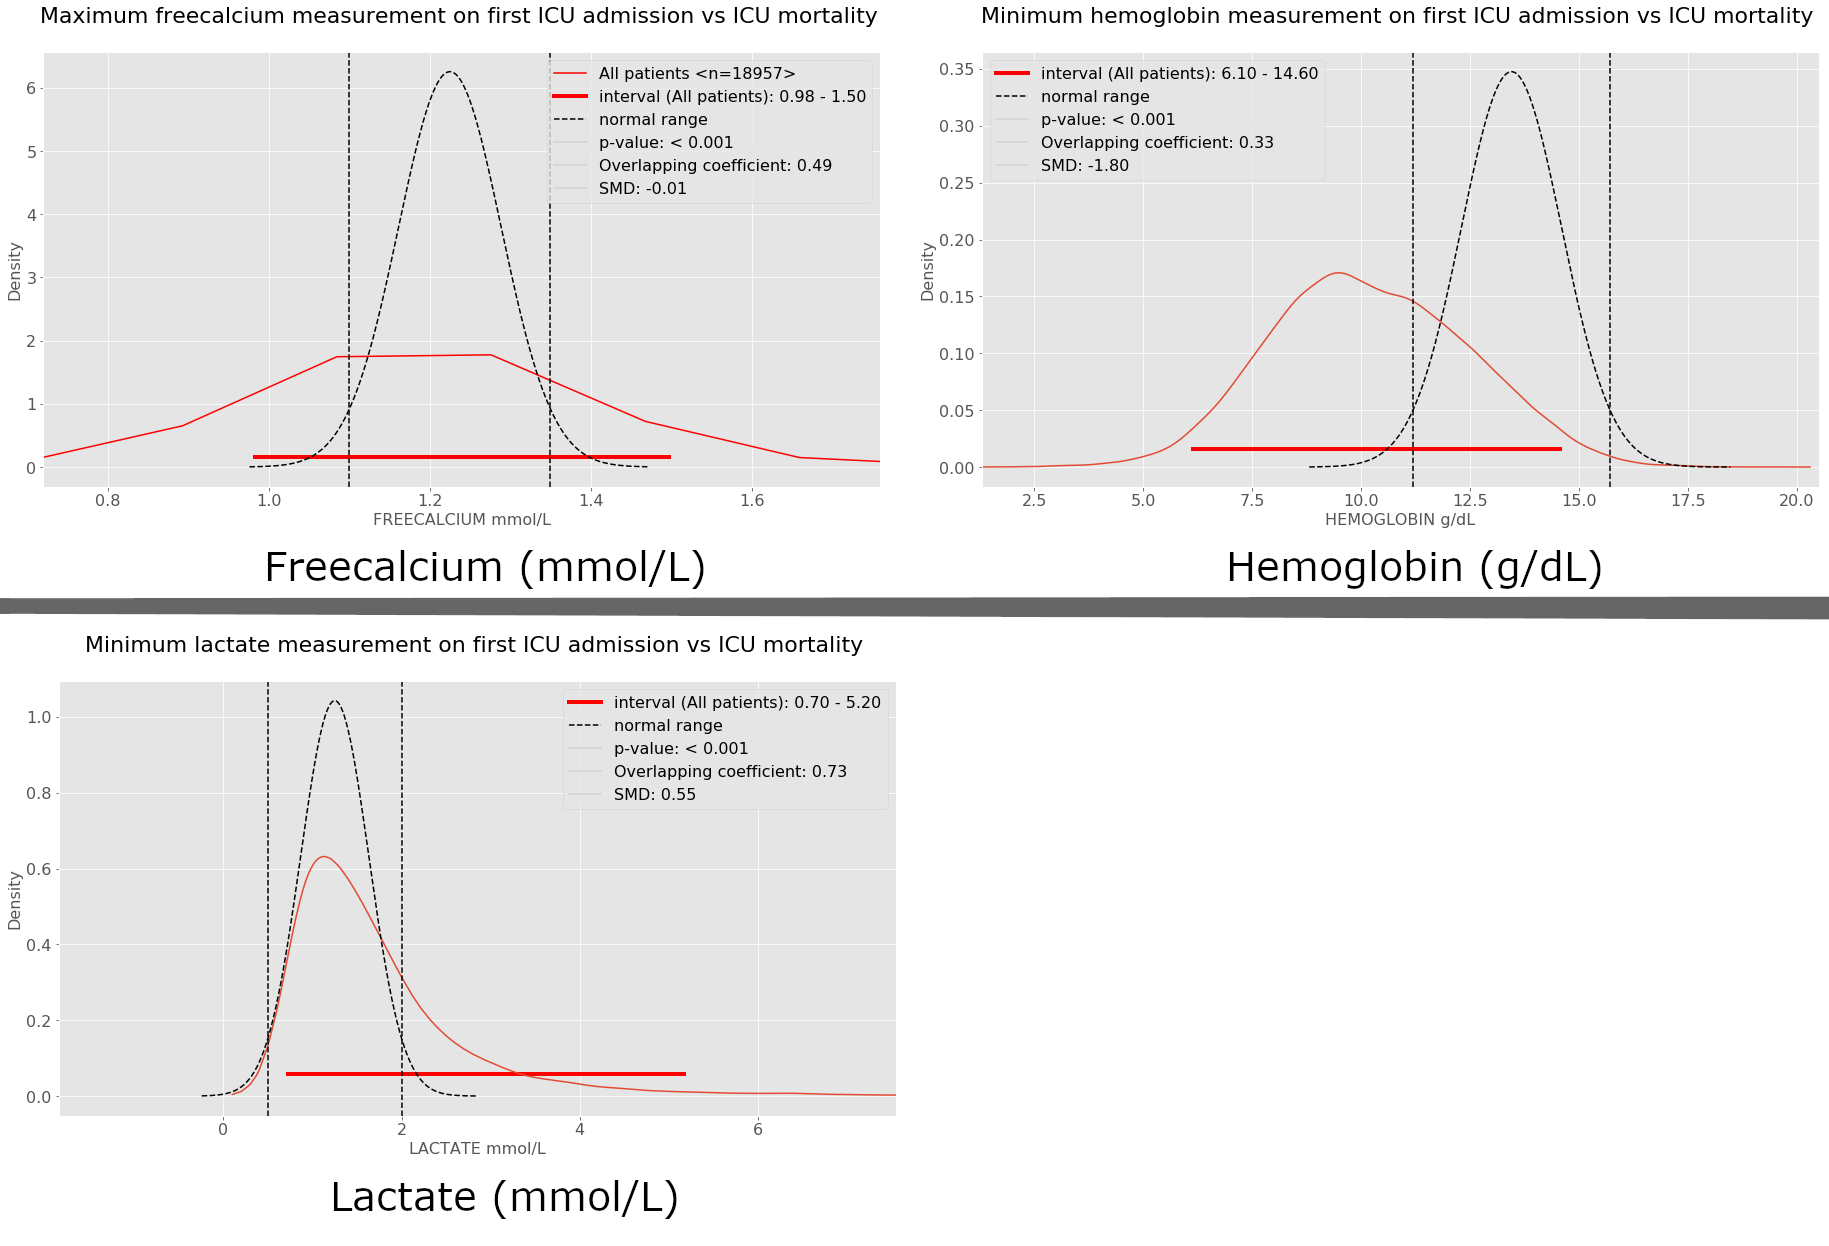
- Freecalcium, hemoglobin and lactate maximum
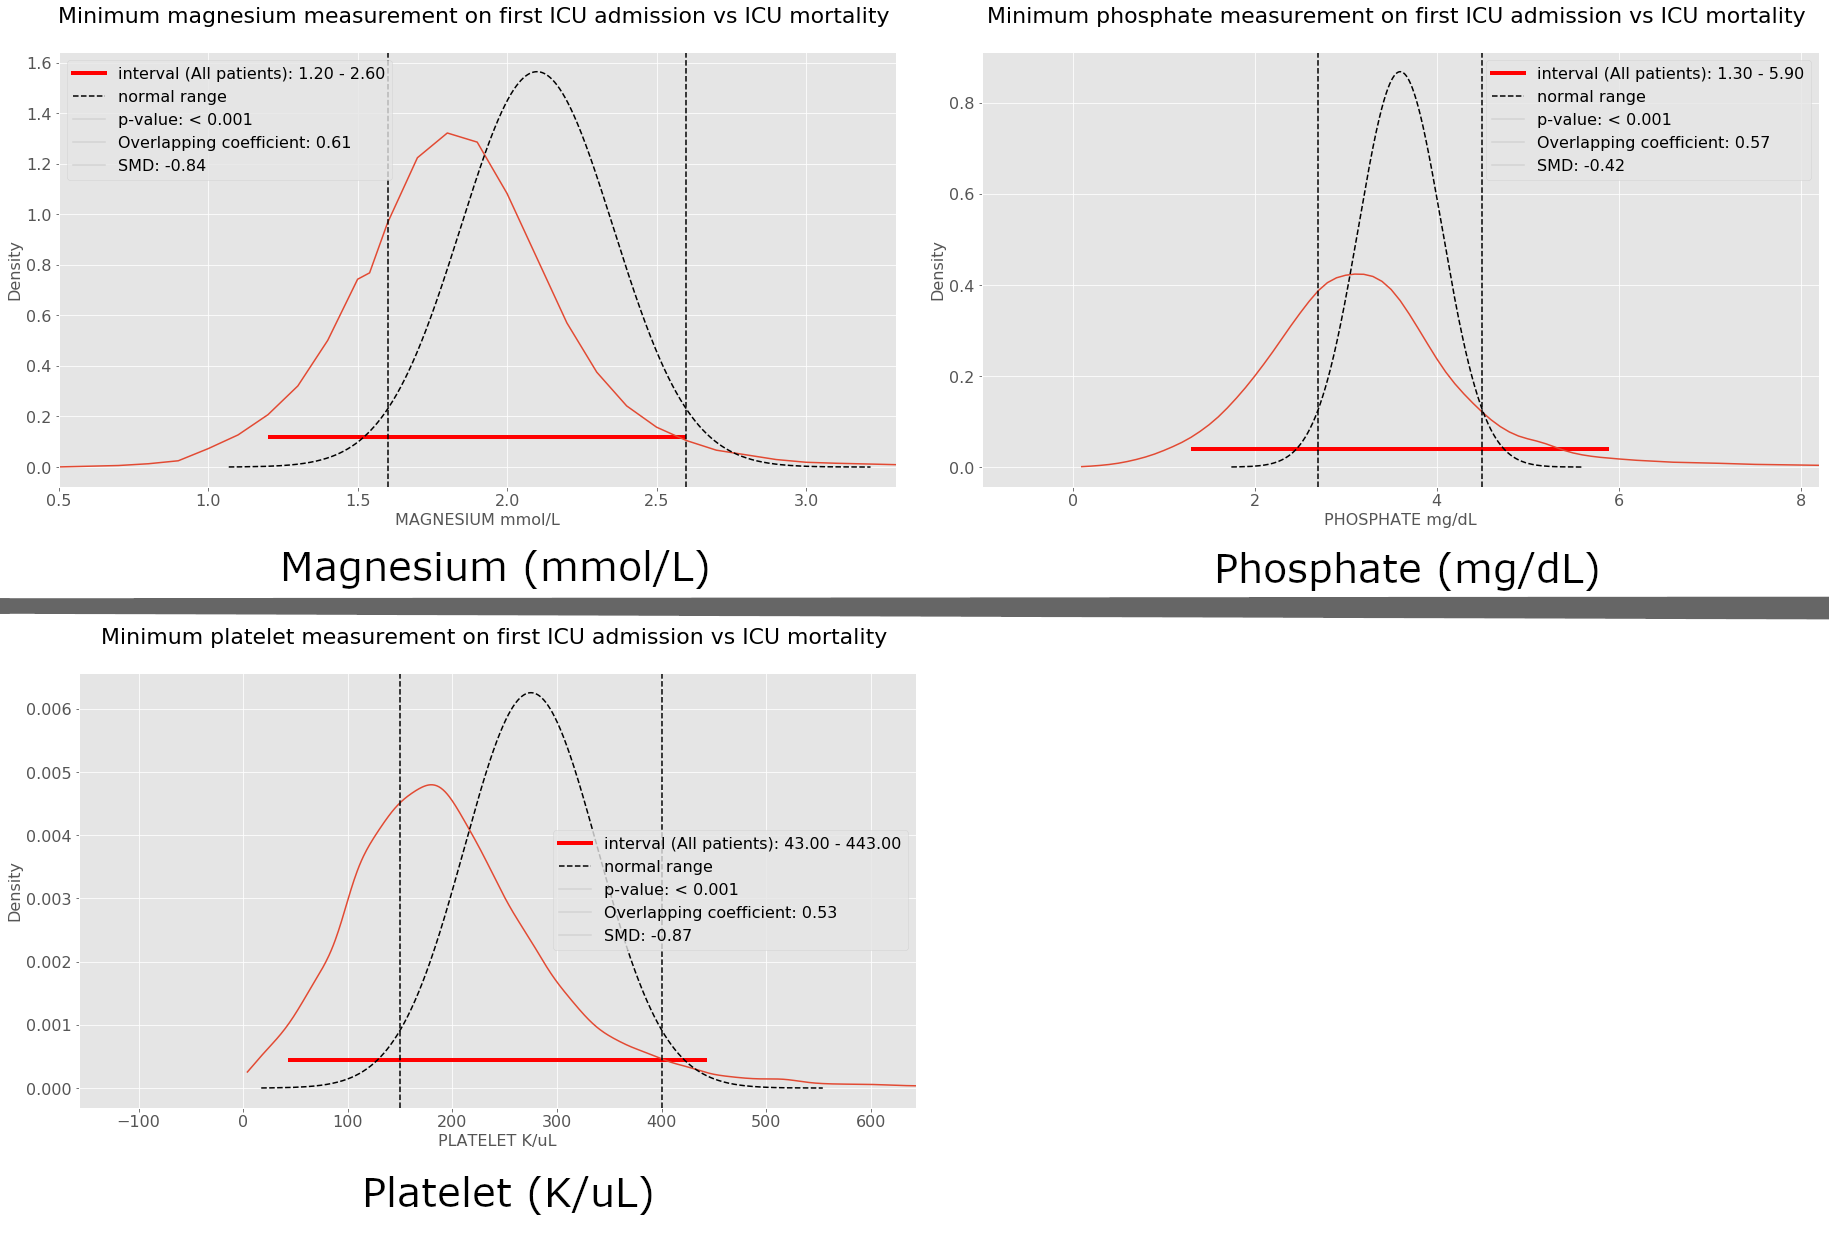
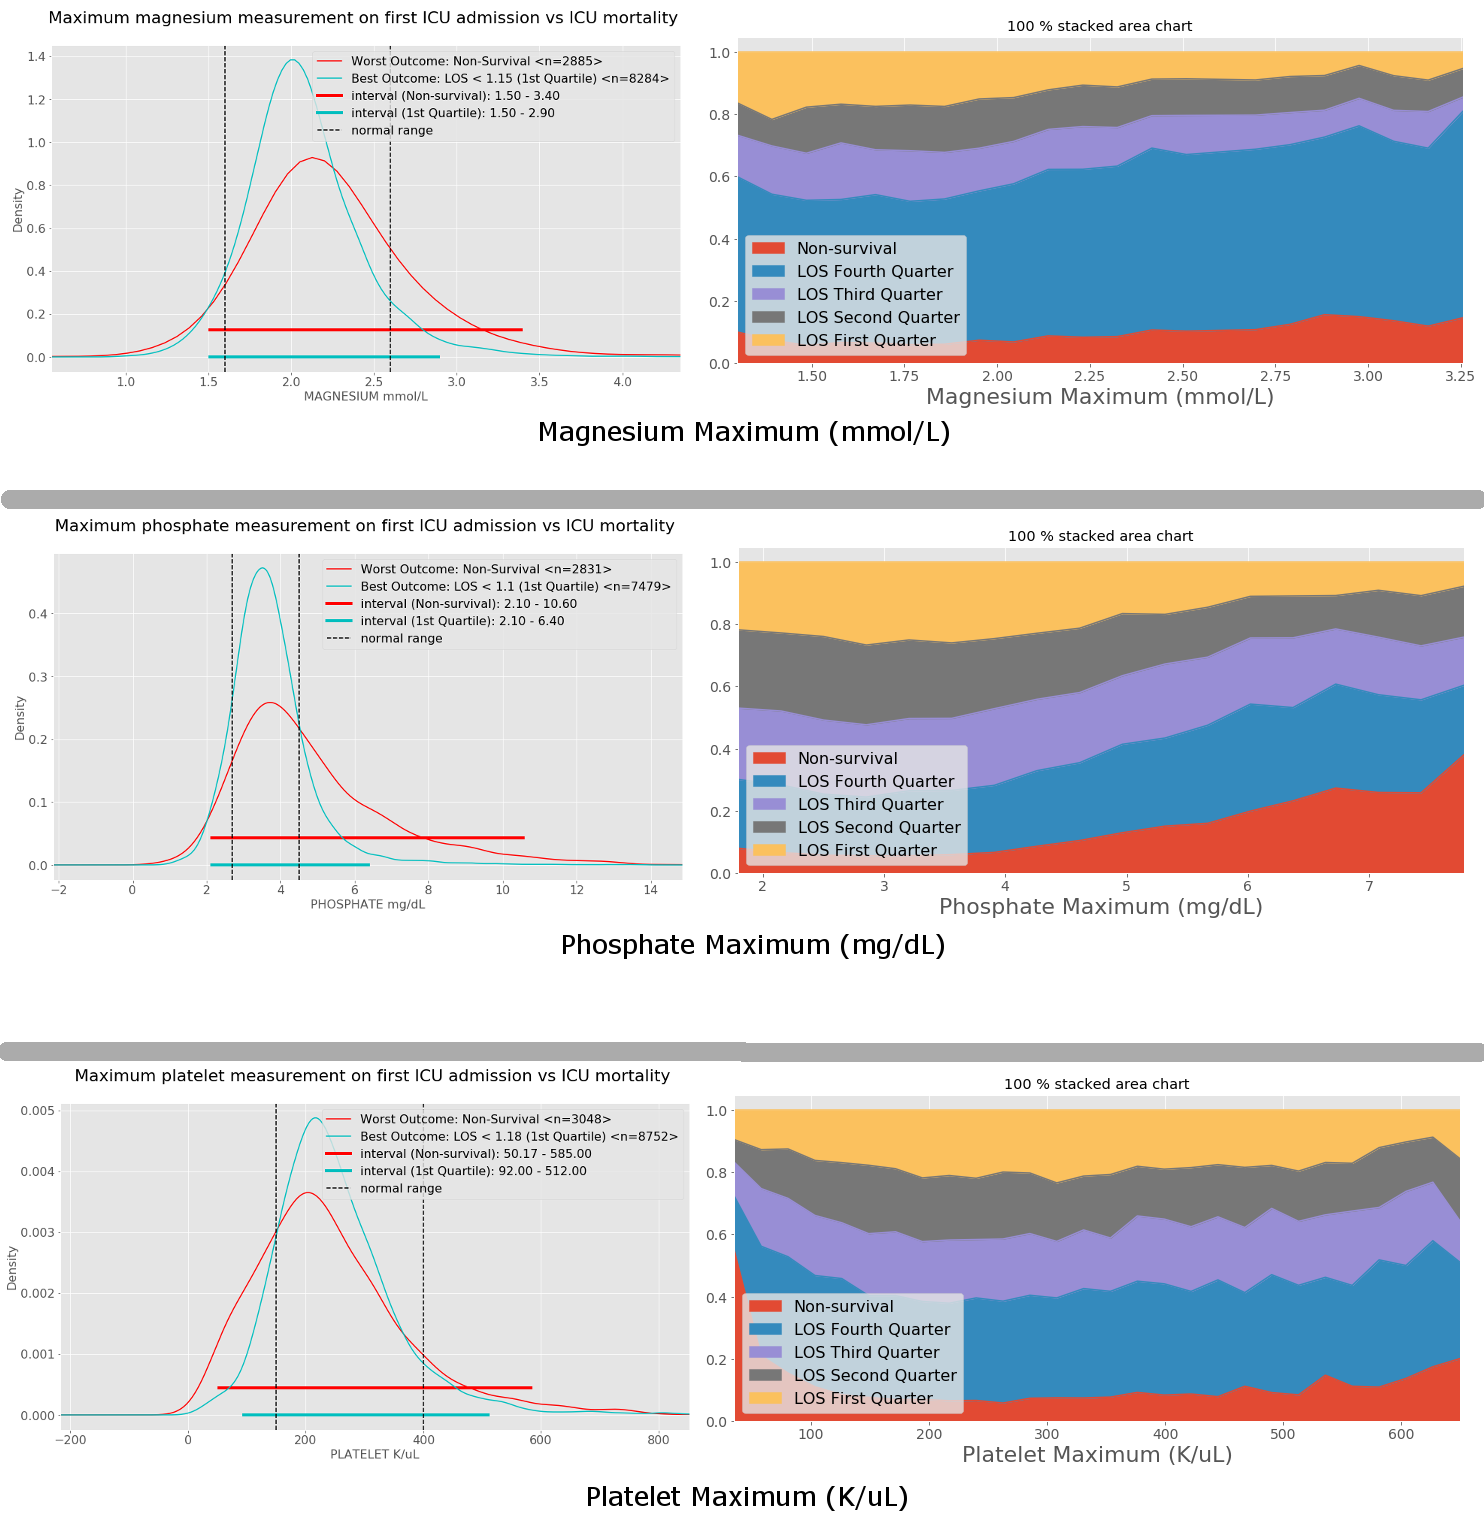
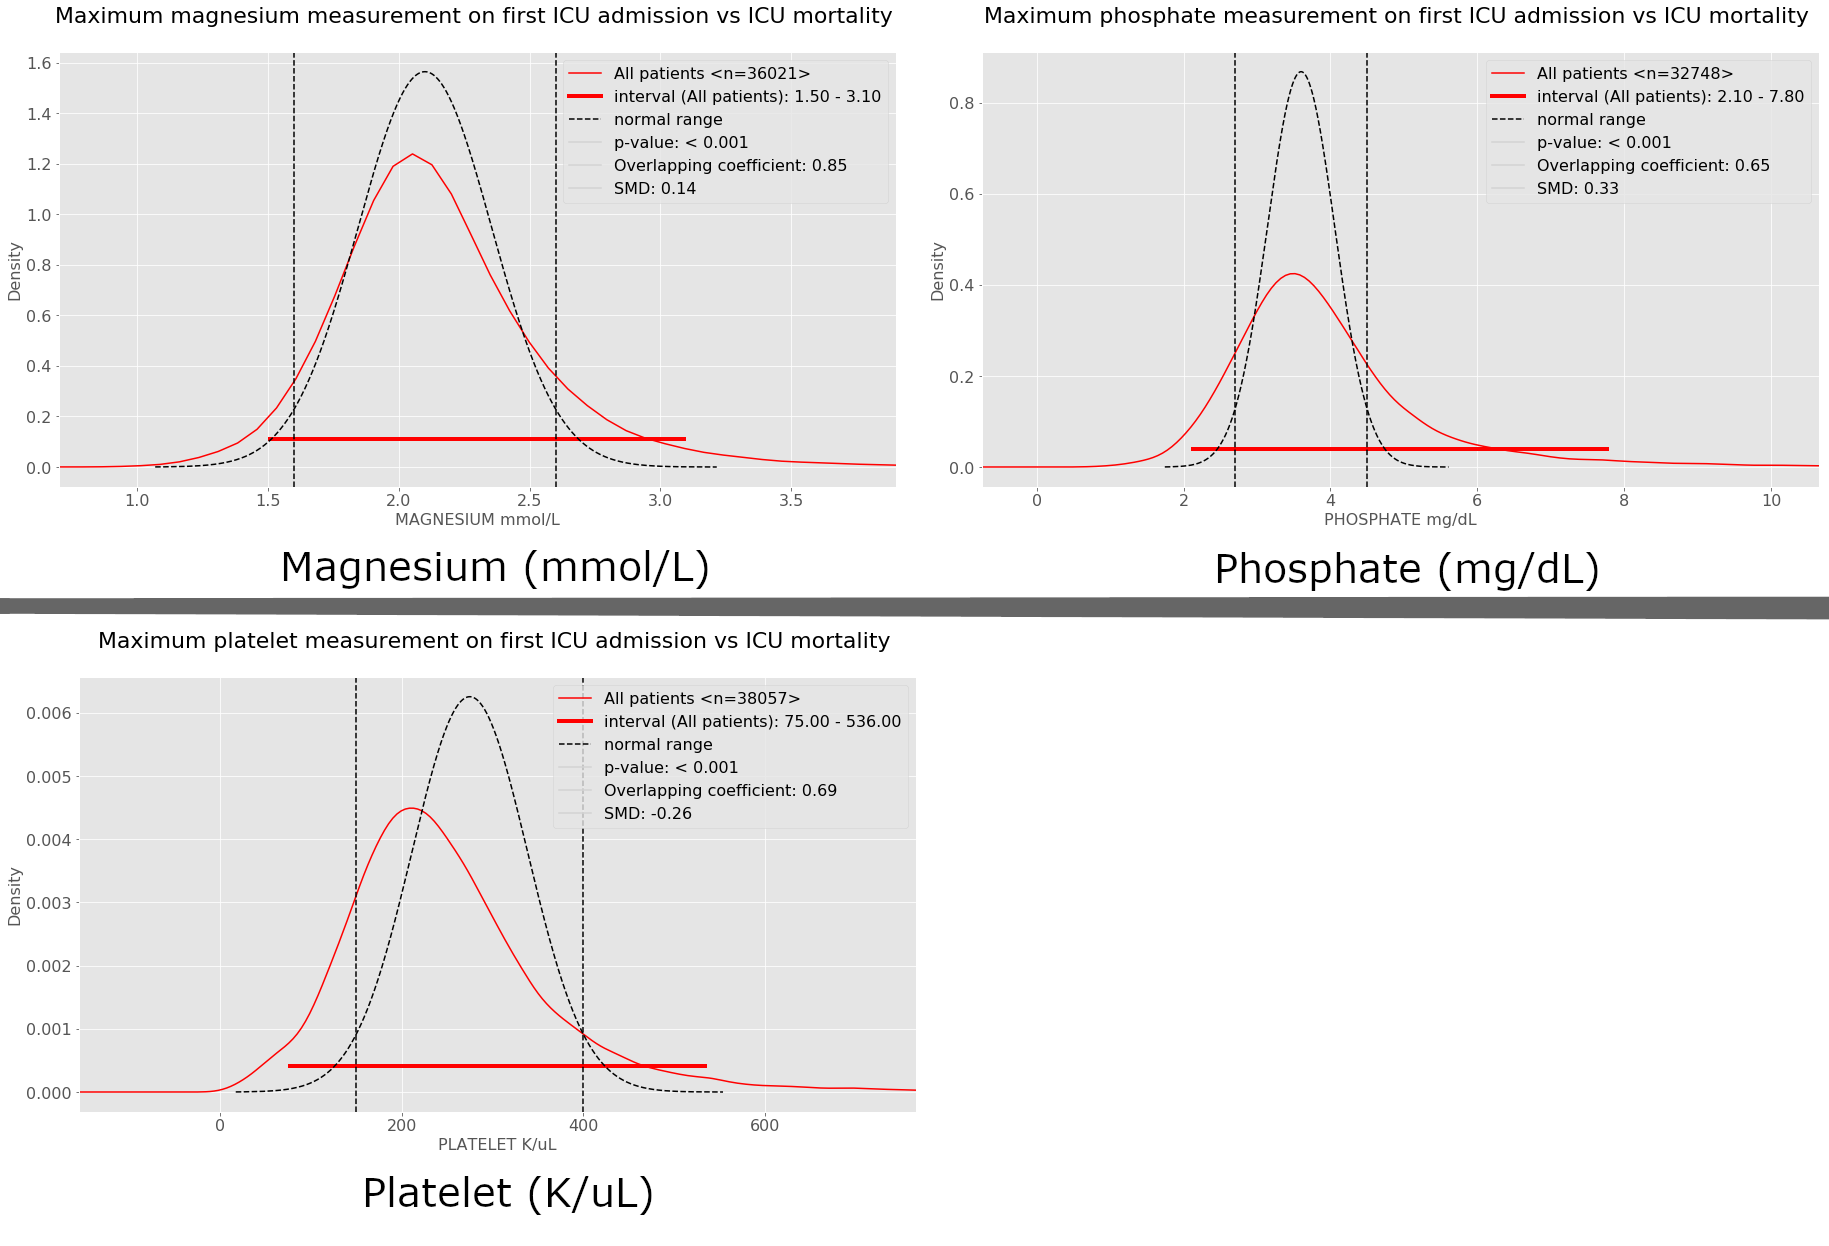
- Magnesium, Phosphate and Platelet maximum
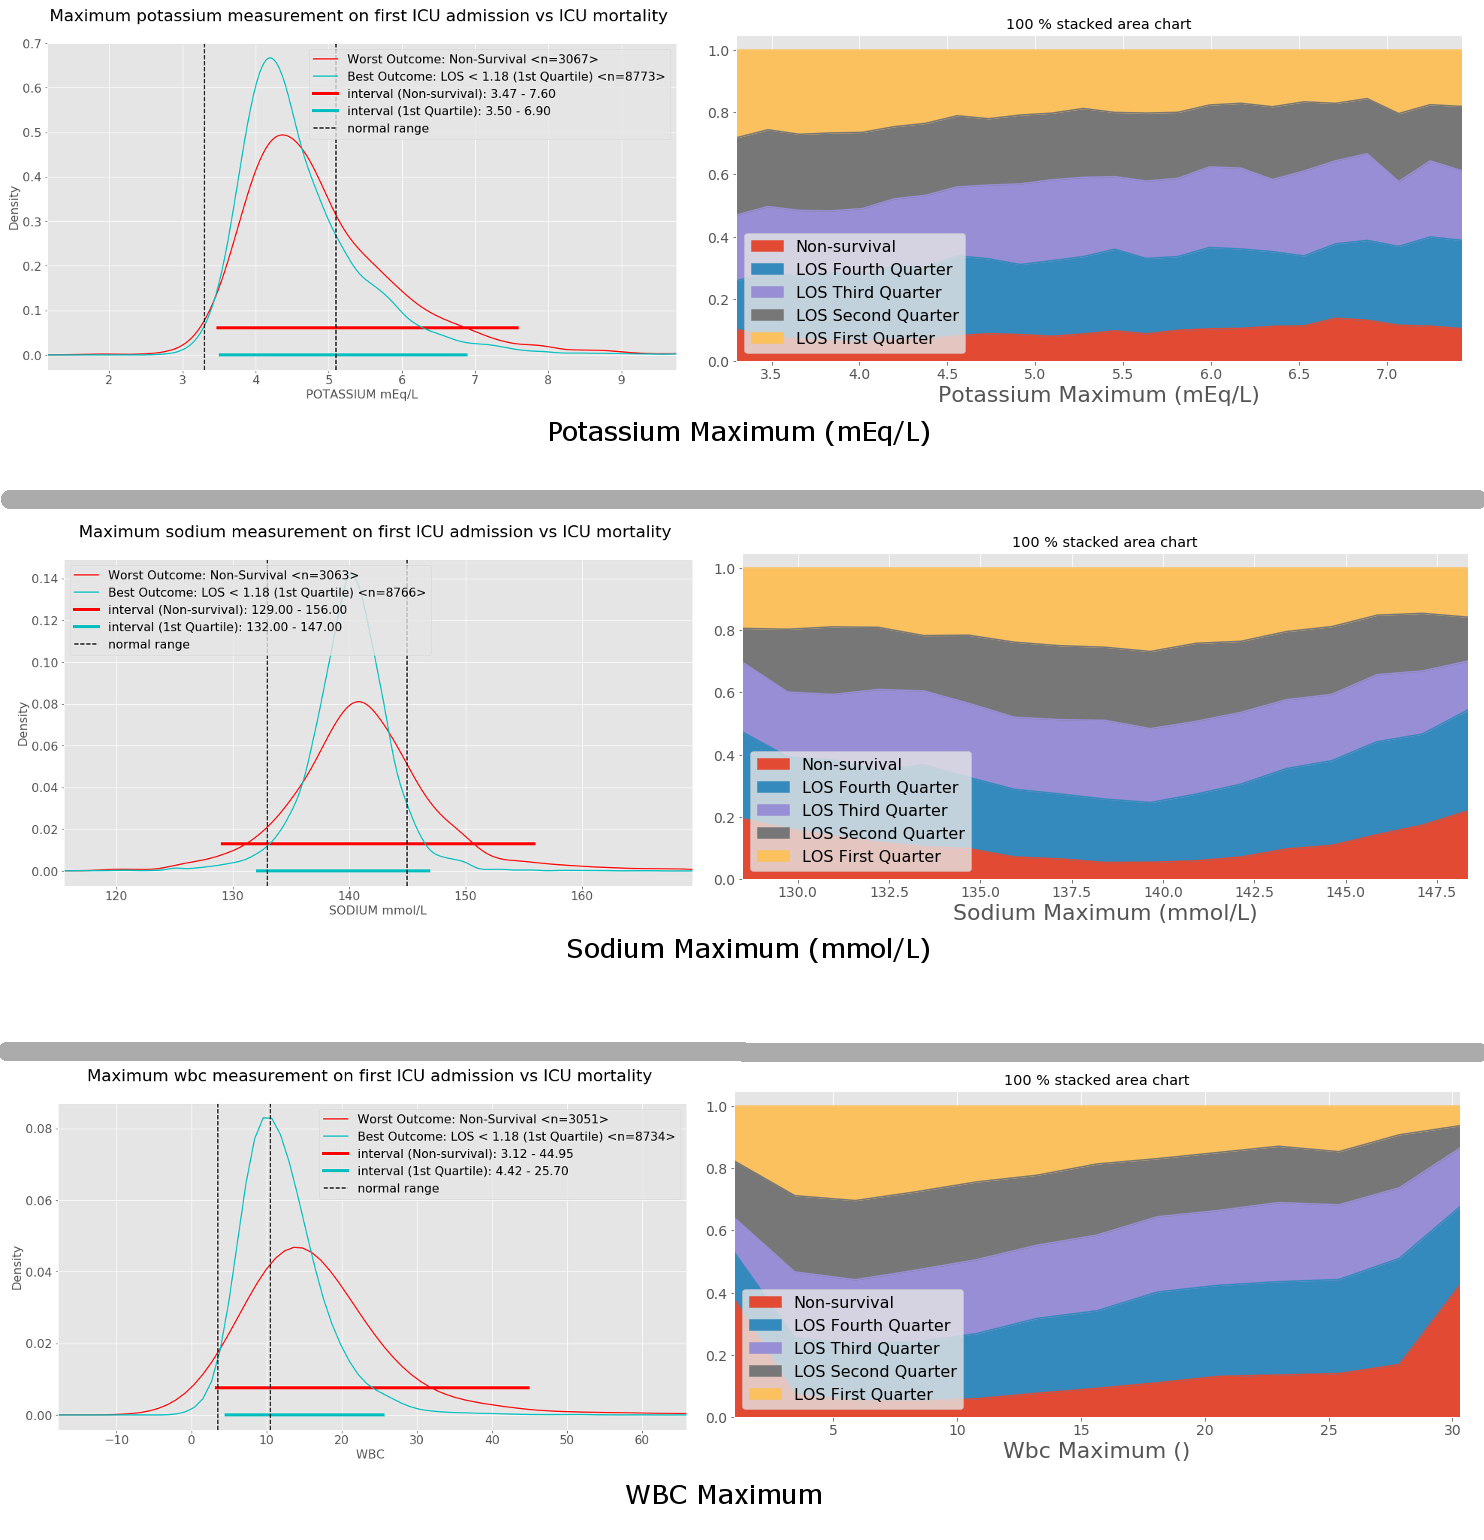
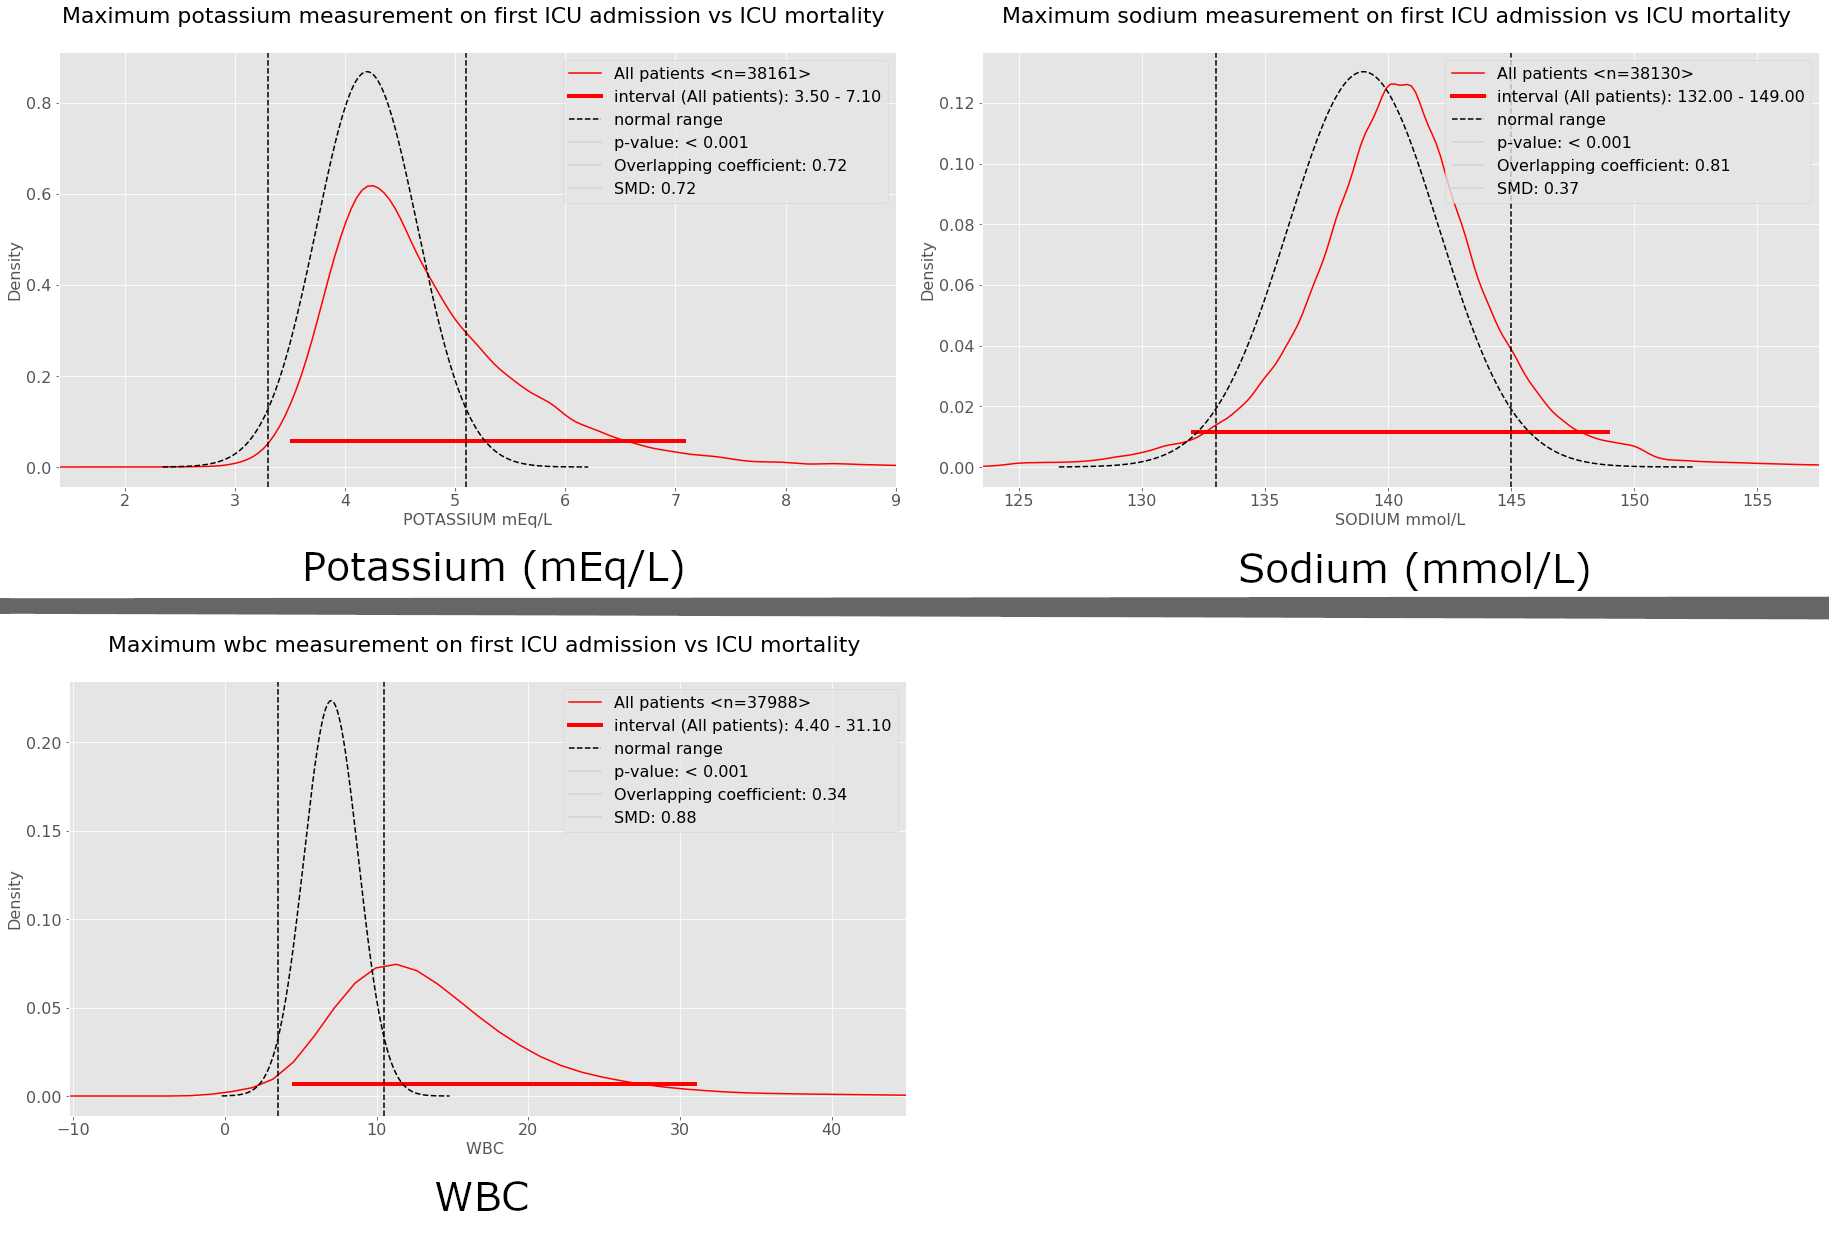
- Potassium, Sodium and WBC maximum

