In this workshop, we are going to do some analysis of the JVM's heap dump.
- Java Mission Control (Oracle Java 7u40+)
- Eclipse Memory Analyzer
You may be aware by now, there are many different ways of getting data from the JVM. Here are just a few ways to get heap dump of the JVM.
With jcmd, you have the ability to invoke the GC.heap_dump command. This requires that you
are running as the same OS user as the target JVM process.
jcmd <PID> GC.heap_dump my_little_heap_dump.hprofA more traditional approach is using jmap and invoking the command on the target process.
jmap -dump:format=b,file=my_little_heap_dump.hprof <PID>You can also use jmap to extract a heap dump from a core dump on the process:
sudo gdb --pid=<PID>
gcore /tmp/jvm.core
detach
quit
jmap -dump:format=b,file=my_little_heap_dump.hprof /usr/bin/java /tmp/jvm.core
💡 Capturing a heap dump from a core dump on Java 8, you may run into this issue: JDK-8073606.
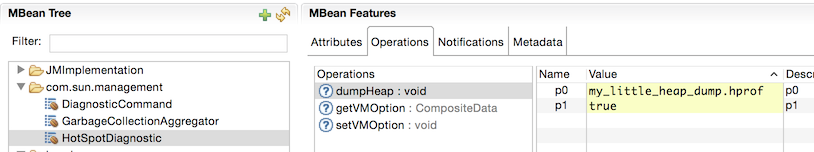
You can capture a heap dump by invoking a diagnostic MBean which is included in the Oracle JDK. You can do so by opening your favorite MBean browser (ex. jconsole, jmc) and invoke
the com.sun.management.HotSpotDiagnostic. The arguments are:
- Filename of the heap dump that will be created. 💡 Note, it will be created with file ownership of the hosting JVM process.
- Indicator to dump all live object (true will dump only live objects)
As we had in capturing a heap dump, there are many different tools at looking at a heap dump. We will go through three common tools in which we can do some analysis of a heap dump. All of which are free. 😃
VisualVM is a tool which is part of Oracle's JDK (has been since Java 6). This tool was spawned from the Netbeans Profiler, and it has some helpful tools to inspect a heap dump.
To load the heap dump in VisualVM, you will just go to File -> Load... and specify the File Format to be Heap Dumps.... Once it is loaded, a view will then be presented with the following sections:
- Summary
- Classes
- Instances
- OQL Console
For the purpose of the workshop we are only going to utilize the OQL Console to construct queries on the heap. There are other options in VisualVM which can give you context about your heap, but I feel there are other better tools we will touch on later. The attractive feature I like with VisualVM is that its OQL Console allows you to write Javascript code to query objects, which you can then do other functions on that data.
From the OQL Console, we will issue queries and then allow you to further play around with the language.
Query for Thread objects which are daemons (you can get context of Threads, since they are objects in your heap too):
select t from java.lang.Thread t where t.daemon == trueThese basic results which are returned, are essentially hyperlinks, that you can then click and begin diving into the instance state.
Query for Thread objects (similar to last query), but return multiple attributes as JSON:
select {name: t.name.toString(), thread_id: t.tid }
from java.lang.Thread t
where t.daemon == true
Query which includes a Javascript function to filter results by looking at all the ConferenceSession objects, and only report the ones which have tags.
function hasTags(conf) {
  return conf.tags.size > 0
}

filter(heap.objects('cchesser.javaperf.workshop.data.ConferenceSession'), hasTags)
Take that previous query and further expand it to list it in JSON with the number of tags:
function hasTags(conf) {
  return conf.tags.size > 0
}

map(filter(heap.objects('cchesser.javaperf.workshop.data.ConferenceSession'), hasTags),
 '{ conference: it, tags: it.tags.size }')
We can further expand this to sort the results, descending by number of tags, and list the tags in the results:
function hasTags(conf) {
  return conf.tags.size > 0
}

sort(map(filter(heap.objects('cchesser.javaperf.workshop.data.ConferenceSession'), hasTags),
 '{ conference: it, tag_count: it.tags.size, tags: toArray(it.tags.elementData) }'), 'rhs.tag_count - lhs.tag_count')
Reference: VisualVM OQL Help
💡 Note, the OQL which you use between this tool (and others), isn't necessarily standard, and therefore cannot be used between tooling without issues. VisualVM gives you the ability to leverage Javascript, which is unique to other tools supporting heap dump analysis.
With Java Mission Control, there is an ability to add plugins, one of which, is the JOverflow plugin. You can install it by going to Help and select Install New Software..., and then select the JOverflow Heap Analyzer.

Once this is installed, when you open a .hprof file, JOverflow will be loaded. Also, it
add a context menu selection to Dump Heap of JVMs from the JVM Browser.

When you open a heap dump, an initial analysis is completed which lists a large range of anti-patterns and things that can be improved in relation to the memory you utilize.

Here is a listing of some the patterns that JOverflow identifies:
- Empty Unused Collections: Empty collection, where modification
count == 0. - Empty Used Collections: Empty collection, where modification
count != 0. - Small Sparse: Only for array-based, where less than half the slots are occupied. Small is considered: size <= default (ex. 16 for HashMap).
- Large Sparse: Only for array-based, where less than half the slots are occupied. Large is considered: Size > default.
- Boxed: Contains boxed Numbers (ex. java.lang.Integer). Each of these boxed number has overhead as compared to their primitive counterpart due to object references.
- Small Collections: Collections with 1 to 4 elements. There are fixed costs of collections, which may lend this set of data better hosted in an array vs. a full Java collection type.
- Vertical Bar Collections: Collection which is a list of lists, where the outer collection is large, and it's elements are all small collections (ex. List(1000) of List(100))
- Zero Size Arrays: Array where length == 0 (still consumers 12 - 16 bytes).
- Vertical Bar Arrays: Similar to Vertical Bar Collections, but for arrays.
- Sparse Arrays: Less than half of the elements are not null.
- Long Zero Tail Arrays: Ends with a consecutive series of zeros, where the tail length is >= size / 2.
- Empty Arrays: Only null elements.
- Duplicate Arrays: Where an array contents are the same in another instance, but they are separate array instances.
- Duplicate Strings: Same as Duplicate Array, where
string1.equals(string2)andstring1 != string2.
Reference: JOverflow: Advanced Heap Analysis in Java Mission Control
As you play with JOverflow, once you click on something, it will begin filtering down your content. If you wish to reduce
down to code that you may own, you can start doing a package filter on the ancestor section. In this example, I want to see duplicate strings for code under cchesser. In this case, I can see that our workshop service has several duplicate
strings (as this content is replicated on each object):
- Regular Session
- 4-Hour Workshop
- 8-Hour Workshop
However, the number of instances / overhead is extremely low (since this is a small service), it gives you visibility of areas that you could optimize.

Eclipse Memory Analyzer is a fairly mature tool on analyzing heap dumps. It is a rich tool that includes the abilities to do OQL queries on the heap, general reporting on anti-patterns, and helpful common views (like the dominator tree). Eclipse Memory Analyzer tool is a separate install which can be a standalone install, or it can run as a plugin within Eclipse. First, install the tool if you haven't already via their downloads page.
After you have it installed, go to File and then Open Heap Dump... and specify the hprof file that you wish to analyze.
💡 When Eclipse Memory Analyzer loads your hprof file, it will create many other index files to assist in optimally analyzing and navigating through your heap dump. It may make it easier to isolate your prof file in its own directory prior to opening it, based on the secondary files which are created. You can always just delete these files within Eclipse Memory Analyzer by opening the Heap Dump History window, right-clicking the hprof which was previously loaded, and selecting Delete Index Files. Example listing of index files which get generated by suffix:
.domIn.index.domOut.index.index.o2ret.index.a2s.index.idx.index.inbound.index.o2c.index.o2hprof.index.outbound.index.threads
A common first area to look at your heap within Eclipse Memory Analyzer is the dominator tree. From the dominator tree, you can organize by the retained heap size, and then begin drilling down the tree to see the contributors to the largest GC roots.

The histogram gives you a quick listing of all the top consumers by type. Typically this is going to provide context of the large consumers based on their "lower-level" types. For example, char[] is a common large contributor, which then will be followed by String which is a type that is predominately weighted by the size of the char[].

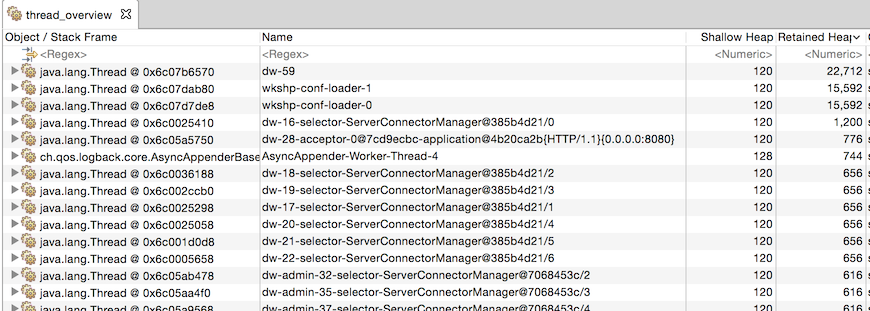
The thread overview is a helpful view when you are looking at contributors based on the execution of code. For example, if you have a JVM which has thrown an OutOfMemoryError, you can tell if some type of request caused a massive spike which caused the exhaustion of memory, or if the requests may have not been abnormal, there just wasn't sufficient space to support the request.
Another strong feature of Eclipse Memory Analyzer is the OQL studio to execute queries to do lookup on objects in your heap.
Lookup our ConferenceSession class type:
SELECT *
FROM INSTANCEOF cchesser.javaperf.workshop.data.ConferenceSession
💡 To execute the query, you click on the red exclamation mark (❗).
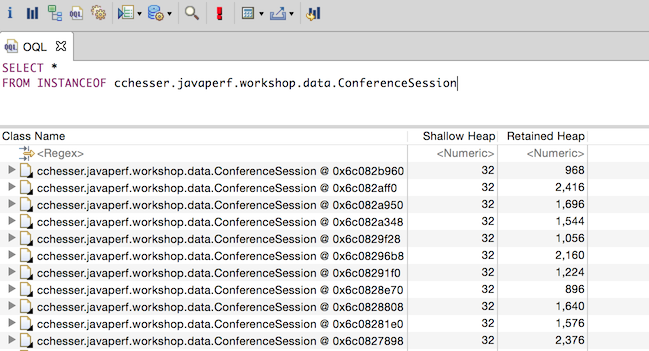
By returning the raw type back, you can expand each one to further look at the contents of the object. If you wanted to just report the object with its title attribute and the object's retained sized, you could do this:
SELECT c.title.toString(), c.@retainedHeapSize
FROM INSTANCEOF cchesser.javaperf.workshop.data.ConferenceSession c
Now, you could then filter this by including a WHERE clause, where you can filter it by
the title or the abstract:
SELECT c.title.toString(), c.@retainedHeapSize FROM INSTANCEOF cchesser.javaperf.workshop.data.ConferenceSession c
WHERE c.title.toString() LIKE ".*(J|j)ava.*" OR c.abstract.toString() LIKE ".*(J|j)ava.*"
Reference: Eclipse Memory Analyzer OQL Syntax