Update layout & rendering algorithms for plot
Plot exposes following methods affecting layout and rendering:
-
updateLayoutandrequestUpdateLayoutupdate screen positions and sizes of children DOM elements of the plot in accordance with the current screen size of the master plot’s host DIV element and the current visible rectangle in plot coordinates. TherequestUpdateLayoutis an async version of the method which allows to perform only most recent update, and thus improve interactivity for low-frame rate rendering. -
requestNextFrame(plot)invalidates the given plot and asynchronously requests rendering for it in current visible rectangle. -
requestNextFrameOrUpdate()is intended to be called from derived plots. This method efficiently invalidates the plot; * If auto-fit mode is enabled, and bounding box or padding changed, layout update is requested. * Otherwise, next frame is requested.
Private method Plot.setVisibleRegion disables auto-fit (if it is enabled), takes a desired visible rectangle, and saves it in the private field _plotRect, and asynchronously updates the layout which will make the saved rectangle actual. This method is called during the navigation’s animation and to synchronize visible rectangles of bound plots (see Bound plots). For the latter, the method takes the second argument which suppresses notifications for bound plots in the coming update layout (to avoid echo in the binding).
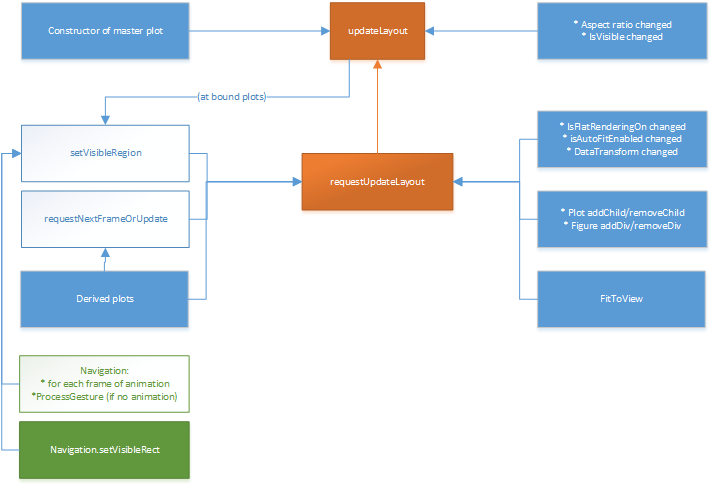
Update layout algorithm takes the current screen size of the master plot’s host DIV element and the desired visible rectangle in plot coordinates (depends on whether auto fit mode is enabled or not), then measure new layout and arranges the children elements:
- computes visible plot plane region from bounding boxes of dependent plots (if auto fit is enabled),
- computes and updates the physical layout (incl. size) of the plot’s inner HTML elements (this may concern visible plot region),
- forces rendering for each plot.