A dashboard for HR planning managers


This is a proof of concept I've developed for a course project.
Basic structure:
- There are three regional excel files, for Americas, APAC and Europe, where respective HR enter details for new hires and exits
- The regional files contain basic data fields like email, Name, Date of hire, Location, Org(Delivery, DeliveryOps, Support and Corporate), Exit date, type of exit(voluntary,involuntary), employment type, etc.
- The R code reads the regional files, consolidates them into a "global" dataset and manipulates them to create a dashboard
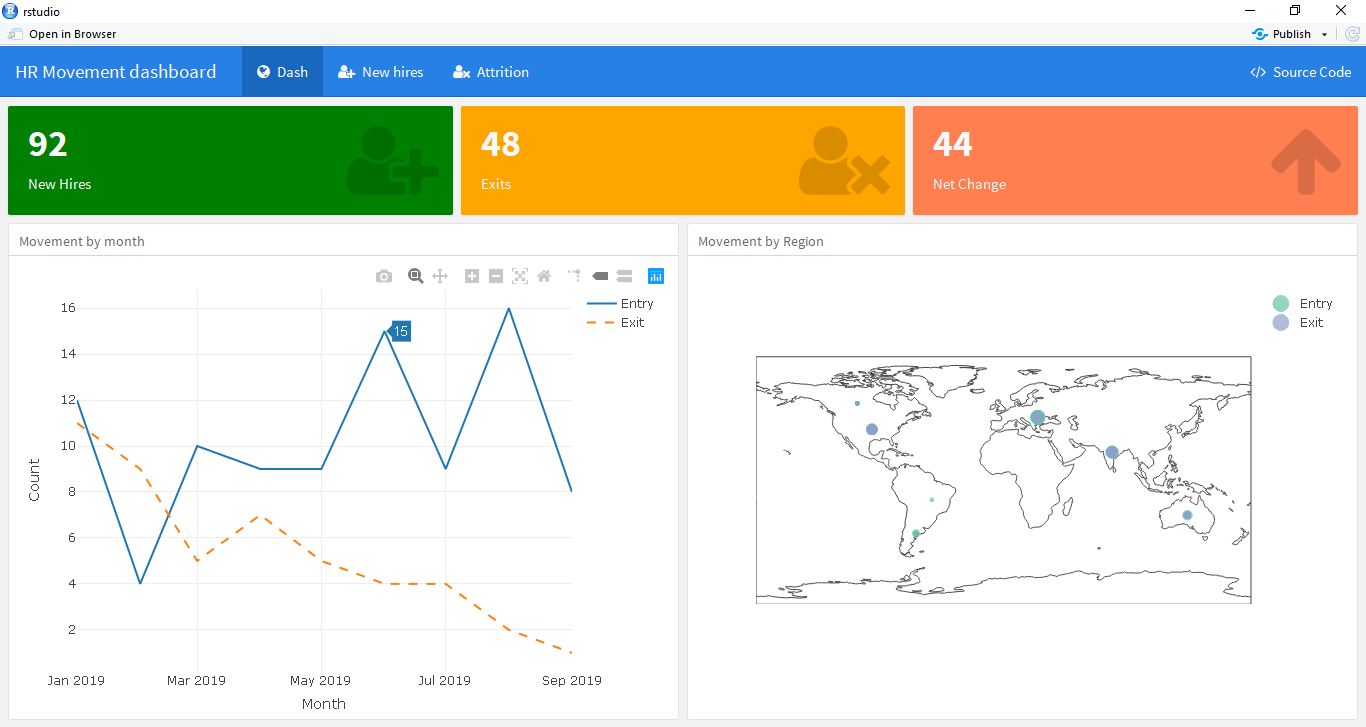
- The dashboard has three tabs: the main dash, new hires and attrition
Tools/concepts used:
- I wanted to learn the flexdashboard library which is a simpler, easy to learn version of shiny. Flexdashboard uses R markdown to create an html output
- I've used plotly for all the plots. It's built similar to ggplot2 ,it uses the grammar of graphics, but is a dynamic version. So you can use the labels as filters for the plots