This repository contains the data and analysis related to Amelia Ritger's research on ocean acidification in California intertidal systems.
These data were collected using Durafet-based pH sensors and HOBO temperature loggers with support from Dr. Francis Chan (OSU). Sensors were deployed in the rocky intertidal zone at three sites - Bodega Bay, Lompoc Landing, and Alegria - from May 2021 until November 2021. Sensors collected temperature and pH measurements every 15 minutes. Sites were selected because they 1) had been studied before, which would allow us to build upon historical datasets, 2) capture variation in oceanographic conditions attributed to California's two upwelling regimes, and 3) limit public access, which protects the valuable sensor equipment.

This repo is maintained by Hofmann Lab graduate student Amelia Ritger (GitHub: @ameliaritger) at the University of California, Santa Barbara in the Department of Ecology, Evolution, & Marine Biology. In 2021, a group of UCSB undergraduate students worked with Amelia to create a Shiny app using these data to teach local high school students about ocean acidification. The Shiny app can be found here.
| file name | analysis overview | description |
|---|---|---|
| filter-for-vis.Rmd | Smoothing pH and temperature data for easier visualization | This file uses the de-tided data created in sensor-analysis.Rmd and applies it to create a plot of the de-tided data plus a loess curve to visualize patterns across sites. |
| lol-analysis.Rmd | Lompoc Landing sensor data wrangling without detiding the data | This file contains data analysis and visualization for the Lompoc Landing sensor, which includes data throughout the tide cycle due to the sensor's location within a tidepool and submerged at all times. The data used in this file have already been pre-processed in sensor-analysis.Rmd. |
| sensor-analysis.Rmd | All sites sensor data wrangling for comparative analysis | This file is the meat of the sensor data analysis. Includes scraping tide data, extracting HOBO temperature data, and applying these data to the Durafet pH dataset, and then identifying data outliers and de-tiding the data to compare conditions across sites. |
| file name | description |
|---|---|
| /data/hobo_alg.csv | HOBO logger temperature data from Alegria |
| /data/hobo_bml.csv | HOBO logger temperature data from Bodega Marine Lab |
| /data/hobo_lol.csv | HOBO logger temperature data from Lompoc Landing |
| /data/lol_all.csv | Cleaned up pH and temperature data from Lompoc Landing |
| /data/sensor-data_all.csv | Raw, calibrated pH and temperature data from all sensors |
| /data/sensor-data_detided.csv | De-tided pH and temperature data from all sensors |
| /data/wave-july2021.csv | NOAA NDBC data from Santa Maria buoy July 2021 |
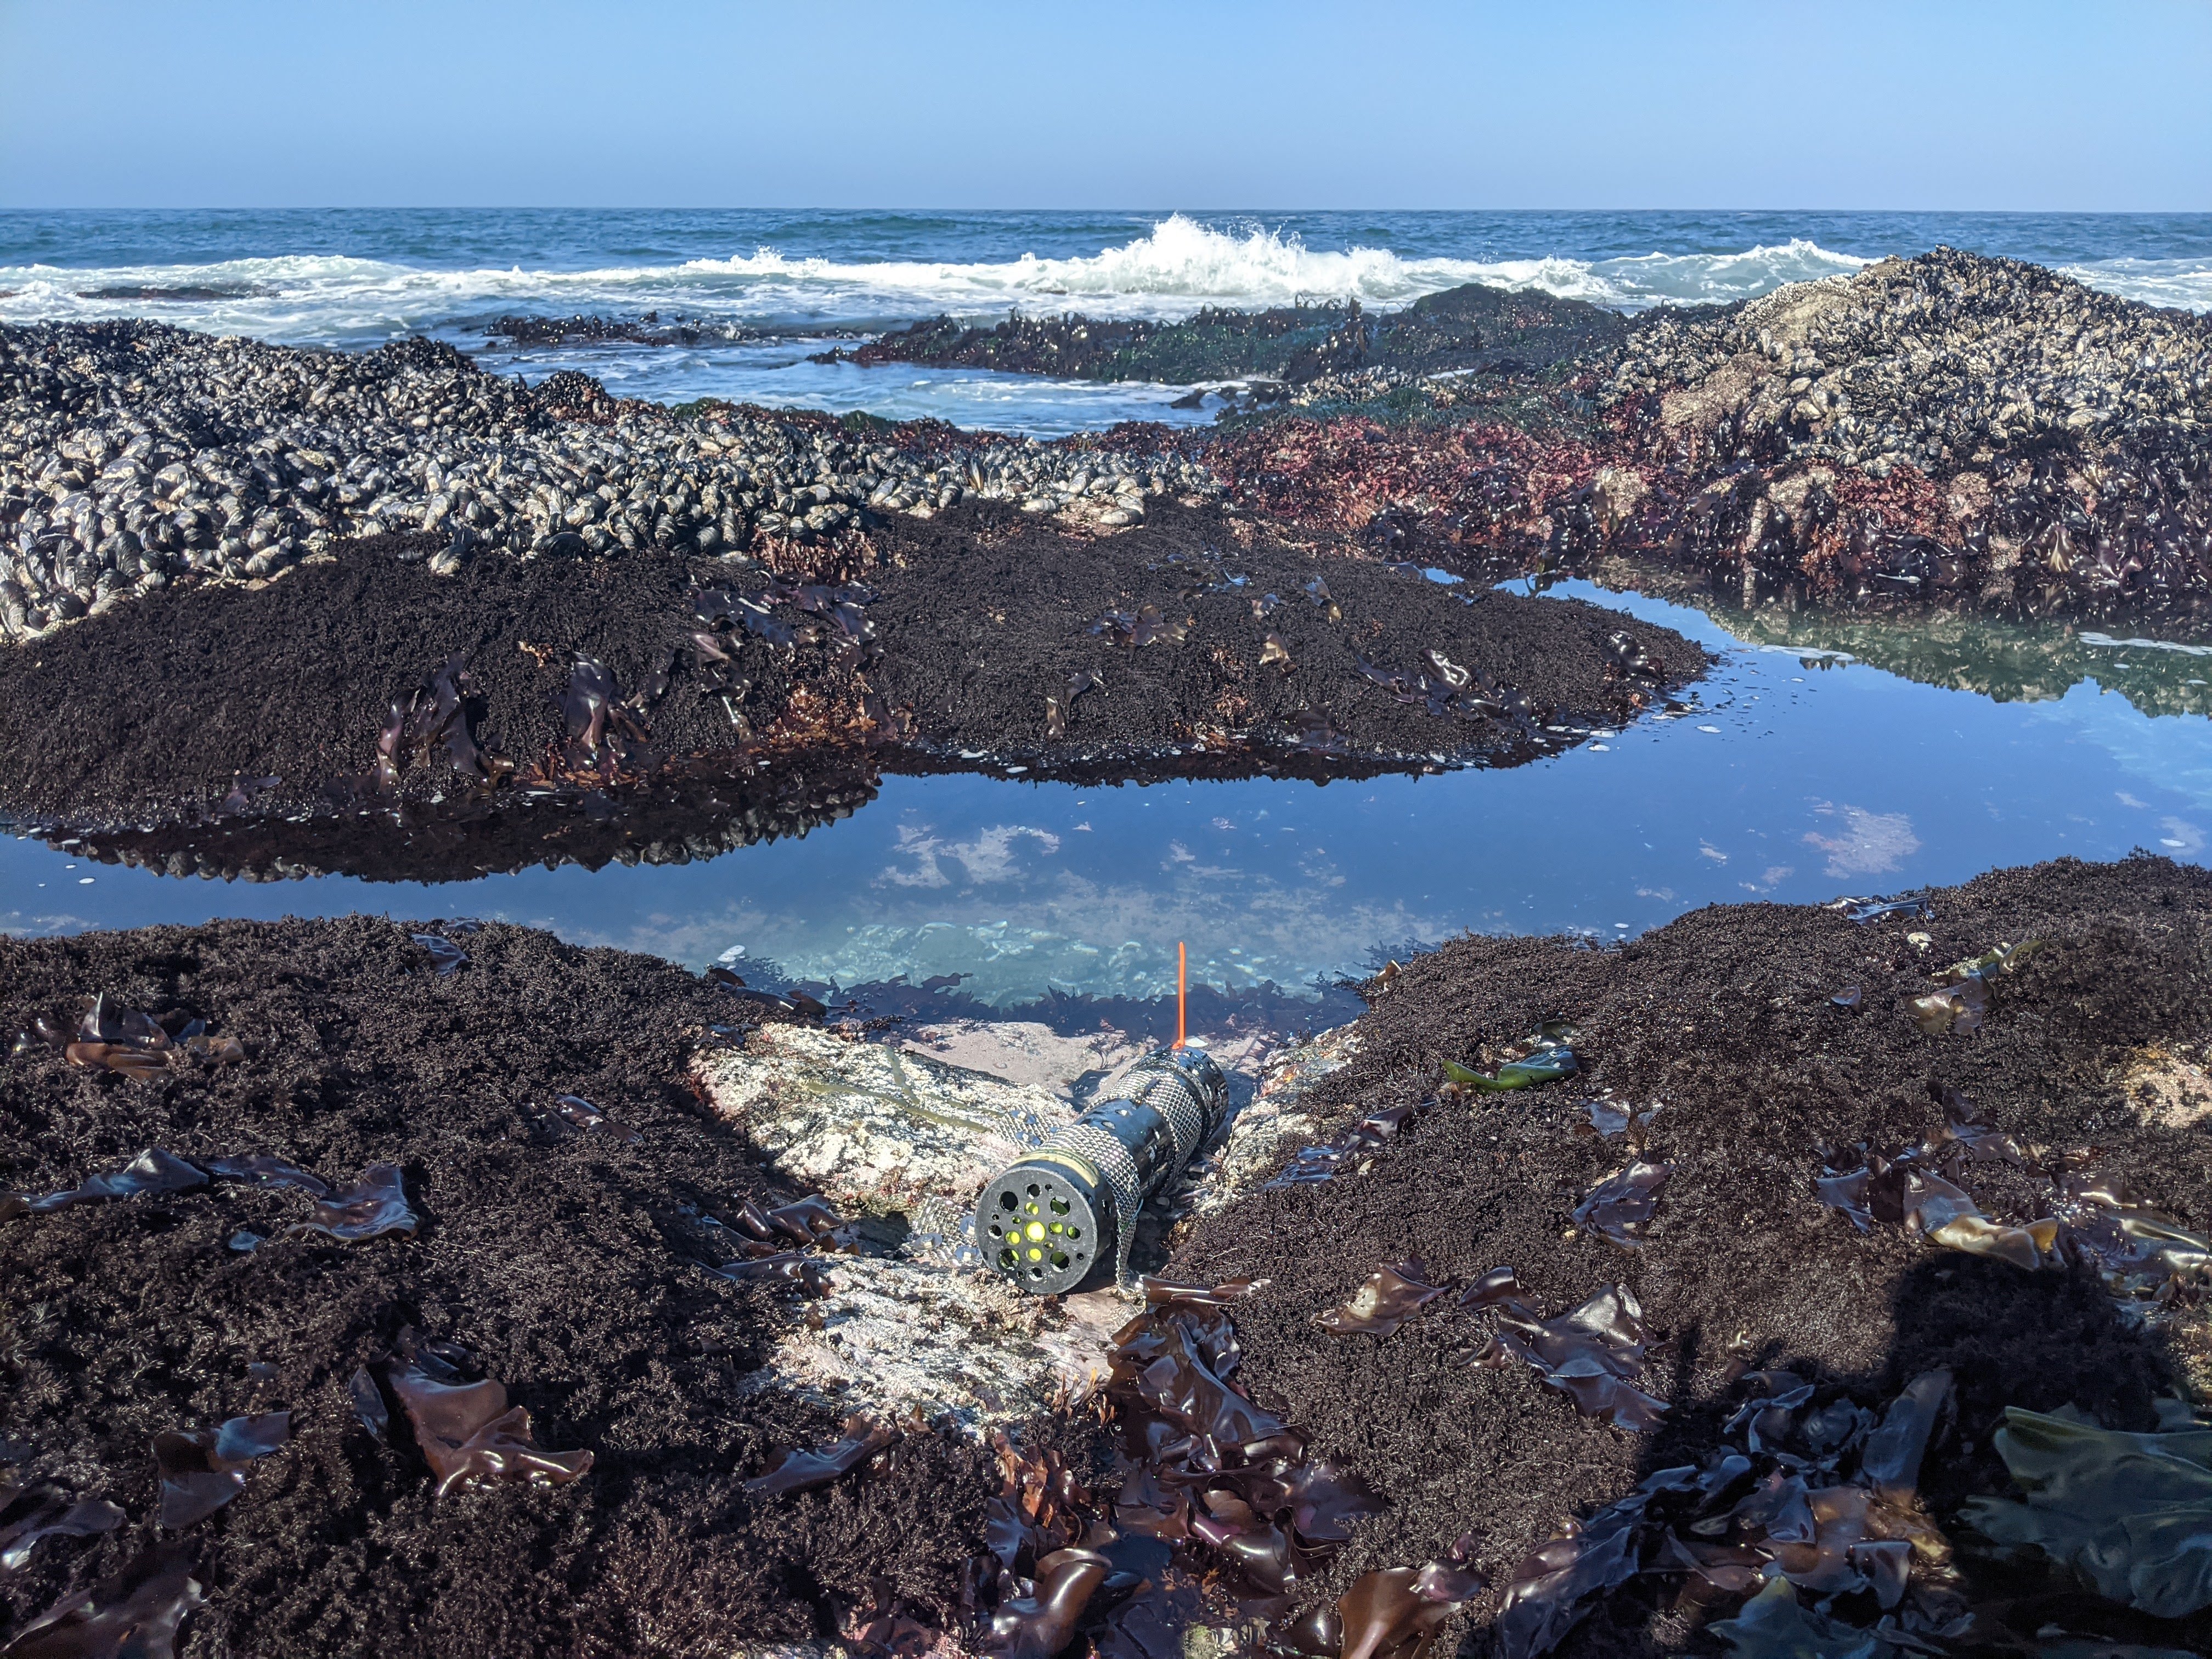
At Alegria
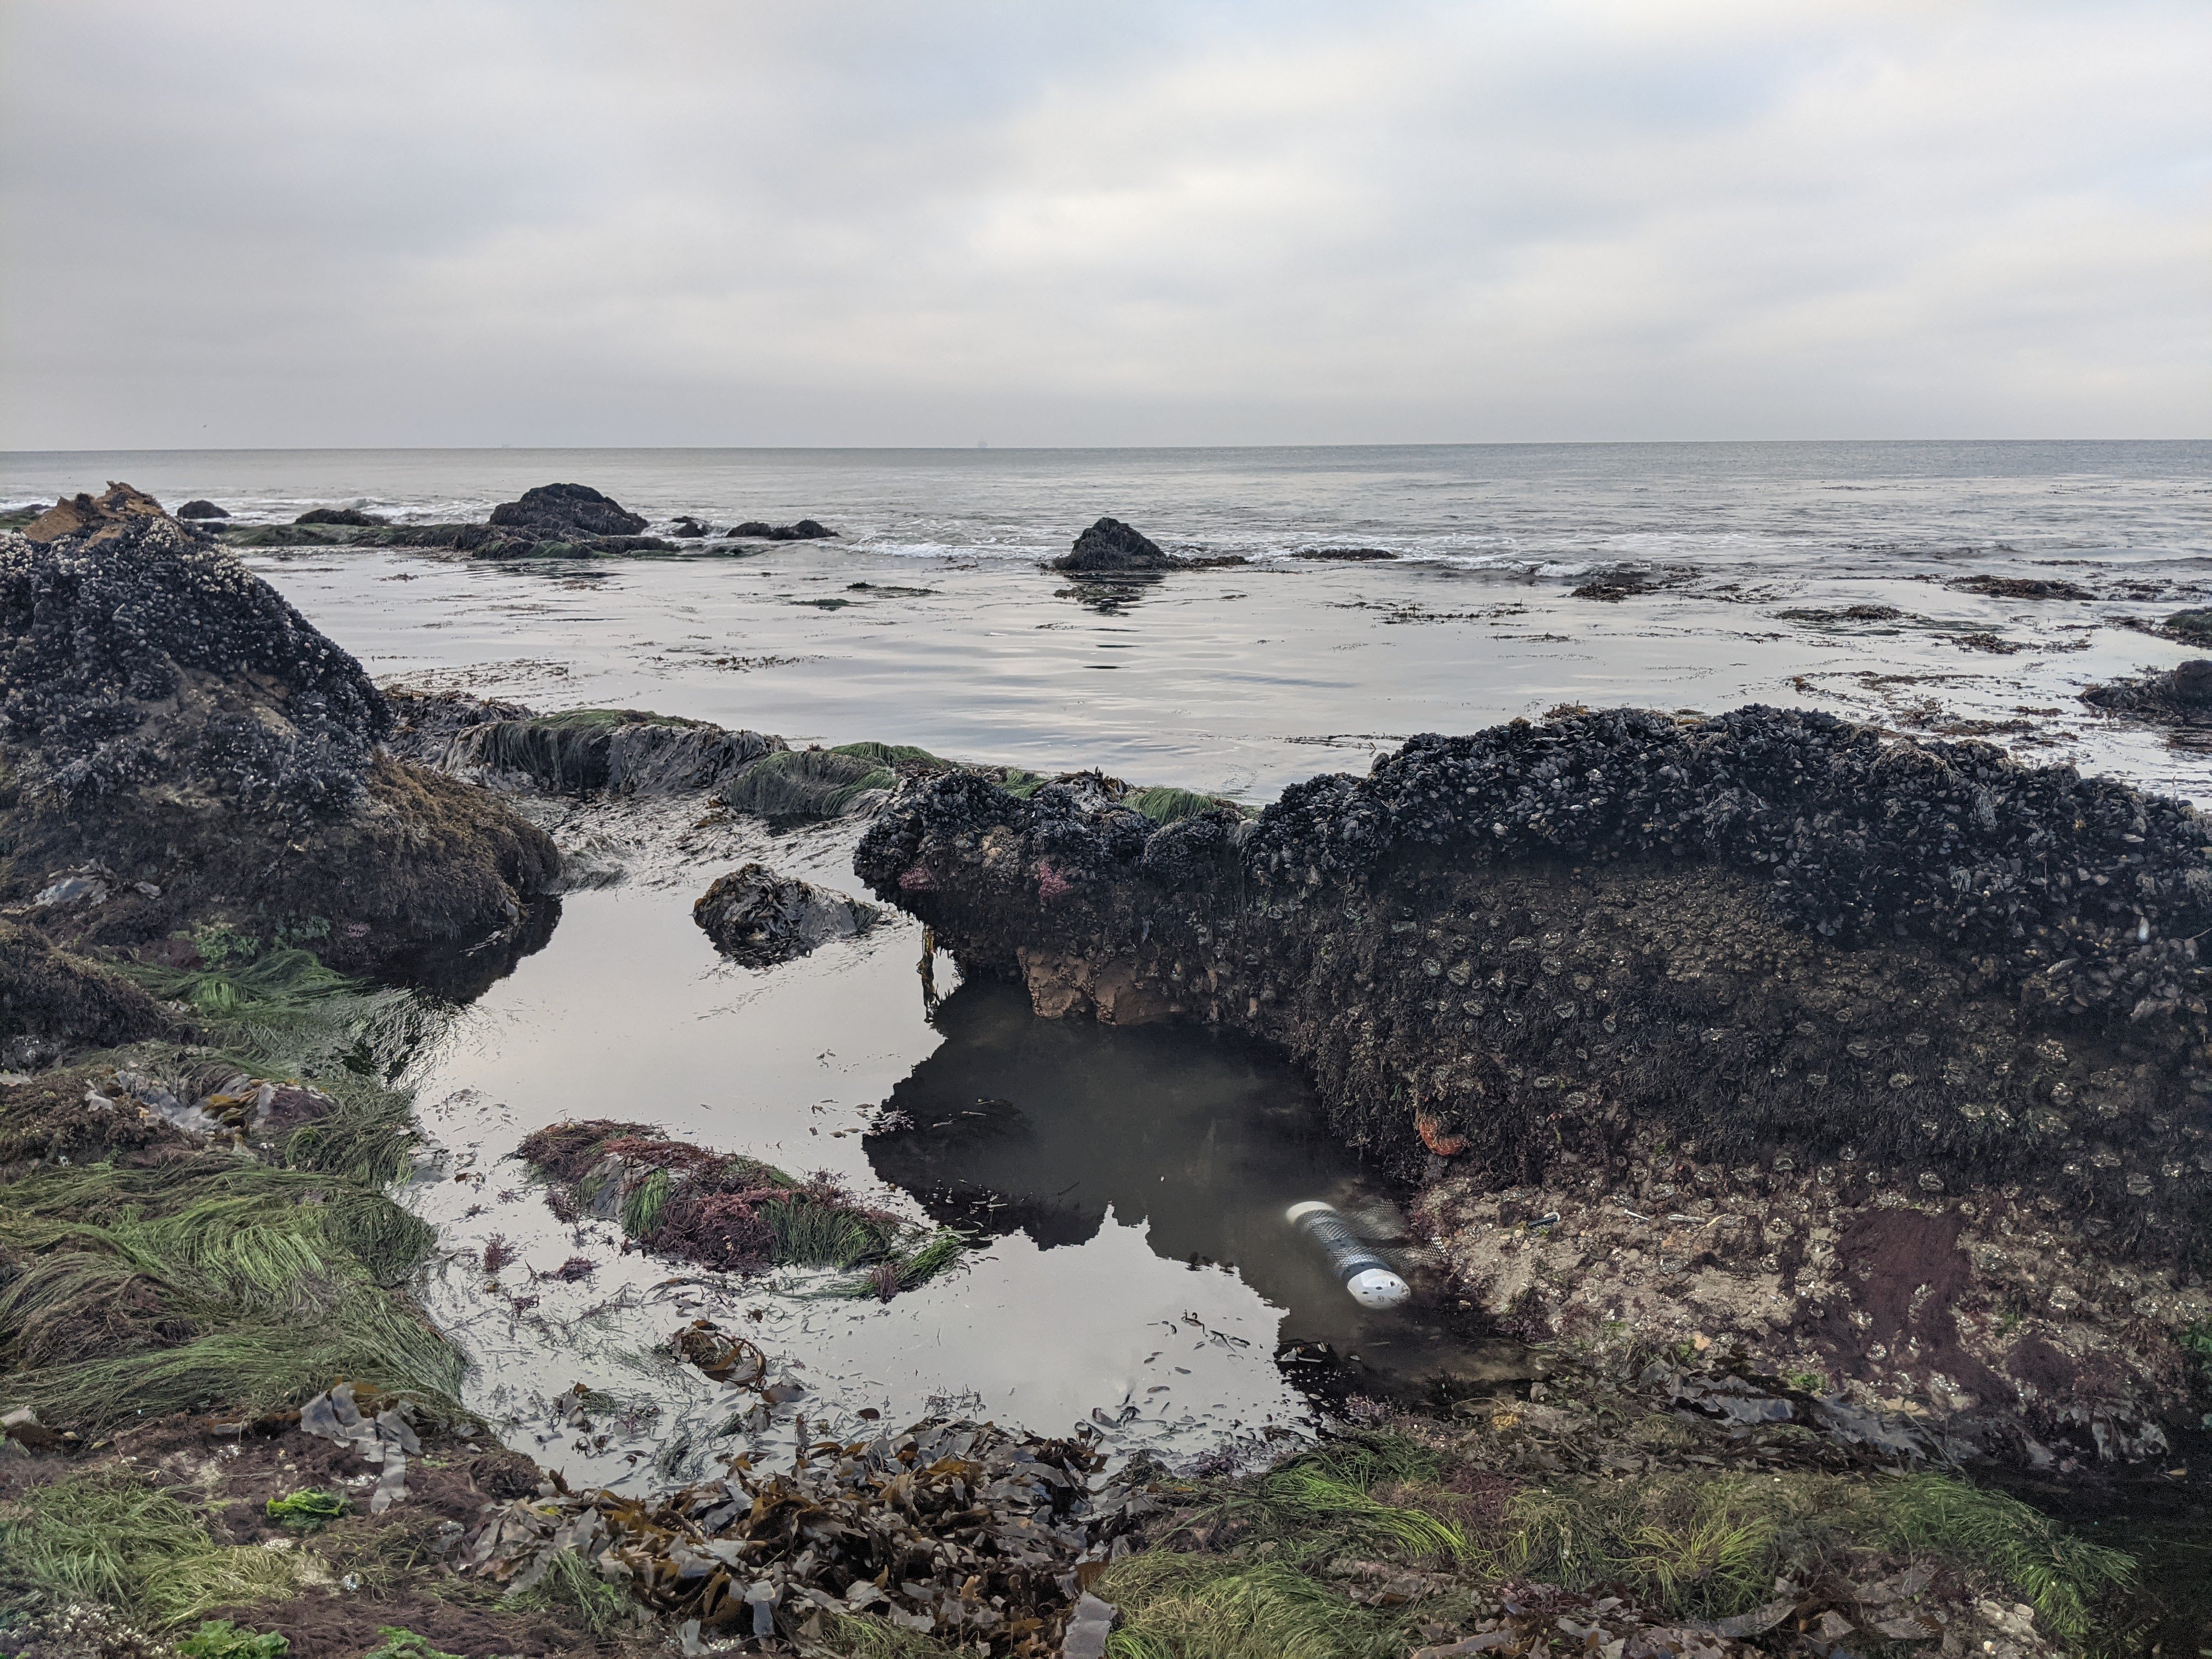
At Lompoc Landing
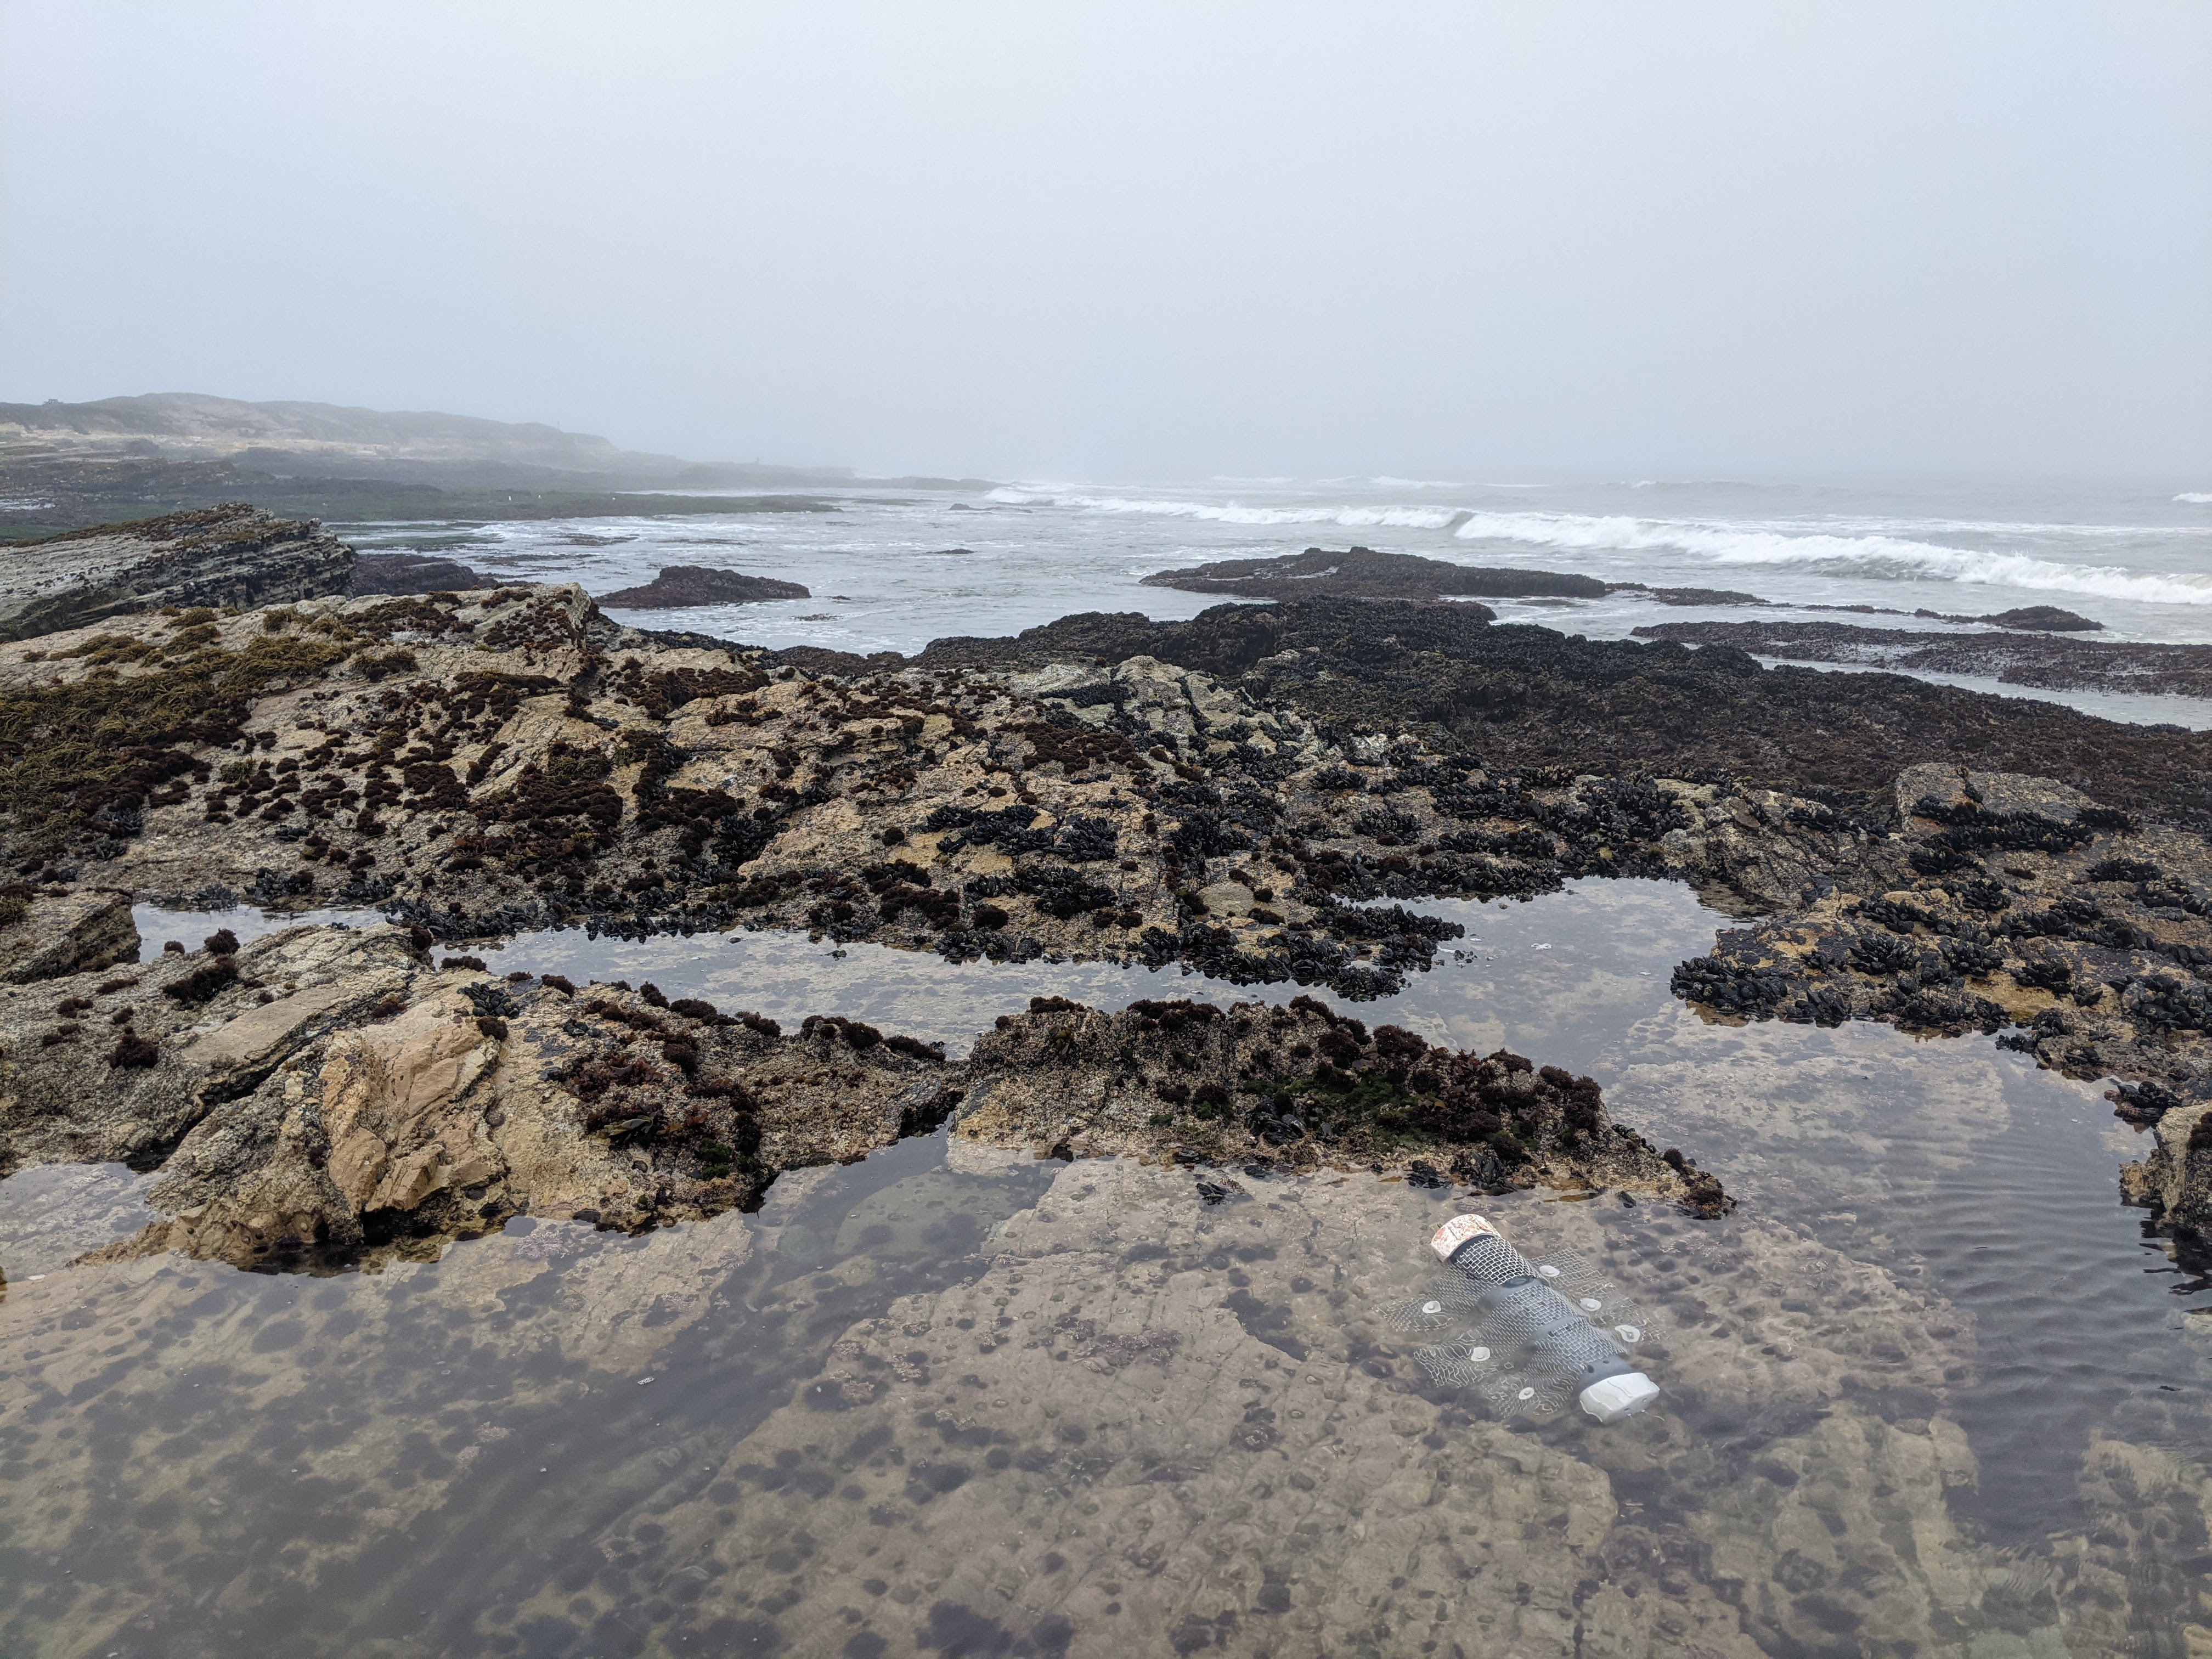
At Bodega Bay