This tutorial is from the Hortonworks Sandbox - a single-node Hadoop cluster running in a virtual machine. Download to run this and other tutorials in the series.
This tutorial describes how to use Excel 2013 to analyze data in the Hortonworks sandbox on Windows 7.
In this procedure, we will use a Microsoft Query in Microsoft Excel 2013 to access sandbox data, and then analyze the data using the Excel Power View feature.
The data we will load and analyze represents a fictitious web retail store in what has become an established use case for Hadoop: deriving insights from large data sources such as web logs. By combining web logs with more traditional customer data, we can better understand our customers, and also understand how to optimize future promotions and advertising.
- Windows 7
- Hortonworks ODBC driver (64-bit) installed and configured
- Hortonworks Sandbox 1.2 or later (installed and running)
- Hortonworks sample data files uploaded and refined as described in “Loading Data into the Hortonworks Sandbox”
- Microsoft Excel 2013 Professional Plus 64-bit
To analyze Hortonworks sandbox data with Excel 2013:
- Use the Microsoft Query feature to access Hortonworks sandbox data.
- Use the Excel Power View feature to analyze the data.
-
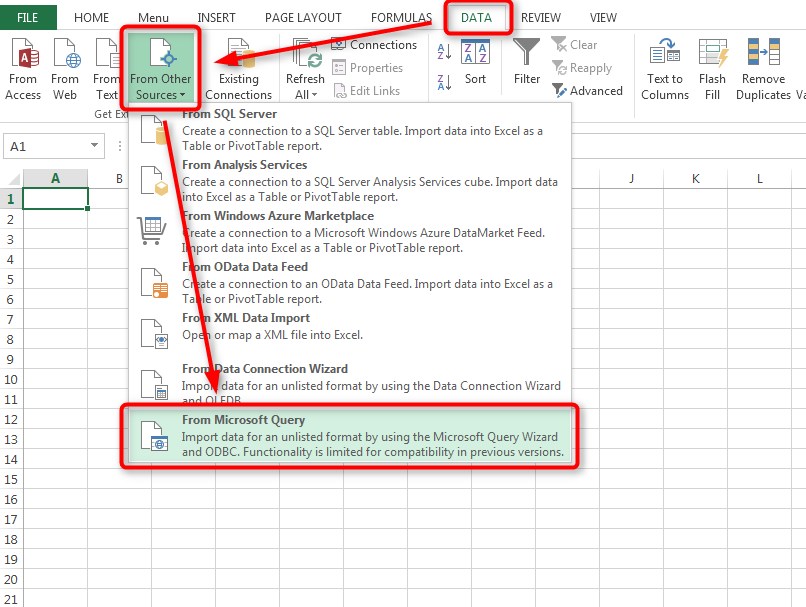
In Windows, open a new Excel workbook, then select Data > From Other Sources > From Microsoft Query.

-
On the Choose Data Source pop-up, select the Hortonworks ODBC data source you installed previously, then click OK.

-
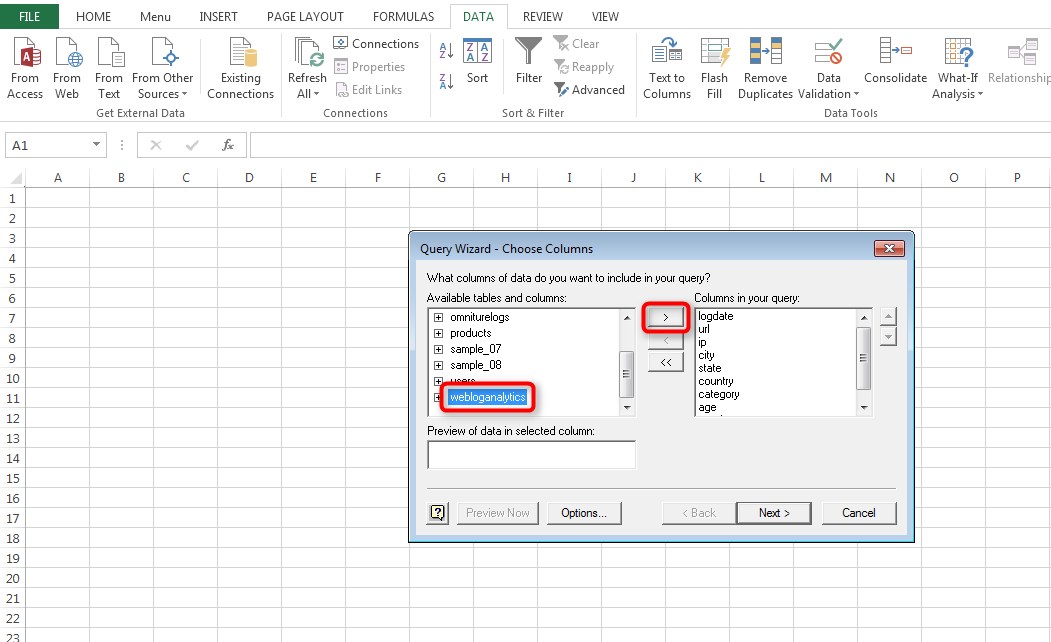
After the connection to the sandbox is established, the Query Wizard appears. Select the webloganalytics table in the Available tables and columns box, then click the right arrow button to add the entire webloganalytics table to the query. Click Next to continue.

-
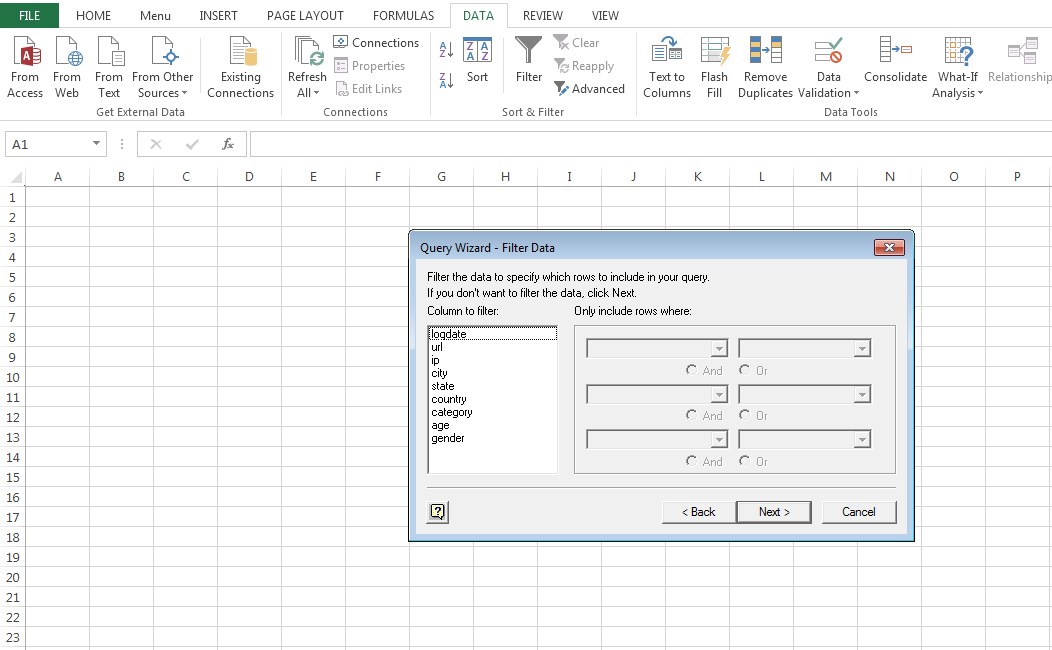
On the Filter Data screen, click Next to continue without filtering the data.

-
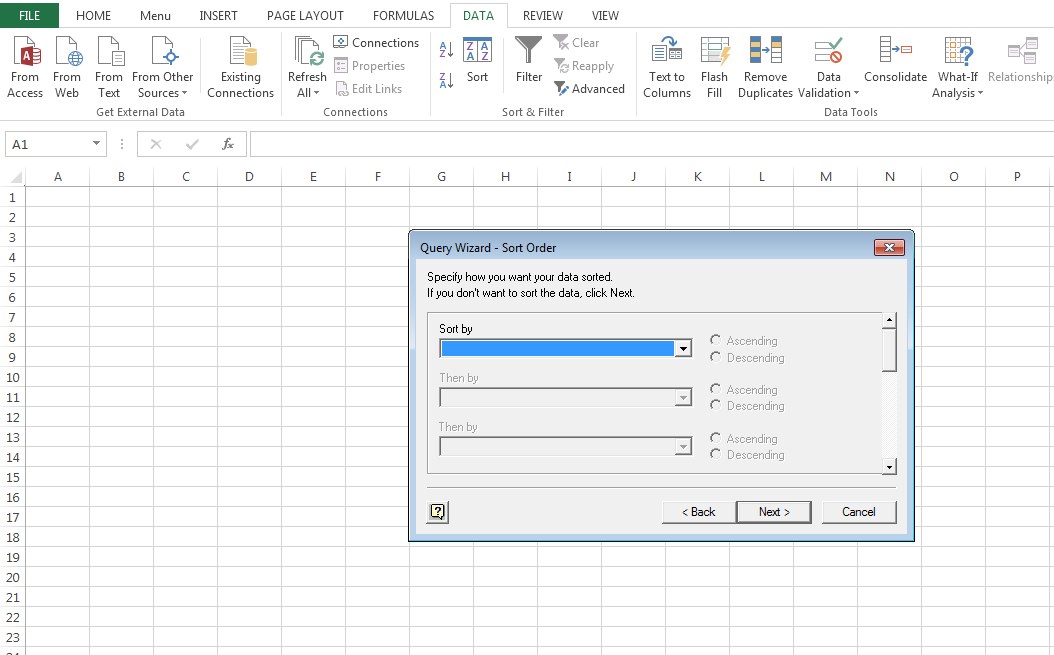
On the Sort Order screen, click Next to continue without setting a sort order.

-
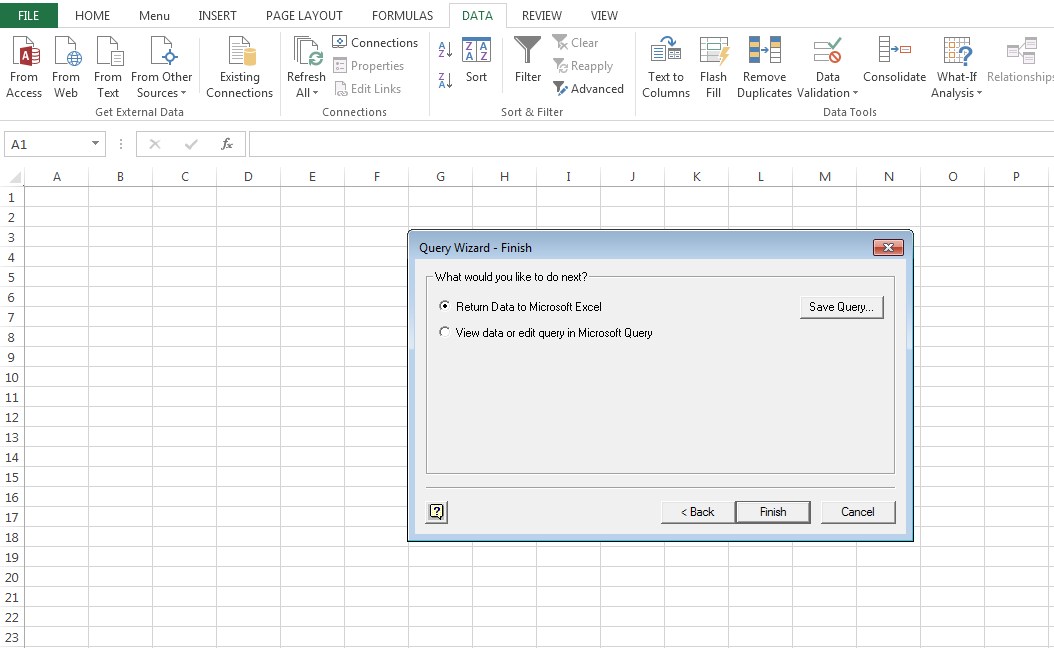
Click Finish on the Query Wizard Finish screen to retrieve the query data from the sandbox and import it into Excel.

-
On the Import Data dialog box, click OK to accept the default settings and import the data as a table.

-
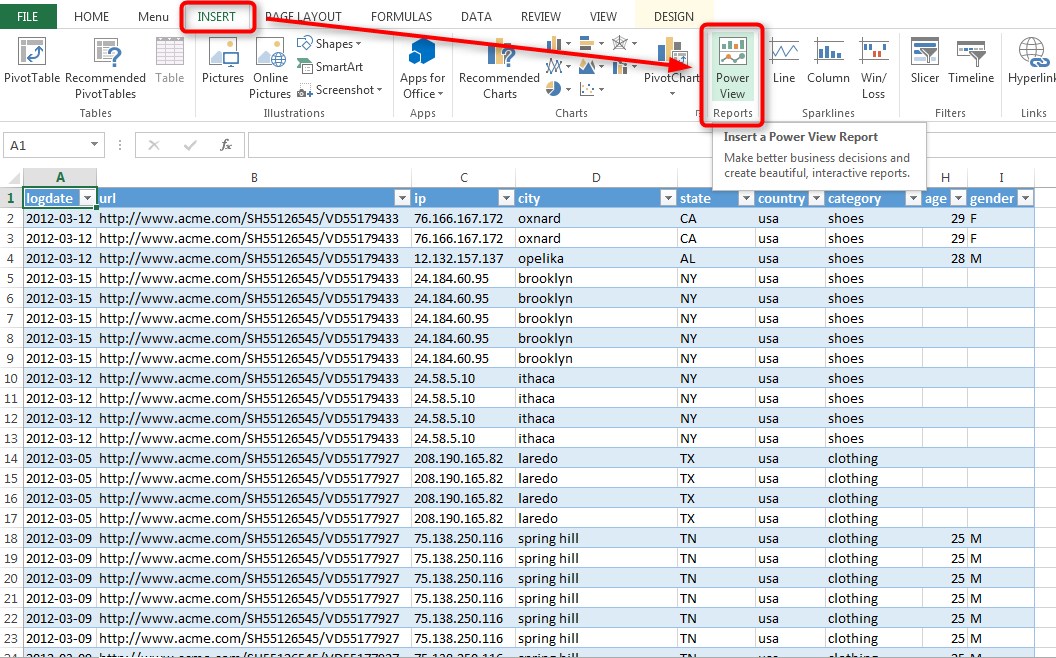
The imported query data appears in the Excel workbook.


Now that you have successfully imported sandbox data into Microsoft Excel, you can use the Excel Power View feature to analyze the data.
-
In the Excel workbook with the imported webloganalytics data, select Insert > Power View.

-
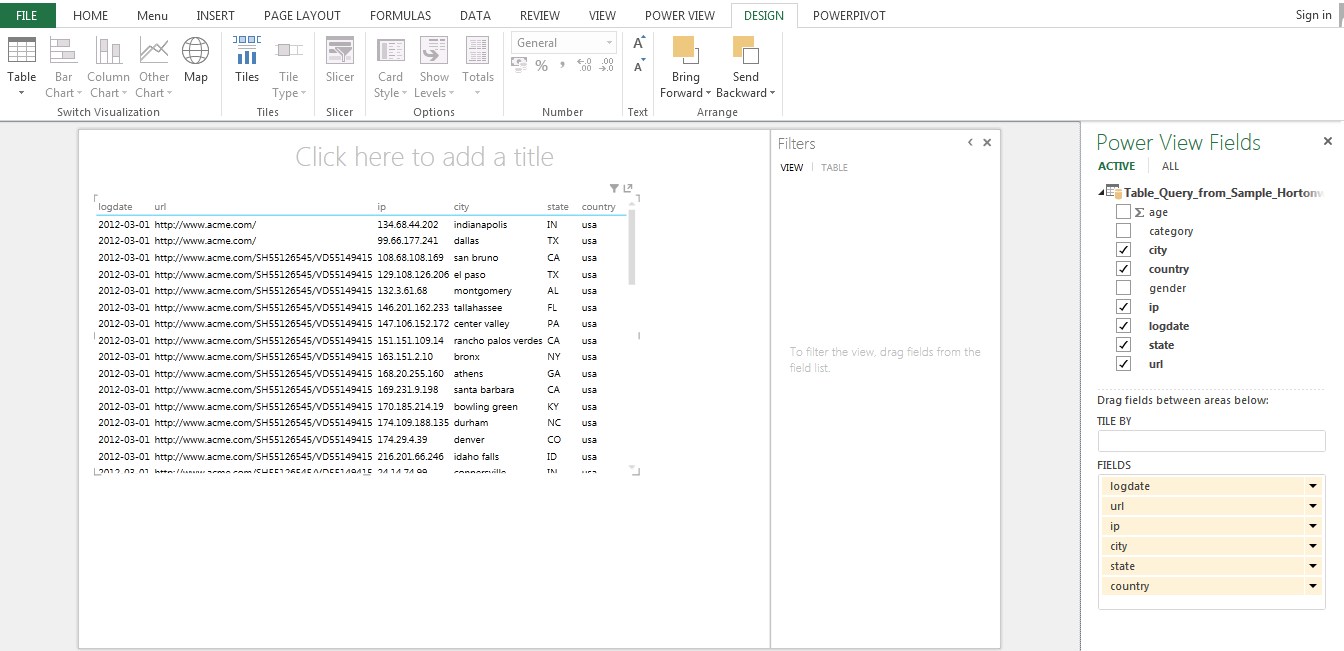
The Power View Fields area appears on the right side of the window, with the data table displayed on the left. Drag the handles to maximize the size of the data table, and close the Filters area.

-
Let’s start by taking a look at a count of IP address by country. In the Power View area, select the ip and country checkboxes, and clear all of the other checkboxes. The data table will update to reflect the selections.

-
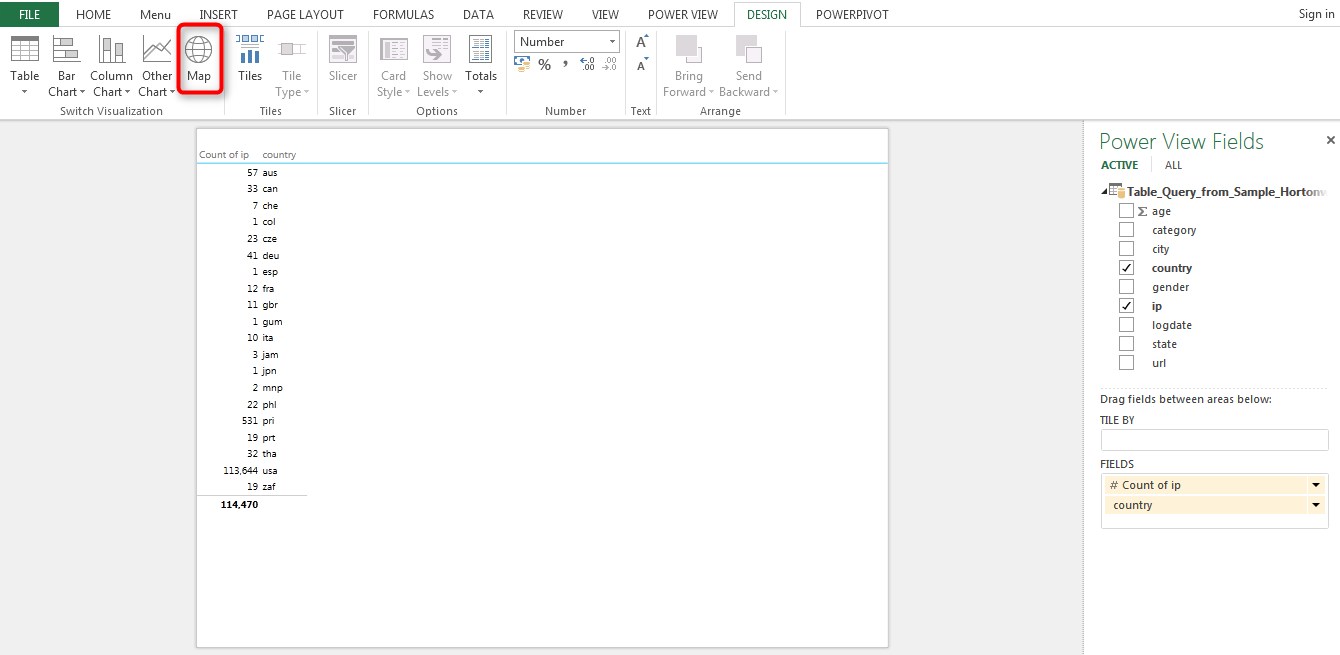
Under Fields, click the arrow next to ip, then select Count (Not Blank).

-
On the Design tab in the top menu, click Map.

-
The map view displays a global view of the data. To view the data by state, drag and drop the state field into the Locations box just above country.

-
Use the map controls to zoom in on the United States.

-
To display categories in the map by color, drag and drop the category field into the Color box.

-
The map displays the categories by color for each state. Move the pointer over each state to display detailed category information. In the image below, we see that the largest category in Florida is clothing.

-
Now let’s look at a count of IP address by age. In the top menu, click Power Viewto open a new Power View Report. In the Power View area, select the ip and age checkboxes, and clear all of the other checkboxes. Under Fields, click the arrow next to ip, then select Count (Not Blank).

-
Let’s display this data in a column chart. On the top menu, select Column Chart > Stacked Column.

-
From the data in the column chart, we can see that our target demographic is people who are between 20 and 30 years old.


Now that you have successfully accessed and analyzed Hortonworks sandbox data with Microsoft Excel, you can see how Excel and other BI tools can be used with the Hortonworks platform to derive insights about customers from various data sources.