Monitoring a containerized environment requires to:
- gather metrics from the monitored components
- store them in a database
- display them as dashboards
- define what is considered an alarm and when and where an alert should be sent
We'll show here how to implement it around Prometheus.
cadvisor provides Prometheus metrics about the Docker engine and Docker containers on the host.
$ docker run \
    --volume=/:/rootfs:ro \
    --volume=/var/run:/var/run:rw \
    --volume=/sys:/sys:ro \
    --volume=/var/lib/docker/:/var/lib/docker:ro \
    --volume=/dev/disk/:/dev/disk:ro \
    --detach=true \
    --network bridgenet \
    --publish 8080:8080 \
    --name=cadvisor google/cadvisor:v0.28.3
Check that metrics are served:
$ curl -s localhost:8080/metrics
# HELP cadvisor_version_info A metric with a constant '1' value labeled by kernel version, OS version, docker version, cadvisor version & cadvisor revision.
# TYPE cadvisor_version_info gauge
cadvisor_version_info{cadvisorRevision="1e567c2",cadvisorVersion="v0.28.3",dockerVersion="17.12.0-ce",kernelVersion="4.9.60-linuxkit-aufs",osVersion="Alpine Linux v3.4"} 1
# HELP container_cpu_load_average_10s Value of container cpu load average over the last 10 seconds.
# TYPE container_cpu_load_average_10s gauge
container_cpu_load_average_10s{container_label_maintainer="",id="/",image="",name=""} 0
container_cpu_load_average_10s{container_label_maintainer="",id="/docker",image="",name=""} 0
container_cpu_load_average_10s{container_label_maintainer="",id="/docker/aa9e743443cc4bc4a63d8eb4b7ff440a0629acfe81196e3c11bcb44f1b3bba8a",image="google/cadvisor:v0.28.3",name="cadvisor"} 0
container_cpu_load_average_10s{container_label_maintainer="The Prometheus Authors <prometheus-developers@googlegroups.com>",id="/docker/da164da4d08271c03d8e2dc40813f715cfd4c787f90123f614b93ce2d200c452",image="prom/prometheus:v2.0.0",name="metrics"} 0
# HELP container_cpu_system_seconds_total Cumulative system cpu time consumed in seconds.
...
Metrics from the host can also be useful, they can be provided by node-exporter:
$ docker run --network bridgenet \
    --name=system \
    --detach=true \
    --volume=/proc:/host/proc:ro \
    --volume=/sys:/host/sys:ro \
    --volume=/:/rootfs \
    --volume=/var/run/docker.sock:/var/run/docker.sock:ro \
    --publish 9100:9100 \
    prom/node-exporter:v0.15.2 \
    --path.procfs /host/proc --path.sysfs /host/sys --collector.filesystem.ignored-mount-points '^/(sys|proc|dev|host|etc|var|rootfs/var/lib/docker|rootfs/run/docker/netns|rootfs/sys/kernel/debug)($$|/)'
Check that metrics are served:
$ curl -s localhost:9100/metrics | grep node_load
# HELP node_load1 1m load average.
# TYPE node_load1 gauge
node_load1 0
# HELP node_load15 15m load average.
# TYPE node_load15 gauge
node_load15 0
# HELP node_load5 5m load average.
# TYPE node_load5 gauge
node_load5 0
$ docker run \
    --detach=true \
    -v $PWD/prometheus.yml:/etc/prometheus/prometheus.yml \
    --name metrics \
    --network bridgenet \
    --publish 9090:9090 \
    prom/prometheus:v2.0.0
Now we have these 3 containers for monitoring:
$ docker ps
CONTAINER ID        IMAGE                        COMMAND                  CREATED                  STATUS              PORTS                    NAMES
f45c6063753d        prom/node-exporter:v0.15.2   "/bin/node_exporter …"   Less than a second ago   Up 3 seconds        0.0.0.0:9100->9100/tcp   system
da164da4d082        prom/prometheus:v2.0.0       "/bin/prometheus --c…"   2 hours ago              Up 2 hours          0.0.0.0:9090->9090/tcp   metrics
aa9e743443cc        google/cadvisor:v0.28.3      "/usr/bin/cadvisor -…"   2 hours ago              Up 2 hours          0.0.0.0:8080->8080/tcp   cadvisor
Open Prometheus in your browser: localhost:9090.
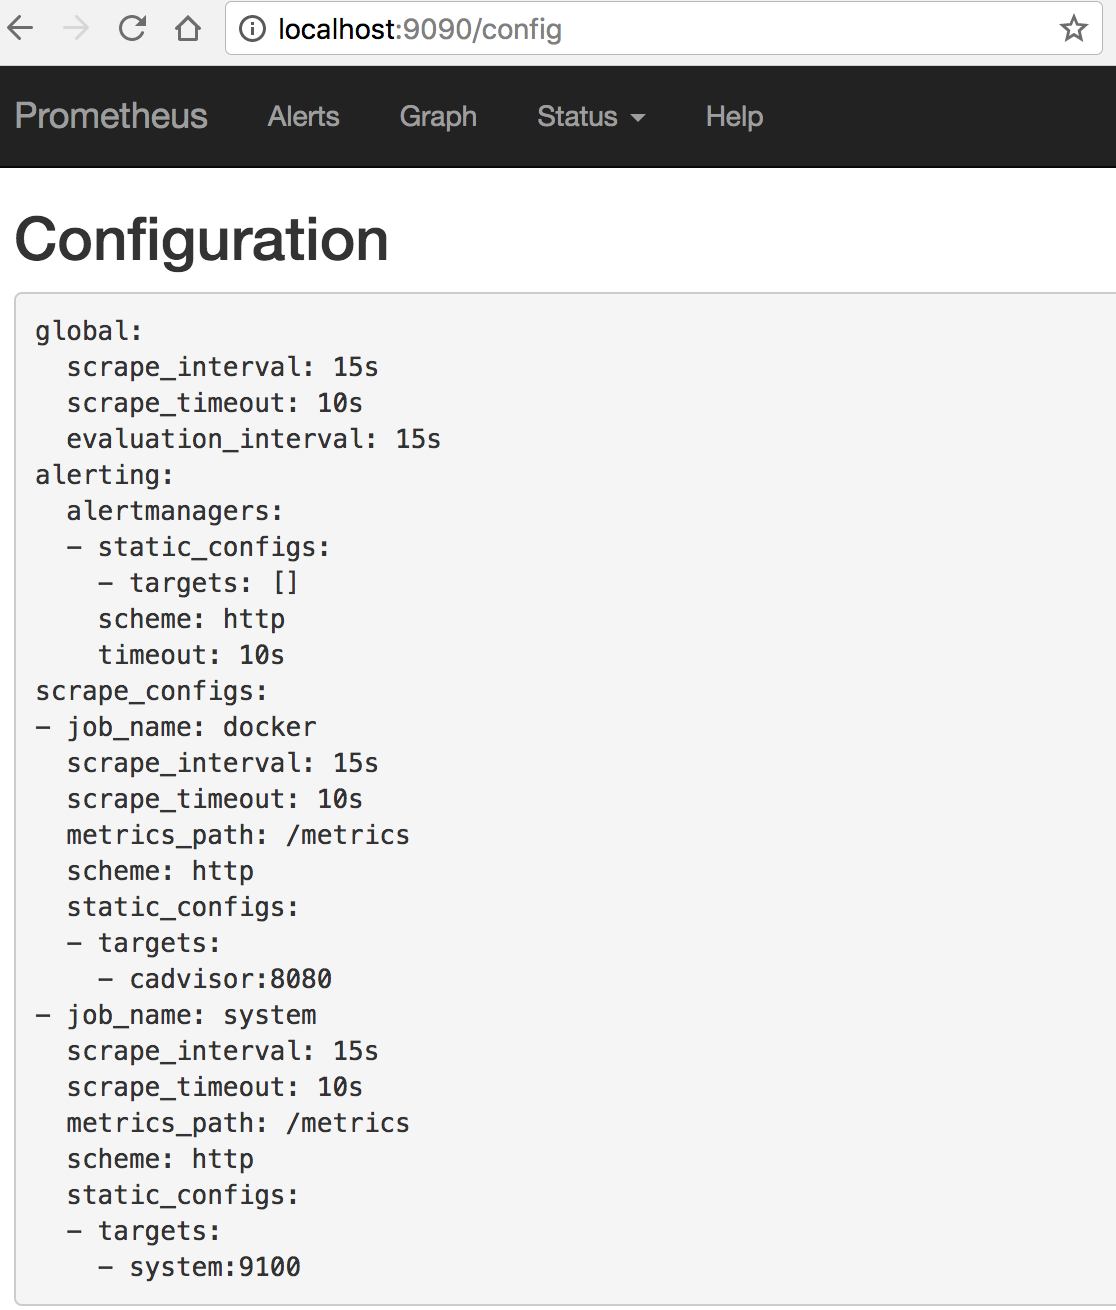
Now you can check that the configuration has been read:
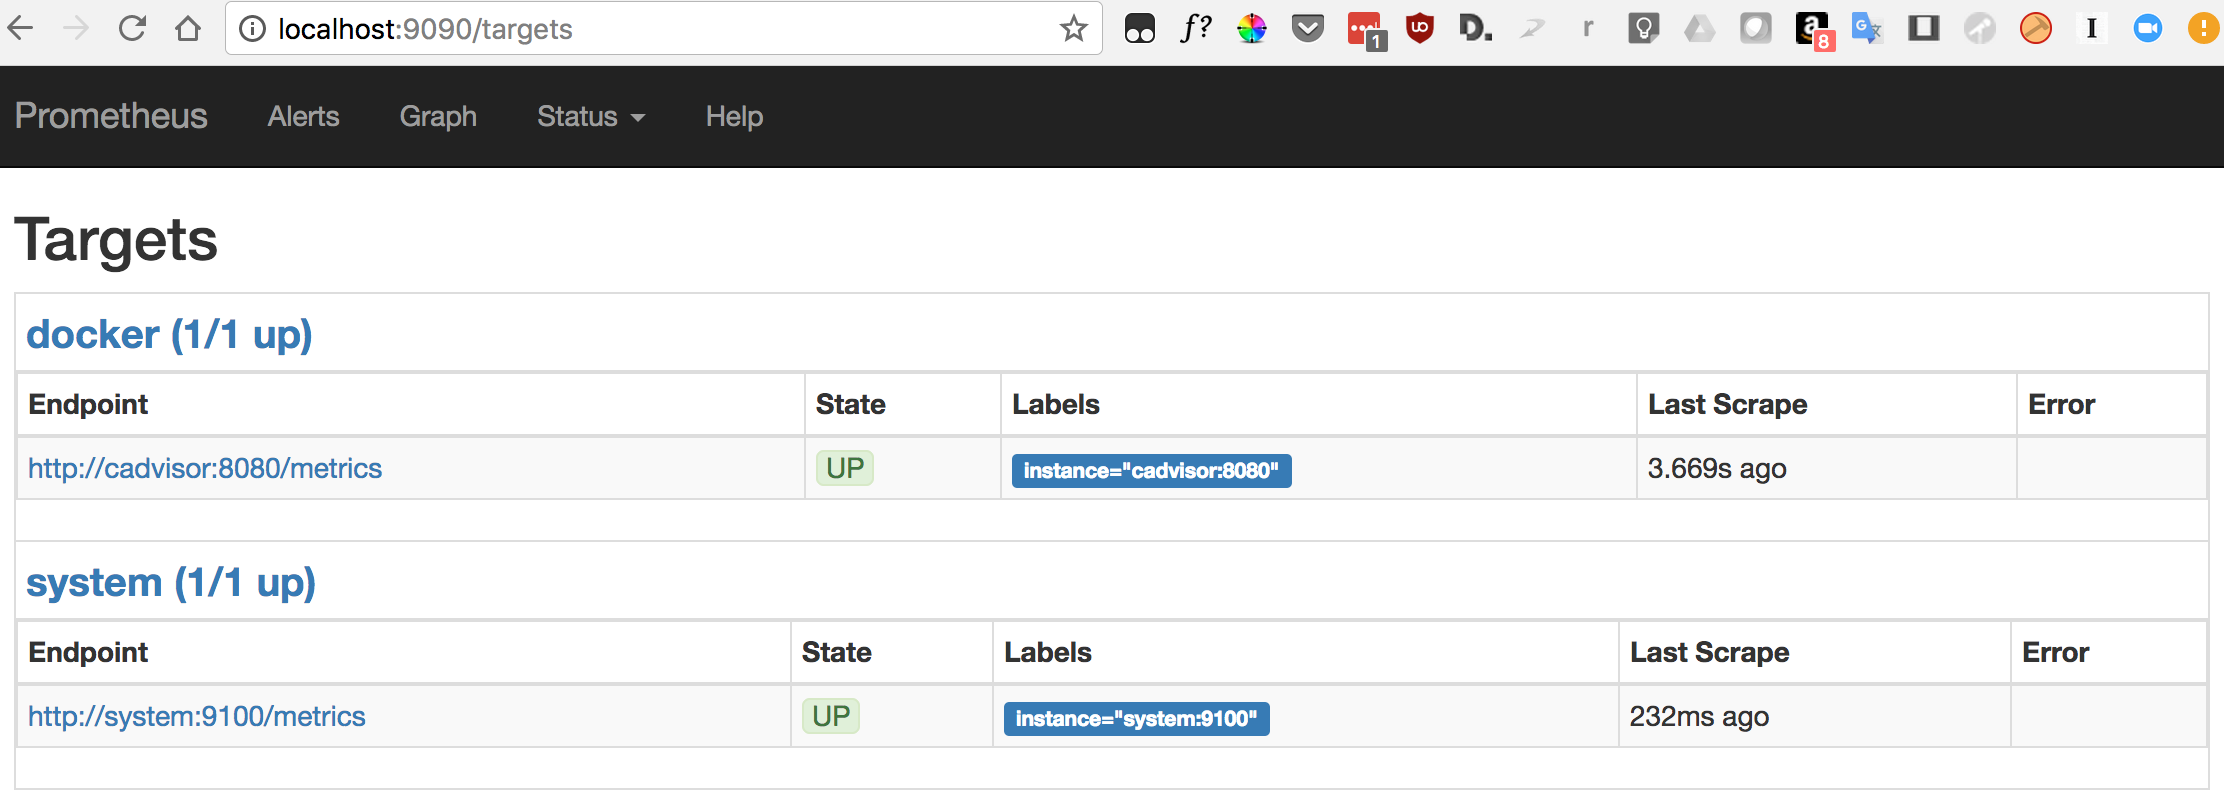
And check that the target are up:
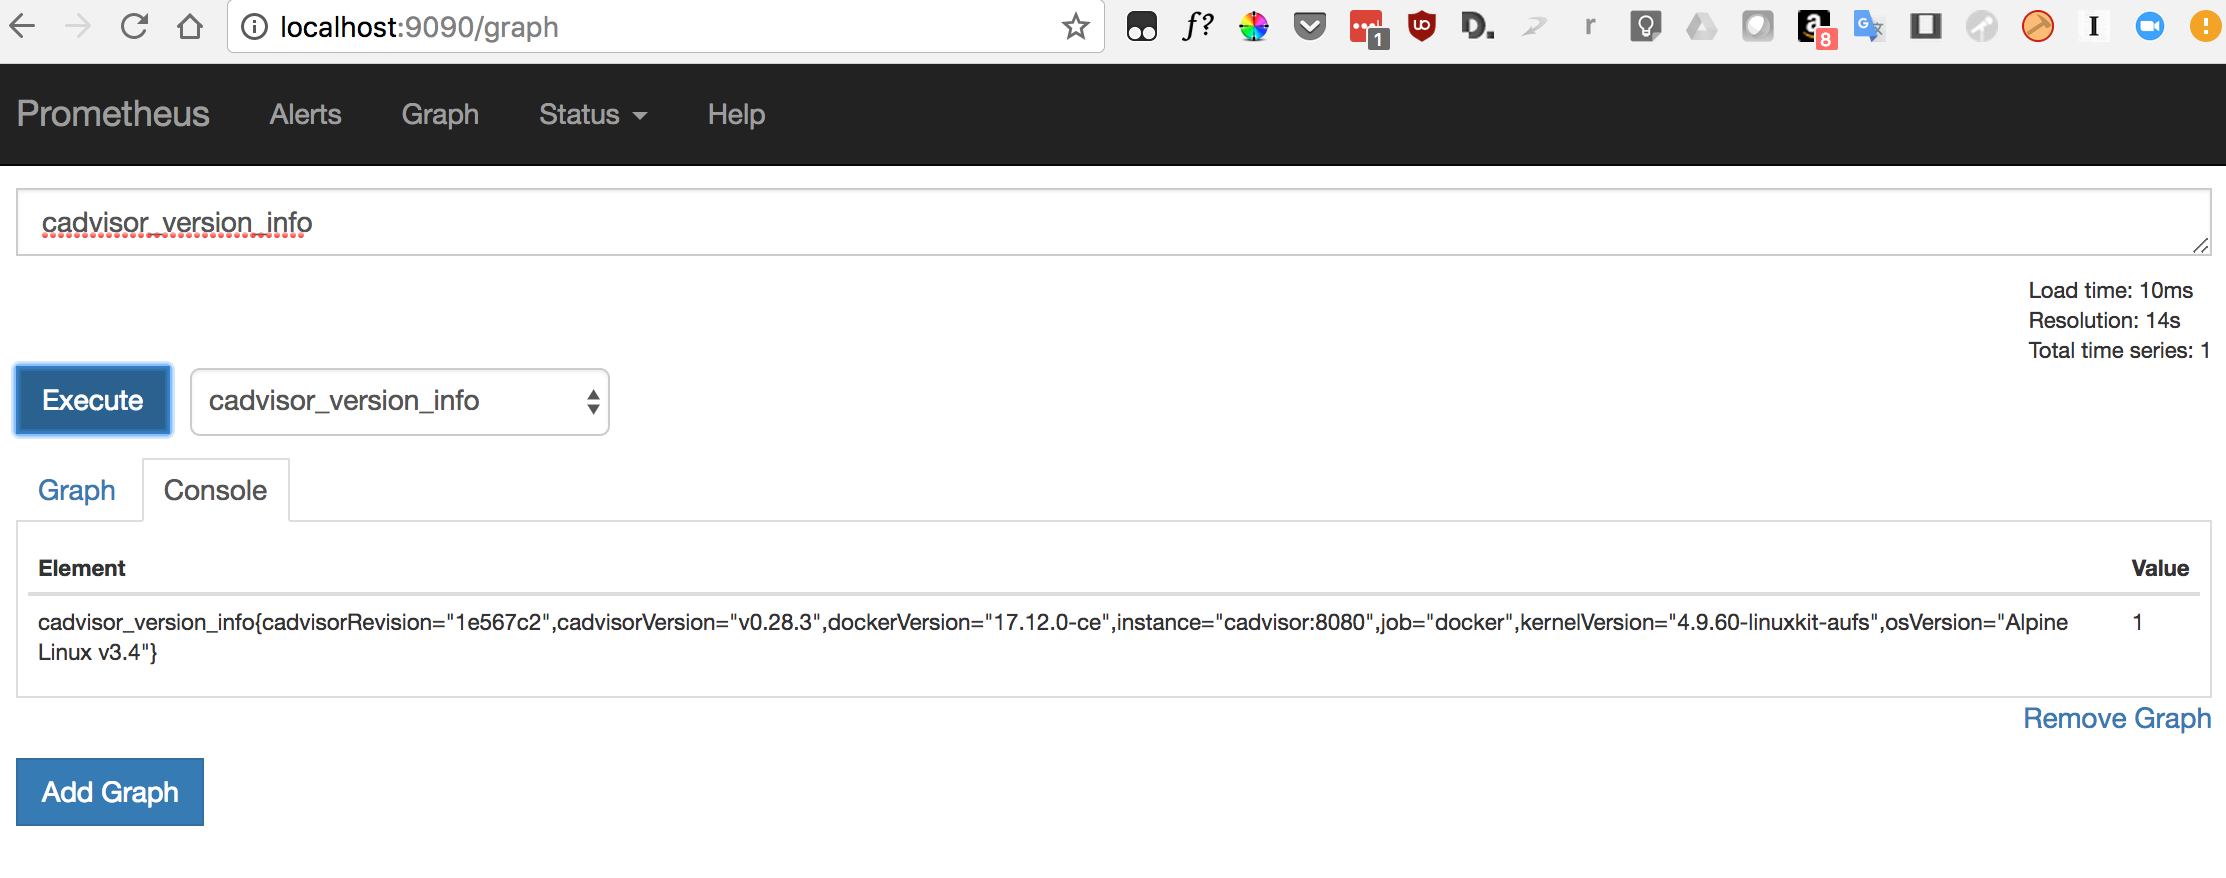
Prometheus has a UI to consult the data, it's good enough to list what's available and to help debugging issues, but it's probably not what you'd like to use for a monitoring tool.
Instead, we can build dashboards in Grafana using the Prometheus datasource.
$ docker run \
    --detach=true \
    --publish 80:3000 \
    --network bridgenet \
    --name dashboard \
    grafana/grafana:4.6.3
Open Grafana in your browser: localhost:80.
Adding metrics to your application will help building an efficient alerting. Have a look at the official documentation.


