- Requirements
- Install Grafana
- Install TDengine Data Source Plugin
- Configure Grafana
- Start Grafana Service
- Login to Grafana
- Add TDengine Data Source
- Import TDengine Dashboard
- The Dashboard Details
- An all-in-one docker example
At least, you must have a single-node TDengine server or a TDengine cluster with multiple nodes, and a server host for Grafana.
The feature-rich Grafana dashboard for TDengine (cluster or not) requires Grafana 7.x, so we recommend to use the latest Grafana 7.x version here. You can install Grafana in any supported OS, follow the installation instructions.
For Debian or Ubuntu os, the first option is to use grafana APT repository. Here is how-to install it from scratch:
sudo apt-get install -y apt-transport-https
sudo apt-get install -y software-properties-common wget
wget -q -O - https://packages.grafana.com/gpg.key |\
  sudo apt-key add -
echo "deb https://packages.grafana.com/oss/deb stable main" |\
  sudo tee -a /etc/apt/sources.list.d/grafana.list
sudo apt-get update
sudo apt-get install grafanaYou can install it from the official YUM repository.
sudo tee /etc/yum.repos.d/grafana.repo << EOF
[grafana]
name=grafana
baseurl=https://packages.grafana.com/oss/rpm
repo_gpgcheck=1
enabled=1
gpgcheck=1
gpgkey=https://packages.grafana.com/gpg.key
sslverify=1
sslcacert=/etc/pki/tls/certs/ca-bundle.crt
EOF
sudo yum install grafana
Or install with RPM:
wget https://dl.grafana.com/oss/release/grafana-7.5.11-1.x86_64.rpm
sudo yum install grafana-7.5.11-1.x86_64.rpm
# it's ok to use in one line
sudo yum install \
  https://dl.grafana.com/oss/release/grafana-7.5.11-1.x86_64.rpm
Install the TDengine data-source plugin from GitHub.
git clone --depth 1 https://github.com/taosdata/grafanaplugin.git
mkdir -p /var/lib/grafana/plugins/tdengine
cp -rf dist/* /var/lib/grafana/plugins/tdengineAdd following lines to /etc/grafana/grafana.ini.
[plugins]
allow_loading_unsigned_plugins = truesystemctl enable grafana-server
systemctl start grafana-serverOpen the default grafana url: http://localhost:3000 in your web browser.
The default username/password is bot admin.
Grafana would ask you to change the password after first login.
Point to Configurations -> Data Sources menu and then Add data source button.

Search and choose TDengine.

Configure TDengine data source.

Save and test it, it should say 'TDengine Data source is working'.

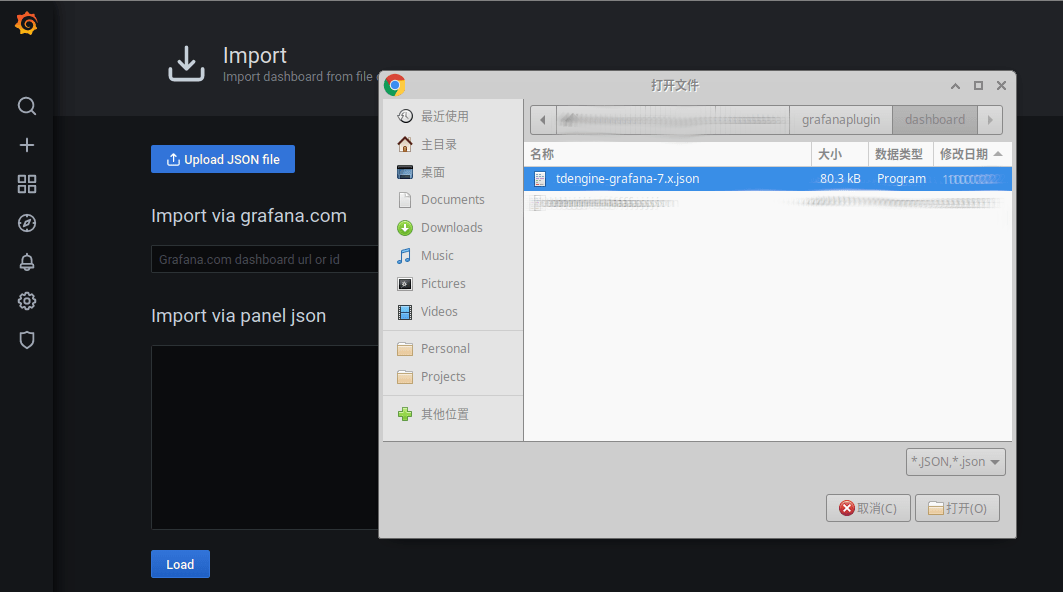
Point to + / Create - import (or /assets/import url).

Click on Upload .JSON file menu, point to your
assets/tdengine-grafana-7.x.json file in grafanaplugin directory(downloaded with git previously) and load it.
Change the options if you need, and Import it.
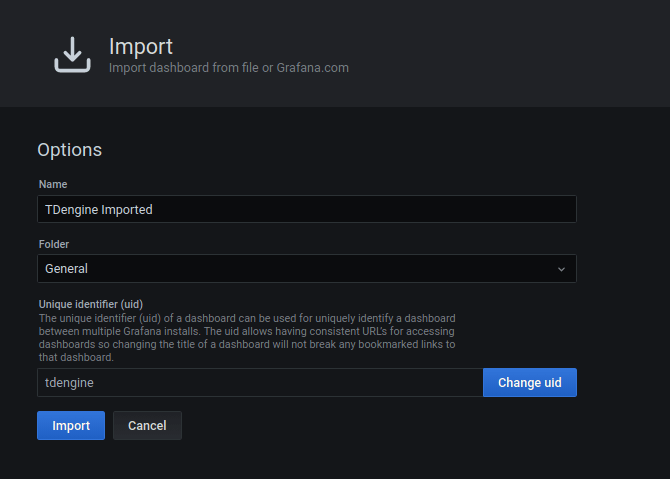
Then it's all done.
The full page view for TDengine will like below.
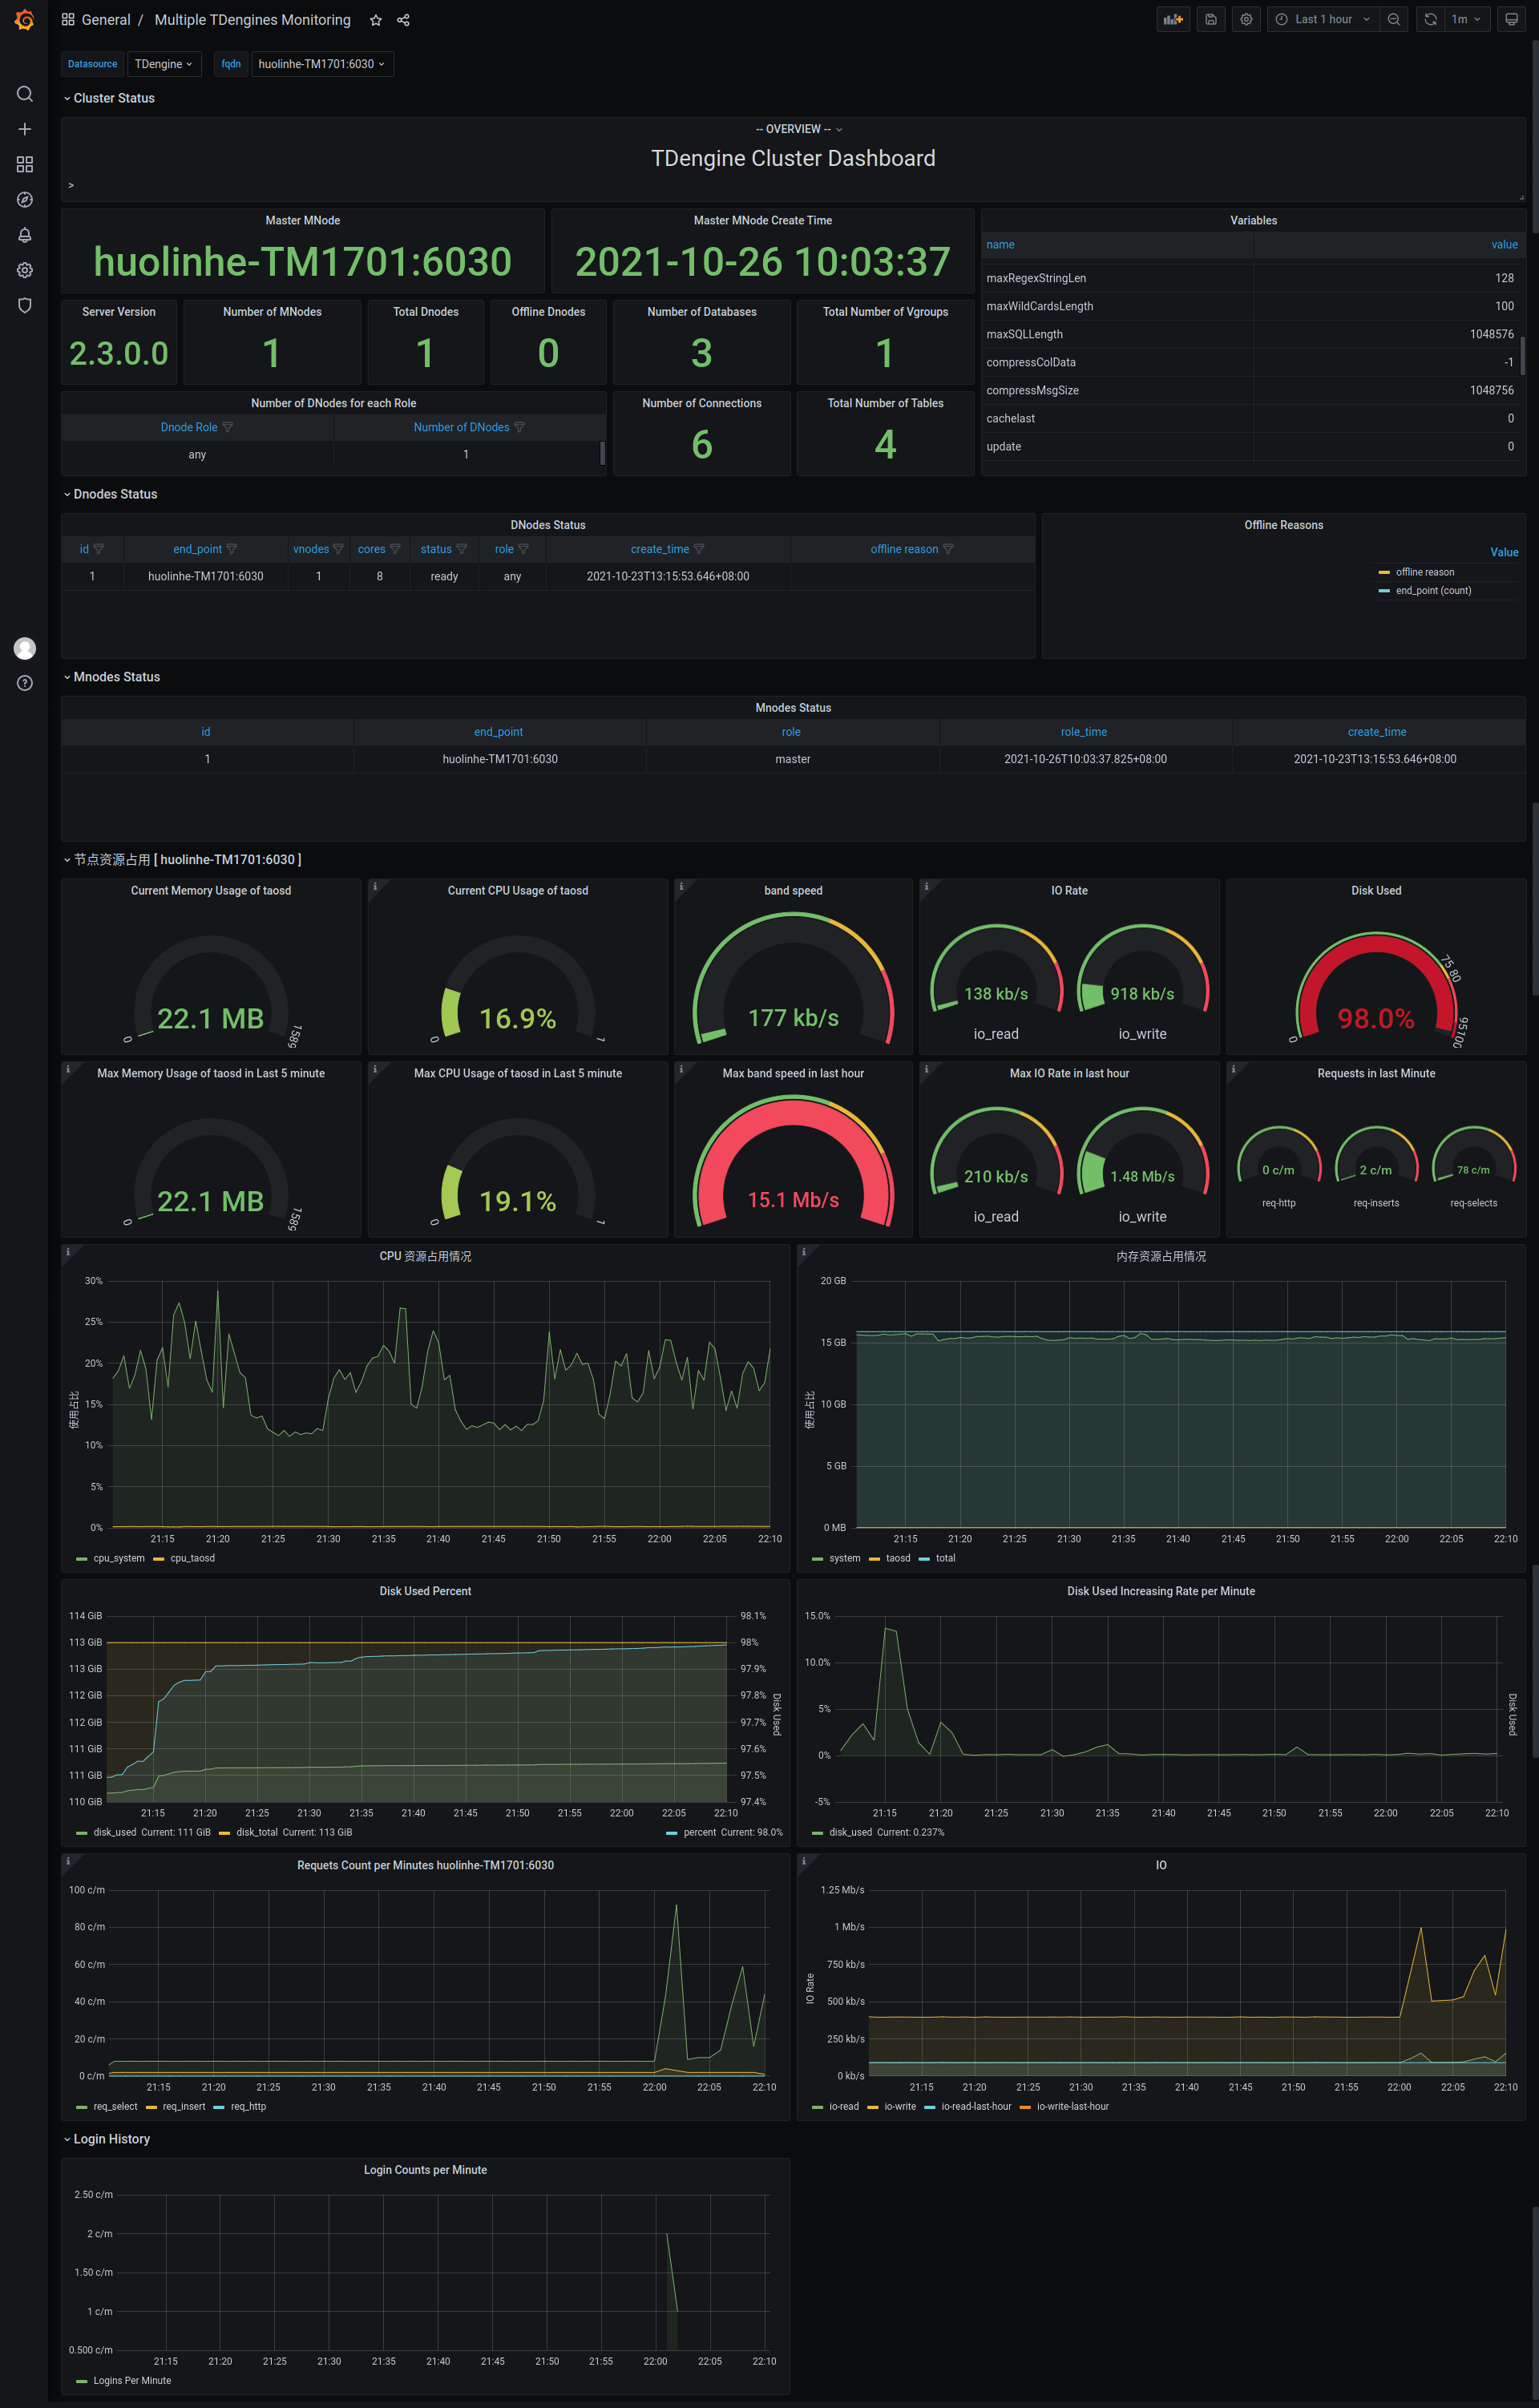
Include cluster current information and status (left-to-right).
- Master MNode: the current master mnode displayed as text(with grafana
Statview). - Master MNode Create Time: time that the current master mnode created.
- Variables: generated by
show variablescommand and displayed as Table view. - Server Version:
select server_version()result. - Client version:
select client_version()result. - Number of MNodes: number count from
show mnodesresults. - Number of Databases: number count from
show databasesresults. - Total Number of VGroups: total number of vgroups summarized by each vgroups number of all databases.
- Number of DNodes for each Role: number summary group by dnode roles as a simple table view.
- Total Dnodes: number of
show dnodes. - Number of Connections: number count from
show connectionsresults. - Total Number of Tables: sum of table count of all databases.
- Offline Dnodes: number count from the
show dnodesresults with a filterstatus != 'ready'.
- DNodes Status: Simple table view for
show dnodes. - Offline Reasons: offline reasons pie chart if any dnode status is offline.
Simple table view for show mnodes.
DNode resources details for specific node with grafana query type variable $fqdn (from select tbname from log.dn).
Consist with:
- Current memory usage, cpu usage, band speed, io read and write rate, disk used, etc.
- Max resources usage in last hour or some time.
- CPU graph view.
- Memory usage.
- Disk used percent: graph view with alert rule.
- Disk used.
- Requests count per minute.
- IO rate (read/write), with comparison to that in last hour.
Currently only report login count per minute.
git clone --depth 1 https://github.com/taosdata/grafanaplugin.git
cd grafanaplugin
Modify as needed in the docker-compose.yml file:
version: "3.7"

services:
  grafana:
    image: grafana/grafana:7.5.10
    volumes:
      - ./dist:/var/lib/grafana/plugins/tdengine
      - ./grafana/:/etc/grafana/
      - grafana-data:/var/lib/grafana
    ports:
      - 3000:3000

volumes:
  grafana-data:
Start Grafana with docker-compose.
docker-compose up -dNow you can continue to import TDengine dashboard from login step.