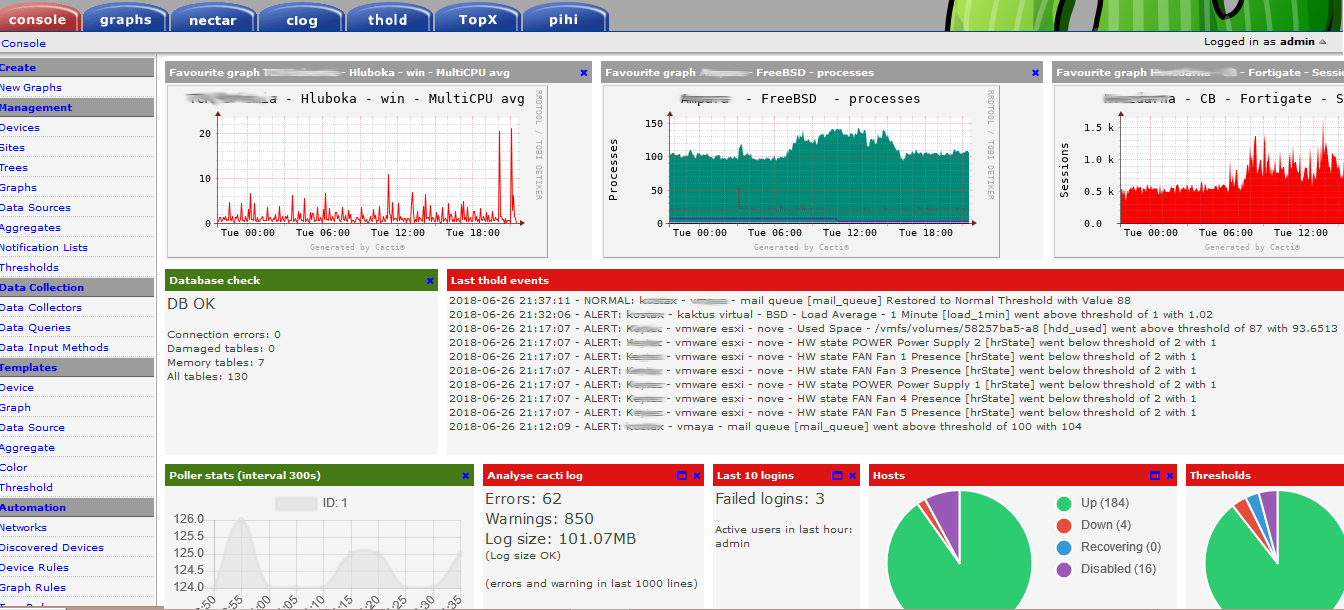
Plugin displays usefull information and favourite graphs on console screen or separated tab:
- trends
- host graph (total, down, ...)
- poller statistics
- thresholds (all, trigged, ...)
- logs analyze
- worst ping and availability
- ...
All thanks goes to Petr Macek (petr.macek@kostax.cz) the original author of Intropage! He has turned over the Intropage Plguin to the broader Cacti community for long term management. We would like to thank him for all his contributions past, present and future.
- Copy directory intropage to plugins directory
- Check file permission (Linux/unix - readable for www server)
- Enable plugin (Console > Configuration > Plugins)
- Configure Plugin (Console > Configuration > Settings > Intropage Tab)
- Add Panel Permissions to user accounts (Console > Users > (edit) > Intropage>
- TGZ old intropage directory for recovery
- Remove old directory
- Recreate directory with new files
- Check file permission (Linux/unix - readable for www server)
- Configure Intropage (Console > Settings > Intropage tab)
Console > Configuration > Users > Intropage option to provide permissions to Panels Settings > Intropage (admin)
On Intropage/Console page add new Dashboard Panels as they become available. The panels will not start rendering until at least one user has access to a Panel.
Go to graphs, select graph, click to icon Eye. Graphs will be rendered in SVG format only.
Intropage provides a 'panellib' directory where you can create new panels. You simply need to copy one of the existing directories to a new file name, and then ensure that you use 'unique' panel id's and create away. Each panel library file will have a registration function where you define what panels are included in the file and how they gather their data.
If you find a problem, let me know via github or https://forums.cacti.net/viewtopic.php?f=5&t=51920
Tomas Macek, Peter Michael Calum, Trevor Leadley, Earendil
