
launch.json配置如上,来源是example,只设置结构体成员type、name、request时,其他成员为默认状态无需更改
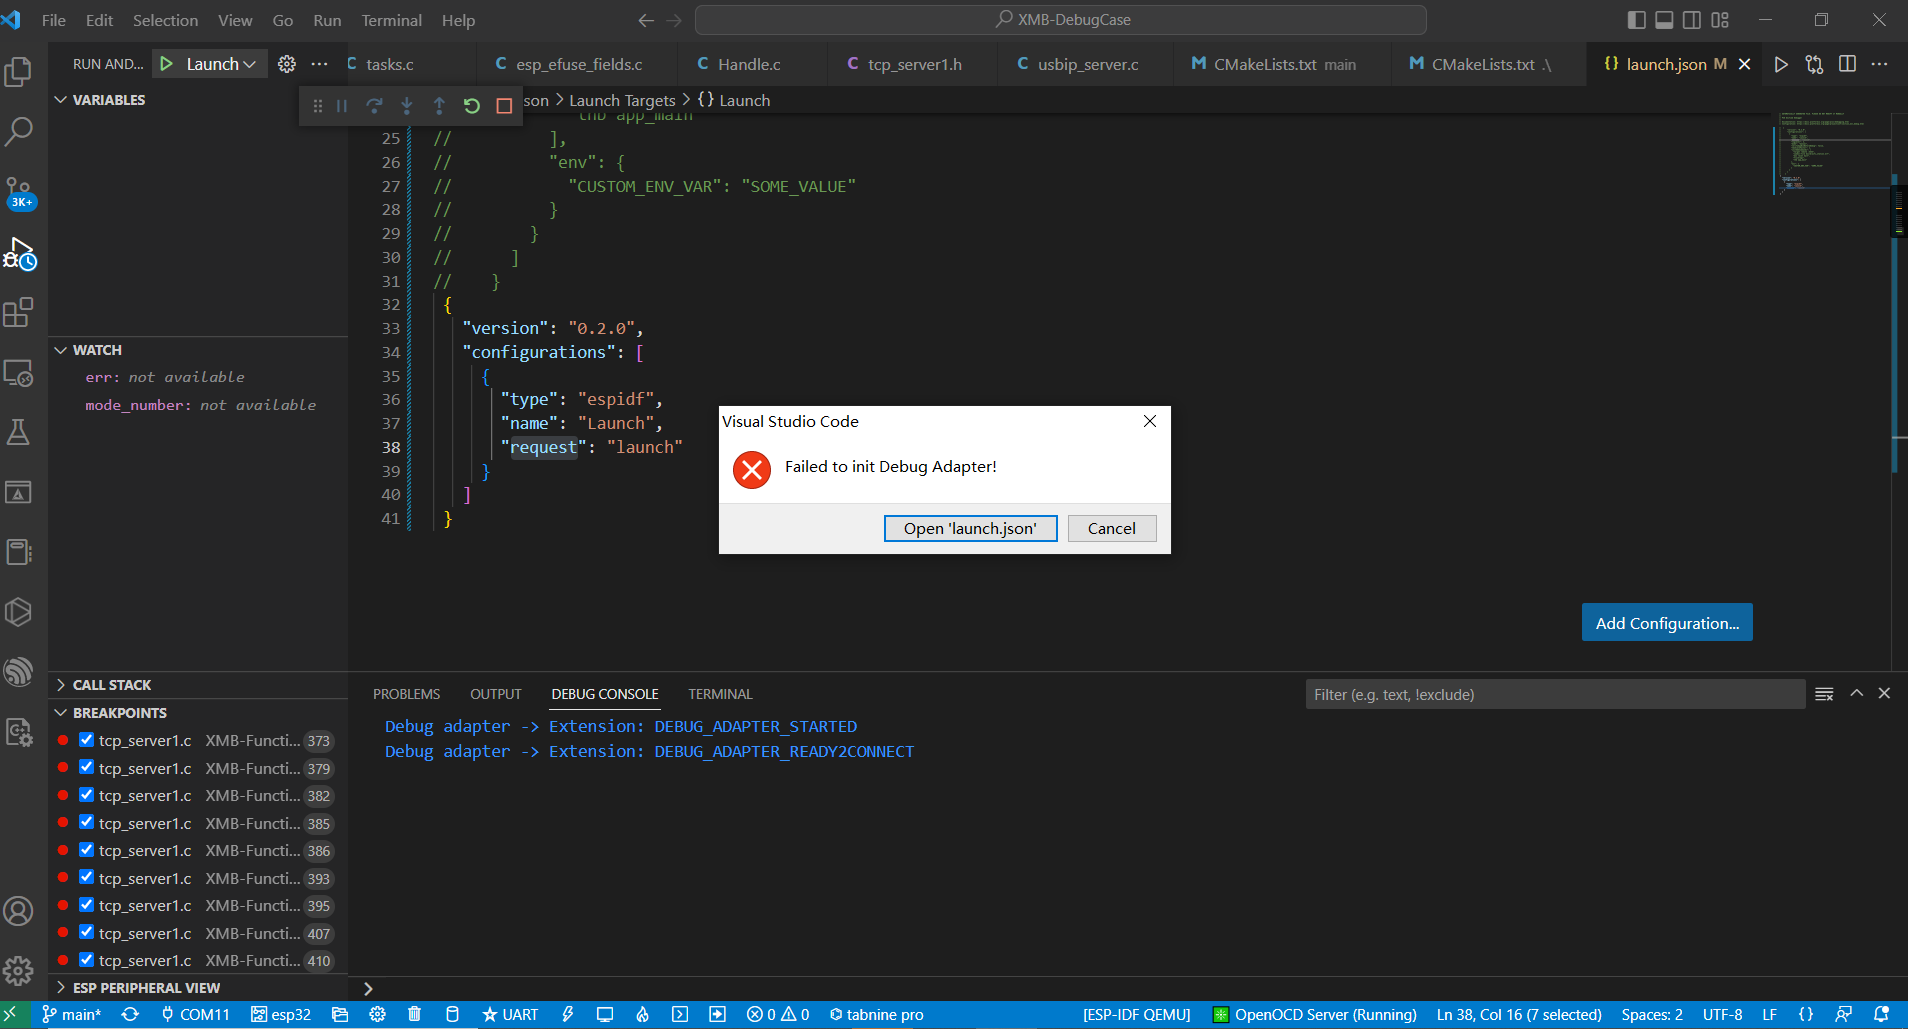
出现上述报错时,点击取消后再次尝试。一般第二次尝试则会正常
其全部output如下:
[OpenOCD]
Open On-Chip Debugger v0.11.0-esp32-20221026 (2022-10-26-14:48)
Licensed under GNU GPL v2
For bug reports, read
	http://openocd.org/doc/doxygen/bugs.html
[OpenOCD]
debug_level: 2

[OpenOCD]
adapter speed: 20000 kHz

[OpenOCD]
Info : Listening on port 6666 for tcl connections
[OpenOCD]
Info : Listening on port 4444 for telnet connections
[OpenOCD]
❌ Error: libusb_open() failed with LIBUSB_ERROR_NOT_SUPPORTED
[OpenOCD]
Info : ftdi: if you experience problems at higher adapter clocks, try the command "ftdi tdo_sample_edge falling"
Info : clock speed 20000 kHz
Info : JTAG tap: esp32.cpu0 tap/device found: 0x120034e5 (mfg: 0x272 (Tensilica), part: 0x2003, ver: 0x1)
Info : JTAG tap: esp32.cpu1 tap/device found: 0x120034e5 (mfg: 0x272 (Tensilica), part: 0x2003, ver: 0x1)
Info : starting gdb server for esp32.cpu0 on 3333
Info : Listening on port 3333 for gdb connections
[OpenOCD]
Info : [esp32.cpu0] Debug controller was reset.
[OpenOCD]
Info : [esp32.cpu0] Core was reset.
[OpenOCD]
Info : [esp32.cpu1] Debug controller was res[OpenOCD]
et.
Info : [esp32.cpu1] Core was reset.
[OpenOCD]
Info : [esp32.cpu0] Target halted, PC=0x40162BA4, debug_reason=00000000
[OpenOCD]
Info : [esp32.cpu0] [OpenOCD]
Reset cause (12) - (Software CPU0 reset)
[Debug Adapter]
DEBUG_ADAPTER_STARTED
2023-01-11 19:08:01,617 - Debug Adapter (main) - CRITICAL - Debug adapter -> Extension: DEBUG_ADAPTER_STARTED
[Debug Adapter]
DEBUG_ADAPTER_READY2CONNECT
2023-01-11 19:08:01,622 - Debug Adapter (main) - CRITICAL - Debug adapter -> Extension: DEBUG_ADAPTER_READY2CONNECT
[OpenOCD]
Info : [esp32.cpu1] Target halted, PC=0x40162BA4, debug_reason=00000000
Info : [esp32.cpu1] Reset cause (12) - (Software CPU1 reset)
[Debug Adapter]
DEBUG_ADAPTER_STOPPED
2023-01-11 19:08:06,916 - Debug Adapter (main) - CRITICAL - Debug adapter -> Extension: DEBUG_ADAPTER_STOPPED
[Stopped] : ESP-IDF Debug Adapter
[Debug Adapter]
DEBUG_ADAPTER_STARTED
2023-01-11 19:09:57,795 - Debug Adapter (main) - CRITICAL - Debug adapter -> Extension: DEBUG_ADAPTER_STARTED
[Debug Adapter]
DEBUG_ADAPTER_READY2CONNECT
2023-01-11 19:09:57,799 - Debug Adapter (main) - CRITICAL - Debug adapter -> Extension: DEBUG_ADAPTER_READY2CONNECT
[Debug Adapter]
DEBUG_ADAPTER_STOPPED
2023-01-11 19:10:03,075 - Debug Adapter (main) - CRITICAL - Debug adapter -> Extension: DEBUG_ADAPTER_STOPPED
[Stopped] : ESP-IDF Debug Adapter
[Debug Adapter]
DEBUG_ADAPTER_STARTED
2023-01-11 19:10:07,256 - Debug Adapter (main) - CRITICAL - Debug adapter -> Extension: DEBUG_ADAPTER_STARTED
[Debug Adapter]
DEBUG_ADAPTER_READY2CONNECT
2023-01-11 19:10:07,260 - Debug Adapter (main) - CRITICAL - Debug adapter -> Extension: DEBUG_ADAPTER_READY2CONNECT
[OpenOCD]
Info : accepting 'gdb' connection on tcp/3333
[OpenOCD]
Info : [esp32.cpu0] Target halted, PC=0x40162BA4,[OpenOCD]
 debug_reason=00000000
[OpenOCD]
Info : Set GDB target to 'esp32.cpu0'
[OpenOCD]
Info : [esp32.cpu1] Target halted, PC=0x40162BA4, debug_reason=00000000
[OpenOCD]
Warn : No symbols for FreeRTOS!
[OpenOCD]
Info : [esp32.cpu0] Target halted, PC=0x40092612, debug_reason=00000001
[OpenOCD]
Info : Flash mapping 0: 0x10020 -> 0x3f400020, 90 KB
Info : Flash mapping 1: 0x3[OpenOCD]
0020 -> 0x400d0020, 616 KB
[OpenOCD]
Info : [esp32.cpu0] Target halted, PC=0x40092612, debug_reason=00000001
[OpenOCD]
Info : Auto-detected flash bank 'esp32.cpu0.flash' size 4096 KB
Info : Using flash bank 'esp32.cpu0.flash' size 4096 KB
[OpenOCD]
Info : [esp32.cpu0] Target halted, PC=0x40092612, debug_reason=00000001
[OpenOCD]
Info : Flash mapping 0: 0x10020 -> 0x3f400020, 90 KB
Info : Flash mapping 1: 0x30020 -> 0x4[OpenOCD]
00d0020, 616 KB
Info : Using flash bank 'esp32.cpu0.irom' size 620 KB
[OpenOCD]
Info : [esp32.cpu0] Target halted, PC=0x40092612, debug_reason=00000001
[OpenOCD]
Info : Flash mapping 0: 0x10020 -> 0x3f400020, 90 KB
Info : Flash mapping 1: 0x300[OpenOCD]
20 -> 0x400d0020, 616 KB
Info : Using flash bank 'esp32.cpu0.drom' size 92 KB
Info : New GDB Connection: 1, Target esp32.cpu0, state: halted
[OpenOCD]
Warn : Prefer GDB command "target extended-remot[OpenOCD]
e :3333" instead of "target remote :3333"
[OpenOCD]
Info : JTAG tap: esp32.cpu0 tap/device found: 0x120034e5 (mfg: 0x272 (Tensilica), part: 0x2003, ver: 0x1)
Info : JTAG tap: esp32.cpu1 tap/device found: 0[OpenOCD]
x120034e5 (mfg: 0x272 (Tensilica), part: 0x2003, ver: 0x1)
[OpenOCD]
Info : [esp32.cpu0] requesting target halt and executing a soft reset
[OpenOCD]
Info : [esp32.cpu0] Debug controller was reset.
[OpenOCD]
Info : [esp32.cpu0] Core was reset.
[OpenOCD]
Info : [esp32.cpu0] Target halted, PC=0x500000CF, debug_reason=00000000
[OpenOCD]
Info : [esp32.cpu0] Reset cause (3) - (Software core reset)
[OpenOCD]
Info : [esp32.cpu1] requesting target halt and executing a soft reset[OpenOCD]

[OpenOCD]
Info : [esp32.cpu0] Core was reset.
[OpenOCD]
Info : [esp32.cpu0] Target halted, PC=0x40000400, debug_r[OpenOCD]
eason=00000000
[OpenOCD]
Info : [esp32.cpu1] Debug controller was reset.
[OpenOCD]
Info : [esp32.cpu1] Core was reset.
[OpenOCD]
Info : [esp32.cpu1] Target halted, PC=0x40000400, debug_r[OpenOCD]
eason=00000000
[OpenOCD]
Info : [esp32.cpu1] Reset cause (14) - (CPU1 reset by CPU0)
[OpenOCD]
Info : [esp32.cpu0] Reset cause (3) [OpenOCD]
- (Software core reset)
[OpenOCD]
Info : [esp32.cpu0] Target halted, PC=0x40092612, debug_reason=00000001
[OpenOCD]
Info : Flash mapping 0: 0x10020 -> 0x3f400020, 90 KB
Info : Flash mapping 1: 0x30020 -> 0x400d0020, 616 KB
Info : Using flash bank 'esp32.cpu0.irom' size 620 KB
[OpenOCD]
Info : [esp32.cpu0] Target halted, PC=0x40092612, debug_reason=00000001
[OpenOCD]
Info : Flash mapping 0: 0x10020 -> 0x3f400020, 90 KB
[OpenOCD]
Info : Flash mapping 1: 0x30020 -> 0x400d0020, 616 KB
Info : Using flash bank 'esp32.cpu0.drom' size 92 KB
[OpenOCD]
Info : [esp32.cpu0] Target halted, PC=0x40092612, debug_reason=00000001
[OpenOCD]
Info : Flash mapping 0: 0x10020 -> 0x3f400020, 90 KB
[OpenOCD]
Info : Flash mapping 1: 0x30020 -> 0x400d0020, 616 KB
Info : Using flash bank 'esp32.cpu1.irom' size 620 KB
[OpenOCD]
Info : [esp32.cpu0] Target halted, PC=0x40092612, debug_reason=00000001
[OpenOCD]
Info : Flash mapping 0: 0x10020 -> 0x3f400020, 90 KB
[OpenOCD]
Info : Flash mapping 1: 0x30020 -> 0x400d0020, 616 KB
Info : Using flash bank 'esp32.cpu1.drom' size 92 KB
[OpenOCD]
Info : dropped 'gdb' connection
[OpenOCD]
Info : accepting 'gdb' connection on tcp/3333
[OpenOCD]
Info : New GDB Connection: 1, Target esp32.cpu0, state: halted
[OpenOCD]
Info : [esp32.cpu0] Target halted, PC=0x400D8E35, debug_reason=00000001
[OpenOCD]
Info : Set GDB target to 'esp32.cpu0'
[OpenOCD]
Info : [esp32.cpu1] Target halted, PC=0x40162BA4, debug_reason=00000000
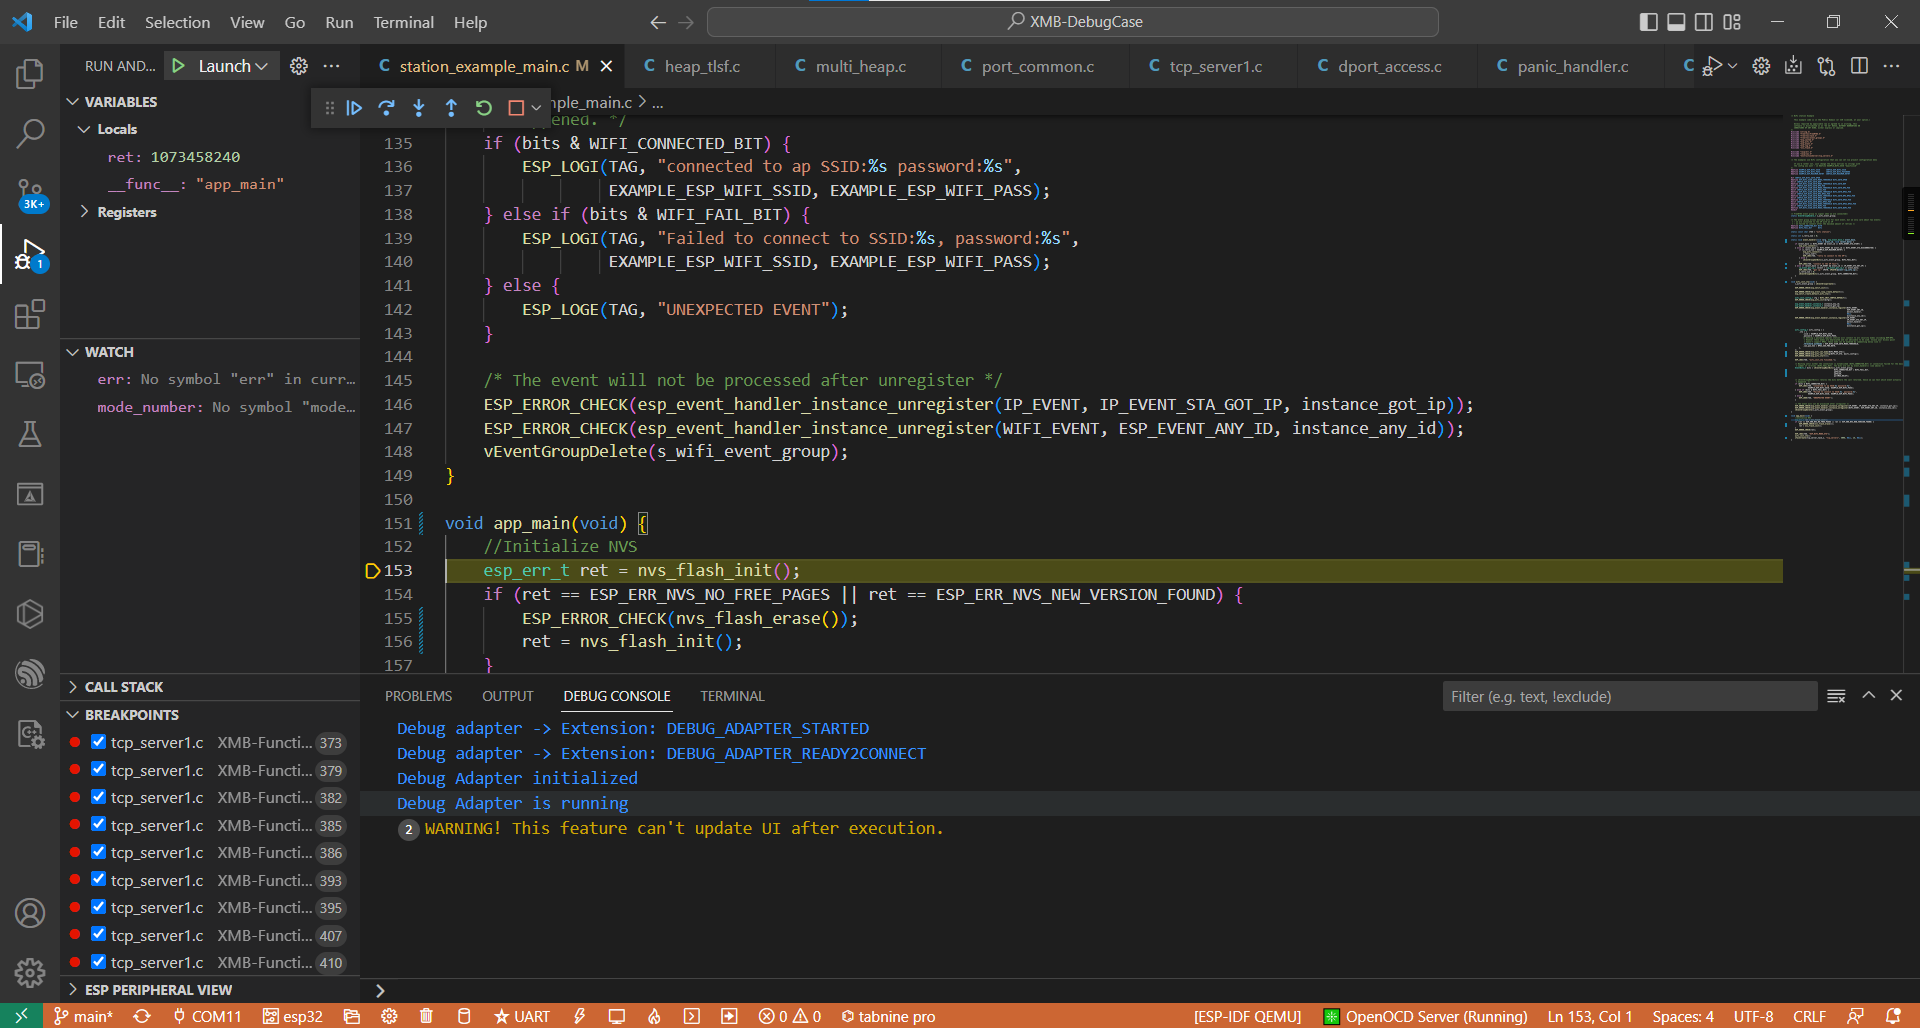
解决方案:
 err = nvs_open("storage", NVS_READONLY, &my_handle);
    if (err == ESP_OK) {
        ...
    }
 nvs_close(my_handle);
当检测到分区为空时将不再进行以下操作并关闭分区
解决方案
err = nvs_open("storage", NVS_READONLY, &my_handle);
    if (err == ESP_OK) {
        ...
    }
nvs_flash_erase();
nvs_close(my_handle);
每次第一次读完会擦除所有数据,原本是写一个‘0’进去。但是不知道为什么导致了崩溃,然后就改成了擦除的API。
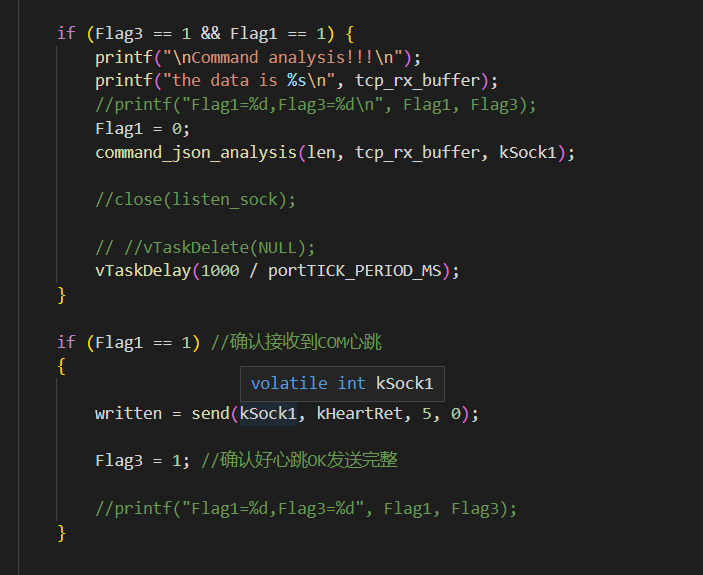
在原版本中,先分析flag1然后进行发送并置位flag3。其逻辑顺位接下来是解析,但如果直接进行下一步解析,此时所需要解析的数据并没有完成接收,也就无法解析。而flag3却已经置零,当再次接收到数据时,将无法进入解析。
解决方案:
if (Flag3 == 1 && Flag1 == 1) {
    printf("\nCommand analysis!!!\n");
    printf("the data is %s\n", tcp_rx_buffer);
    //printf("Flag1=%d,Flag3=%d\n", Flag1, Flag3);
    Flag1 = 0;
    command_json_analysis(len, tcp_rx_buffer, kSock1);
    vTaskDelay(1000 / portTICK_PERIOD_MS);
}

if (Flag1 == 1) //确认接收到COM心跳
{
	written = send(kSock1, kHeartRet, 5, 0);
	Flag3 = 1; //确认好心跳OK发送完整
	//printf("Flag1=%d,Flag3=%d", Flag1, Flag3);
}
将两者的逻辑顺序调换既可
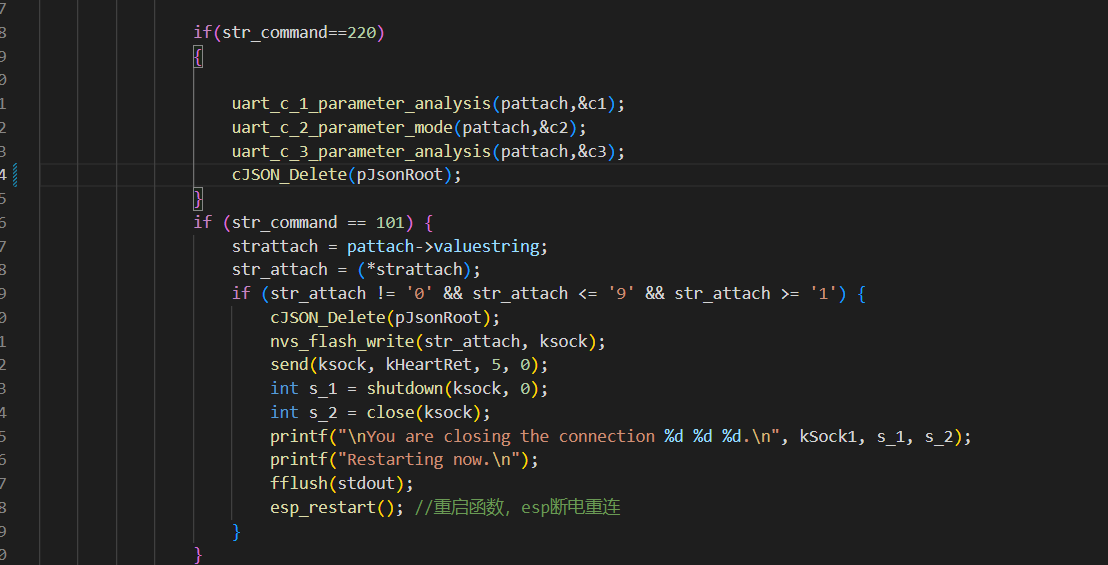
目前用的是if,但是可以换成swtich
if (str_command == 101) {
	strattach = pattach->valuestring;
	str_attach = (*strattach);
	if (str_attach != '0' && str_attach <= '9' && str_attach >= '1') {
	cJSON_Delete(pJsonRoot);//释放节点
	nvs_flash_write(str_attach, ksock);//写入flash
	send(ksock, kHeartRet, 5, 0);//
	int s_1 = shutdown(ksock, 0);
	int s_2 = close(ksock);
	printf("\nYou are closing the connection %d %d %d.\n", kSock1, s_1, s_2);
	printf("Restarting now.\n");
	fflush(stdout);
	esp_restart(); //重启函数,esp断电重连
}
注意,顺序应该是释放json根节点->模式写入flash->发送心跳包->关闭/断开tcp协议->重启
(1)发送心跳包以及模式写入flash,必须在关闭/断开tcp协议之前
(2)重启一定在最后
顺序可以在遵从(1),(2)的前提下稍作更改
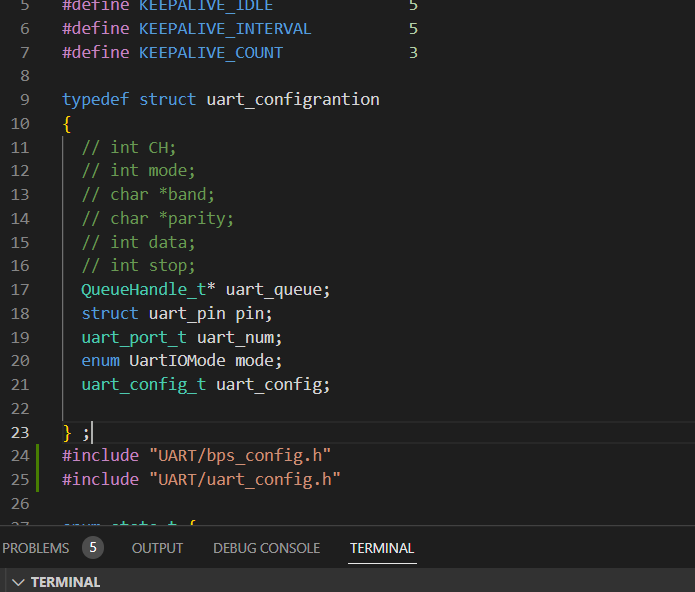
整合进UART结构配置时,因为结构体不同,重构了一遍代码
工作量一般,但实质性并无啥改变,只是赋予对应值时修改一下结构体访问对象罢了
使用debug花了点时间,最后发现这次的原因不在read函数上而是在write函数上
打开失败的原因和上次一样
nvs_flash_erase();
nvs_init();
err = nvs_open("storage", NVS_READONLY, &my_handle);
    if (err == ESP_OK) {
        ...
    }
...
解决方案:只需要在open之前,把里面的东西清空即可
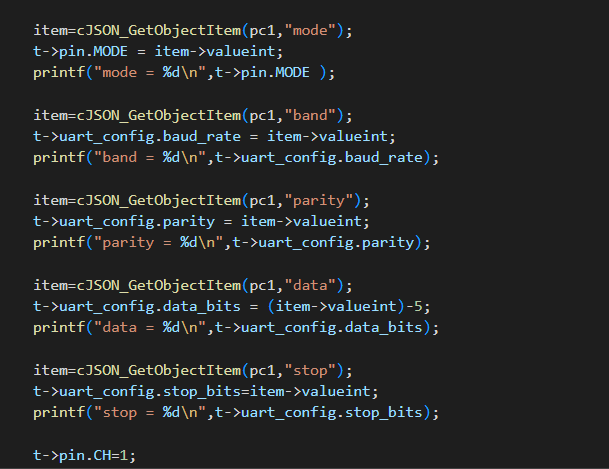
把对应的结构体重构后,将解析出来的数据访问并赋值时,芯片便立马罢工了
错误报告如下:
Command analysis!!!
In analysis
str_command : 220
c1:
Guru Meditation Error: Core 0 panic'ed (StoreProhibited). Exception was unhandled.
Core 0 register dump:
PC : 0x400d94f1 PS : 0x00060930 A0 : 0x800d93cb A1 : 0x3ffc6160
0x400d94f1: uart_c_1_parameter_analysis at C:/Users/22380/Documents/DebugCase/XMB-DebugCase/XMB-FunctionModules/InstructionServer/tcp_server1.c:309
A2 : 0x00000000 A3 : 0x00000031 A4 : 0x00000001 A5 : 0x3ffc60a0
A6 : 0x00000010 A7 : 0x3ffc6160 A8 : 0x800d94e0 A9 : 0x3ffc6130
A10 : 0x3ffb8de0 A11 : 0x3f406b88 A12 : 0x3ffc6034 A13 : 0x3f406b35
A14 : 0x00000012 A15 : 0x3ffc6130 SAR : 0x00000004 EXCCAUSE: 0x0000001d
EXCVADDR: 0x00000005 LBEG : 0x400014fd LEND : 0x4000150d LCOUNT : 0xfffffffe
Backtrace: 0x400d94ee:0x3ffc6160 0x400d93c8:0x3ffc61a0 0x400d9278:0x3ffc61f0
0x400d94ee: uart_c_1_parameter_analysis at C:/Users/22380/Documents/DebugCase/XMB-DebugCase/XMB-FunctionModules/InstructionServer/tcp_server1.c:309
0x400d93c8: command_json_analysis at C:/Users/22380/Documents/DebugCase/XMB-DebugCase/XMB-FunctionModules/InstructionServer/tcp_server1.c:265
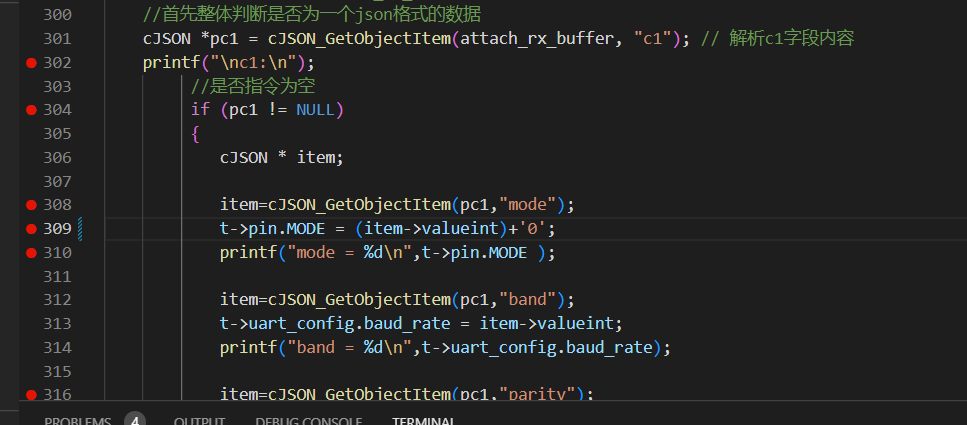
0x400d9278: tcp_server_task_1 at C:/Users/22380/Documents/DebugCase/XMB-DebugCase/XMB-FunctionModules/InstructionServer/tcp_server1.c:175在原来的结构体赋值中也出现过这个错误,之前是输入发送的数据对象写错导致的,或者访问对象类型不一致导致的
调查之后,排除前者的可能性,大概率是类型不对
于是发现,uart_configrantion->pin.MODE是字符类型,而输入和解析都是int类型,所以修改了一下打印以及赋值的形式。
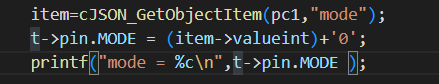
然而问题并没有得到解决,结合之前解析并没有出现这样的错误,于是,问题可能出现在将解析的值赋值给重构的结构体时,访问重构结构体的方式是错误的。
为了证明这一点,我设置了一个对照组。
 unsigned char str_C1 = '0';
 ...
 cJSON * item;

 item=cJSON_GetObjectItem(pc1,"mode");
 // t->pin.MODE = (unsigned char)(item->valueint+'0');
 // printf("mode = %c\n",t->pin.MODE );
 str_C1 = (unsigned char)(item->valueint+'0');
 printf("mode = %c\n",str_C1 );

 item=cJSON_GetObjectItem(pc1,"band");
 t->uart_config.baud_rate = item->valueint;
 printf("band = %d\n",t->uart_config.band);

 item=cJSON_GetObjectItem(pc1,"parity");
 t->uart_config.parity = item->valueint;
 printf("parity = %d\n",t->uart_config.parity);

 item=cJSON_GetObjectItem(pc1,"data");
 t->uart_config.data_bits = (item->valueint)-5;
 printf("data = %d\n",t->uart_config.data_bits);

 item=cJSON_GetObjectItem(pc1,"stop");
 t->uart_config.stop_bits=item->valueint;
 printf("stop = %d\n",t->uart_config.stop_bits);
...
于是打印结果出现了**“mode=1”**,说明我的猜测是正确的。
open
the data is COM

Flag1=1,Flag3=0
the data is {"command":220,"attach":{"c1":{"mode":1,"band":"115200","parity":"None","data":8,"stop":1},"c2":{"mode":5},"c3":{"mode":2,"band":"9600","parity":"None","data":8,"stop":1}}}
Flag1=1,Flag3=1

Command analysis!!!

In analysis

str_command : 220
c1:
mode = 1
Guru Meditation Error: Core  0 panic'ed (StoreProhibited). Exception was unhandled.

Core  0 register dump:
PC      : 0x400d9529  PS      : 0x00060530  A0      : 0x800d93e3  A1      : 0x3ffc6160
0x400d9529: uart_c_1_parameter_analysis at C:/Users/22380/Documents/DebugCase/XMB-DebugCase/XMB-FunctionModules/InstructionServer/tcp_server1.c:315