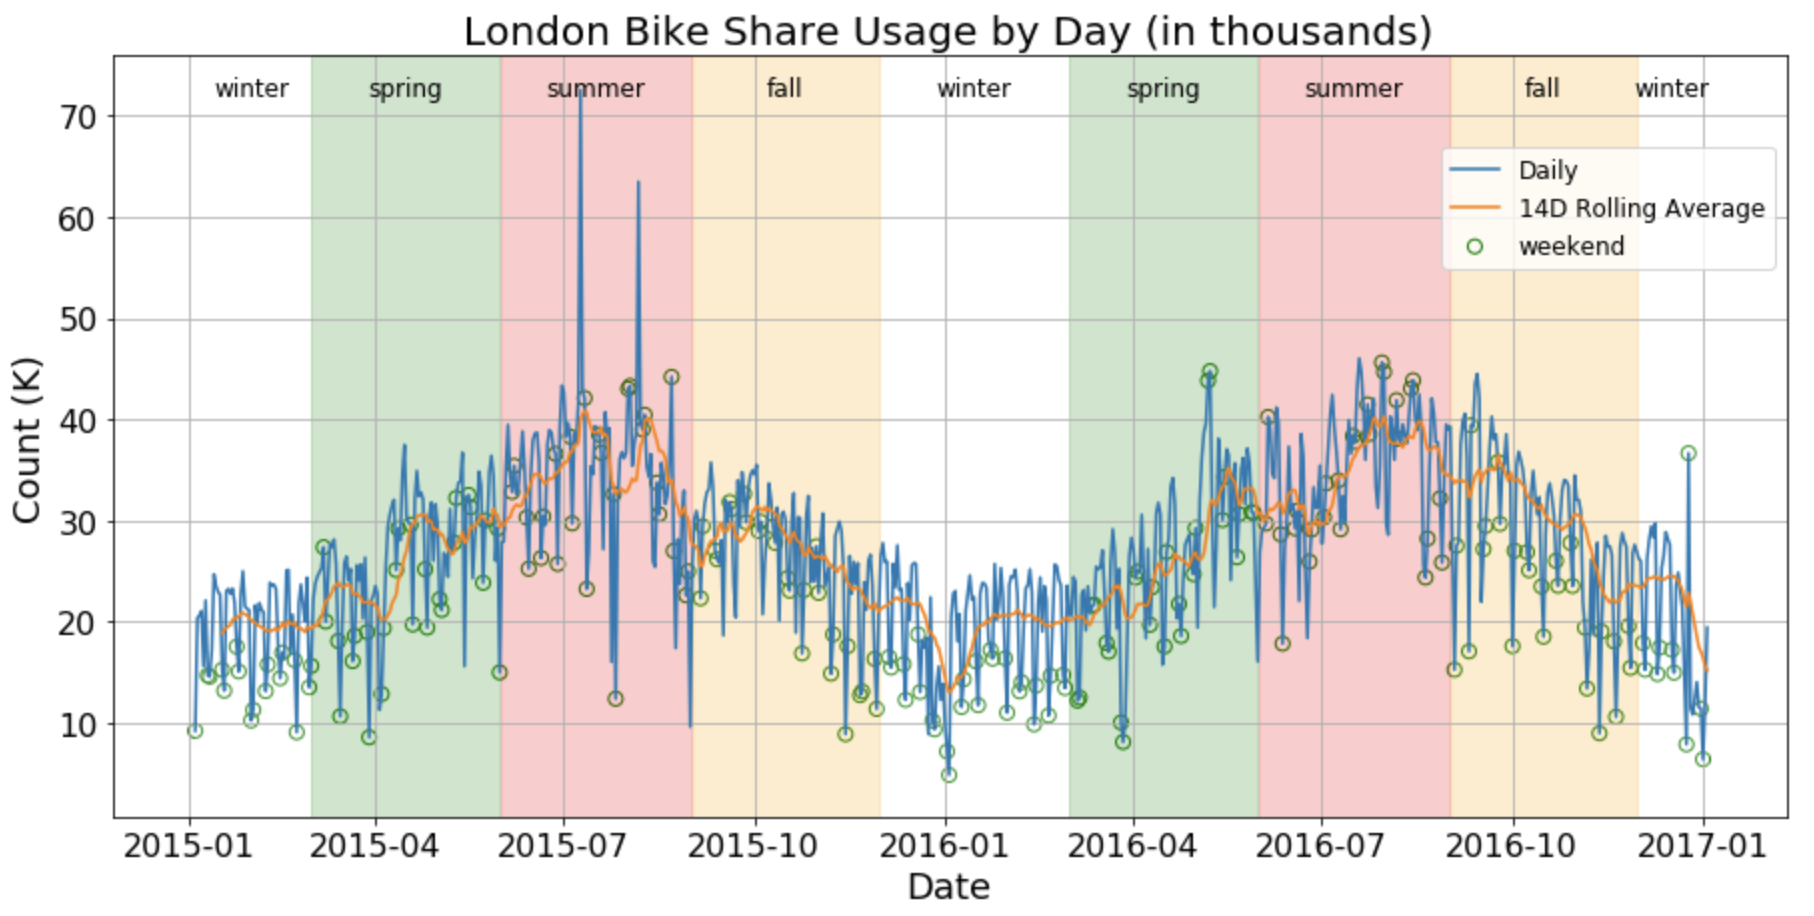
An overview of the London Bike Share usage from 2015 and 2017; the important factors and what it would mean for the future.
Between the year of 2015 and 2017, on average, each day, there were over 27 thousand times a bike was used, with over 72 thousand times on the busiest day — that’s a lot of journeys!! This analysis takes the hourly data and try to see if there are any important factors can be found that impact when people use the shared bikes.
The important findings were:
1. Warm weathers definitely encourage the use of bikes as data showed more bikes were used summer than winter.

2. There is a distinctly different usage patterns for weekdays and weekends as shown from the hourly breakdown graphs. This proves that a significant proportion of bikes are being used for work related travels. This hypothesis is further strengthened by the discover of anomalies caused by Tube Strikes.

3. The factors discussed above (as well as other factors from the dataset) could be used to provide a good macro-prediction of the bike usages.
- Python : 3.7.6
- pandas : 1.0.1
- numpy : 1.18.1
- matplotlib : 3.1.3
- seaborn : 0.10.0
- sklearn : 0.22.1
- jupyter lab : 1.2.6
London_BikeShare_Prediction.ipynb -- The Jupyter notebook of which the analysis is done, using standard Python libraries such as pandas, numpy, matplotlib and sklearn etc
london_merged.csv -- The csv file which contains the data used (the data is from Kaggle, link in the Credit section)
https://www.kaggle.com/hmavrodiev/london-bike-sharing-dataset -- source of the csv file
