SALES-REPORT
Assuming a Sales manager or analyst was asked to present to senior management, stakeholders, or other relevant parties a sales report relating to a company’s sales performance. The purpose of the report presentation is to provide an overview of the sales data, highlight trends and patterns, identify areas of improvement, and make recommendations for future sales strategies.
INTRODUCTION
In the context of becoming a data analyst, Microsoft Excel isn’t the only tool used for analysis and visualization; Microsoft Power Business Intelligence (Power BI) is also a crucial tool used by data analysts.
Power BI is an interactive data visualization software application developed by Microsoft with a primary focus on business intelligence. It’s a component of the Microsoft Power Platform. Power BI is a set of software services, apps, and connectors that work together to transform disparate data sources into cohesive, visually immersive, and interactive insights. Data can be obtained by reading directly from a database, a webpage, or structured files such as spreadsheets, CSVs, XMLs, and JSONs. (From Microsoft Power BI (2023, February 3)) Microsoft Power BI
IN THE DATASET
I was given a financial data set during my training to explore my data analysis skills using Power BI. In summary, the dataset consists of twenty-two (22) columns and over 5000 rows labeled as Row ID, Order ID, Order Date, Ship Date, Ship Mode, Customer ID, Customer Name, Segment, Country, City, State, Postal Code, Region, Product ID, Category, Sub-Category, Product Name, Sales, Quantity, Discount, Profit, and Profit Margin.
CLEANING THE DATASET
As previously discussed in my previous project, the importance of data cleaning cannot be overstated to achieve a suitable result upon visualization. My cleaning procedure in Excel comprises deleting blanks and duplicates and converting them into a table with color formatting.
After launching my Power BI Desktop, which I downloaded from its website, I loaded the data into the application program using the get data option, where I can use power query to make some additional changes, such as grouping relevant columns (such as location, city, state, region, postcode, country, amongst other grouped columns), adding and deleting columns where appropriate, separating fact tables from dimension tables, identifying primary keys (i.e. the one with the lowest value in each group), and so on.
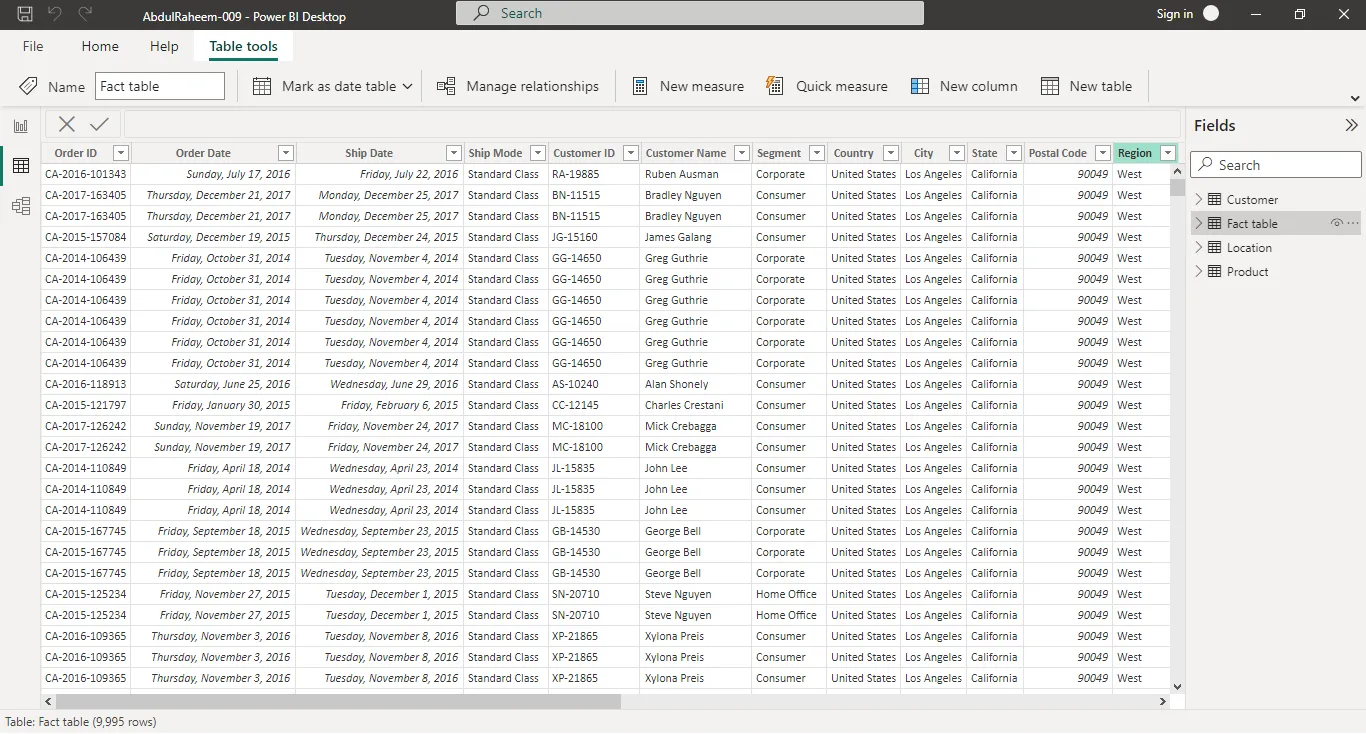
Figure 1: fact and dimension table in Data view
After importing my dataset into Power BI, I was able to see the link between my fact table and dimension table using the model view.
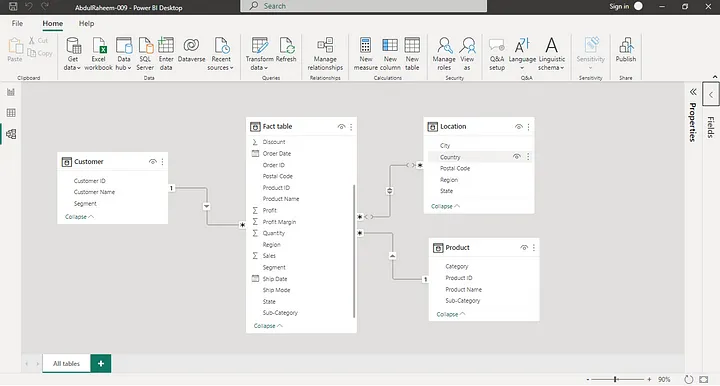
Figure 2: Model view; Relationship between fact and dimension tables
DATA ANALYSIS
Since visualization is sometimes referred to as the “face of every study,” a lot of work has been spent on it, including in terms of page formatting, visual formatting, visual layout, and many other areas.
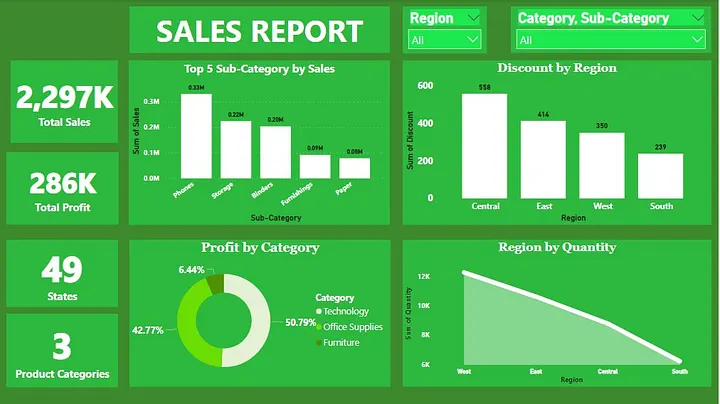
Overview page: This page displays total sales of over two million with a total profit of over two hundred thousand from forty-nine states, on three product categories.
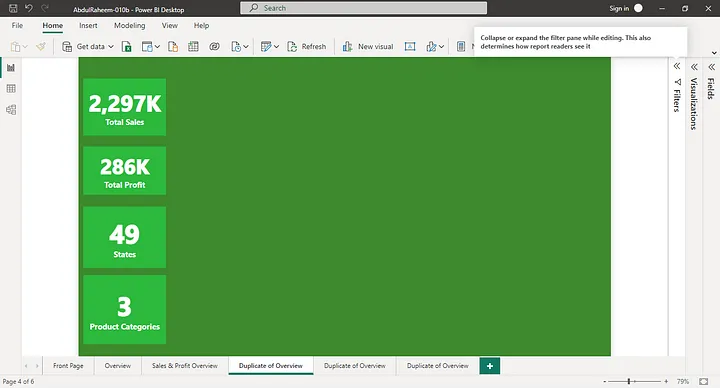
Figure 3: Overview page
Regional Discount: Customers from the Central region were given more discounts, and those in the Eastern, Western, and Southern regions followed.
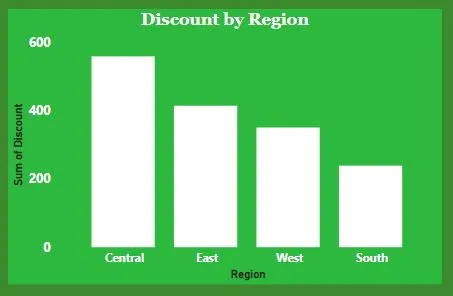
Figure 4: Discount by Region in Bar chart
Categorical Profit: The goods sold were categorized into three; Technology, office supplies, and Furniture with 50.79, 42.77, and 6.44 profit percent respectively.
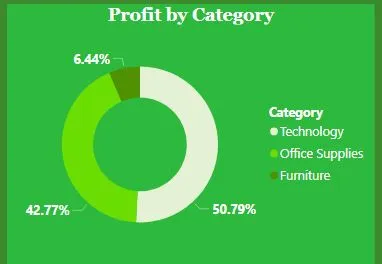
Figure 5: Profit by Category on Pie Chart
Sub-Categorical sales: Goods sold were sub-categorized into different sections. Phones, Storage, Binders, Furnishings, and Papers with over 300K, 200K,90K, and 80K sales respectively were the top 5 selling goods.
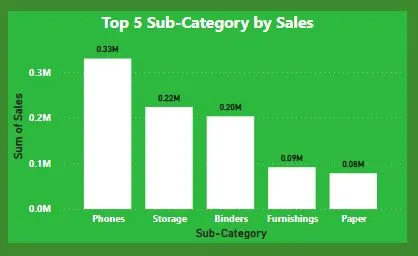
Figure 6: Top 5 Sub-categorical sales in Bar Chart
Regional Supply: About more than 50 percent of the quantities were supplied to the West.
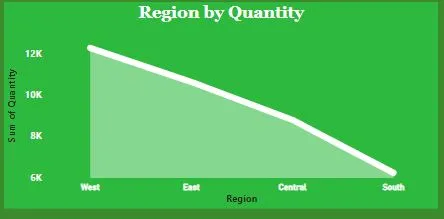
Figure 7: Regional Supply on Stacked Area Chart
Profit by City: New York City, Los Angeles, Seattle, San Francisco, and Detroit took the lead of the cities by profit.
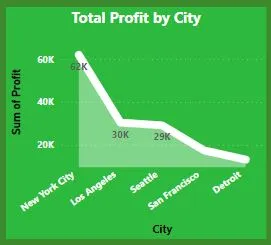
Figure 8: Total profit made by city on Stacked Area Chart
Recommendations: More discount offers should be allocated to the western customers to boost sales although they get more supplies which is also a go of making more sales
In summary, Being in the 21st Century, technology especially phones has shown that it can be a front-line for other products by making about 33,000 sales. About 20.5% profit was made in the West, particularly in New York City, even with less quantity supplied.