This project aims to support wildlife conservation and habitat monitoring by leveraging big data and machine learning techniques. The project uses species data from the Global Biodiversity Information Facility (GBIF), pre-processes it using Apache Spark, and applies K-means clustering and Decision Tree models to gain insights into species distribution and habitat suitability. The results are visualized using Tableau to facilitate decision-making and conservation efforts.
- Dataset: The species occurrence data is sourced from GBIF.
- Preprocessing:
- Data cleaning and normalization is performed using PySpark in the
wildlife_monitoring.pyscript. - The dataset is prepared for machine learning by eliminating redundancies and incomplete entries.
- The preprocessed output is stored as CSV files for further analysis.
- Data cleaning and normalization is performed using PySpark in the
- A Python script (
sum.py) was written to compute the total number of species occurrences in the dataset. - The output is stored as a CSV file for visualization and further analysis.
- Model: The K-means clustering algorithm is used to group species based on their geographic locations (latitude and longitude).
- Elbow and Silhouette Method: These methods are used to determine the optimal number of clusters (K = 10).
- Implementation: The clustering is implemented in PySpark, and the results are saved in an output CSV file.
- Visualization: Tableau is used to map the species distribution and identify ecological hotspots.
- Model: A Decision Tree classifier is used to predict the habitat suitability based on species count and location data.
- Training & Testing: The dataset is split into training and testing sets to evaluate the model's performance.
- Results: The classified results are saved in a CSV file for visualization.
- Visualization: Tableau is used to map the suitable habitats and provide insights for conservation efforts.
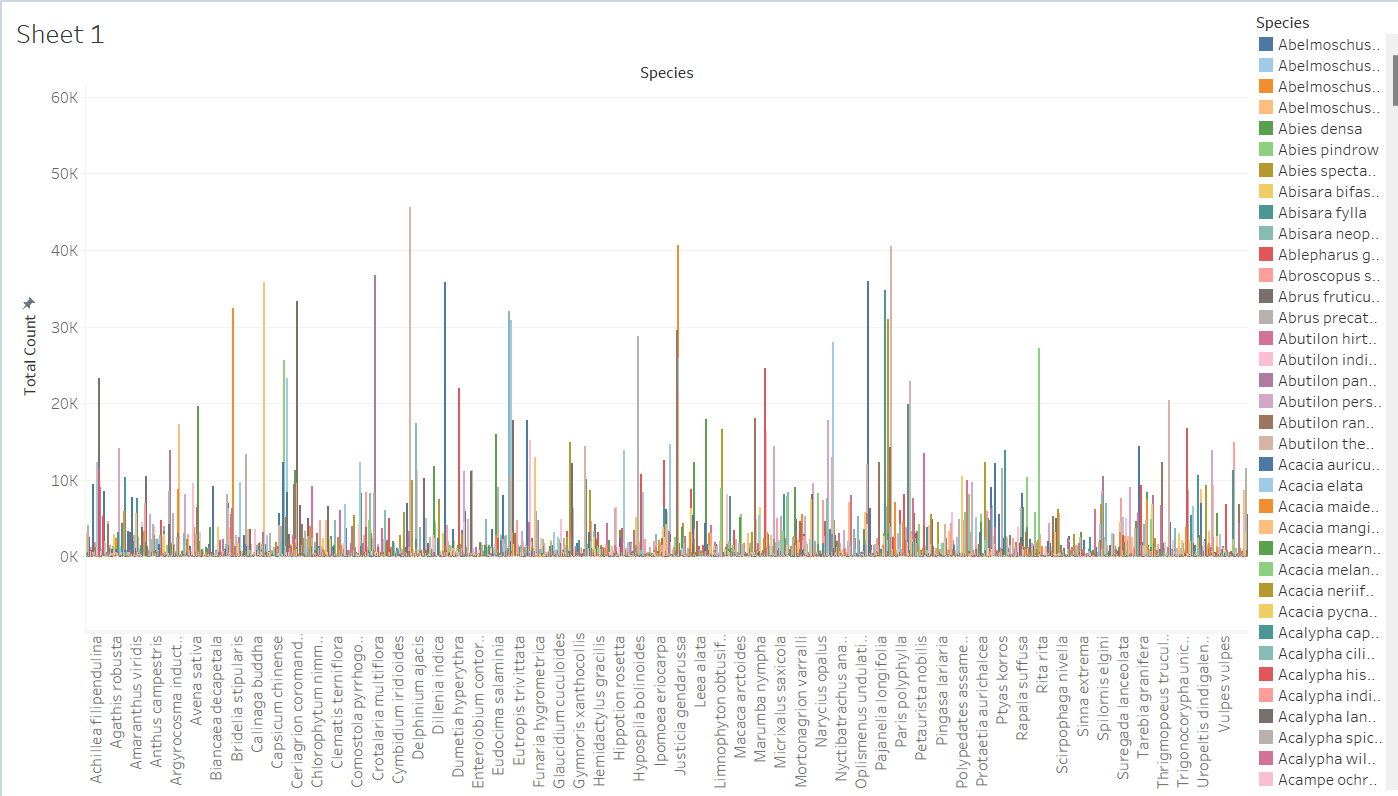
-
Species Count: A bar graph showing the total count of species is plotted using Tableau.
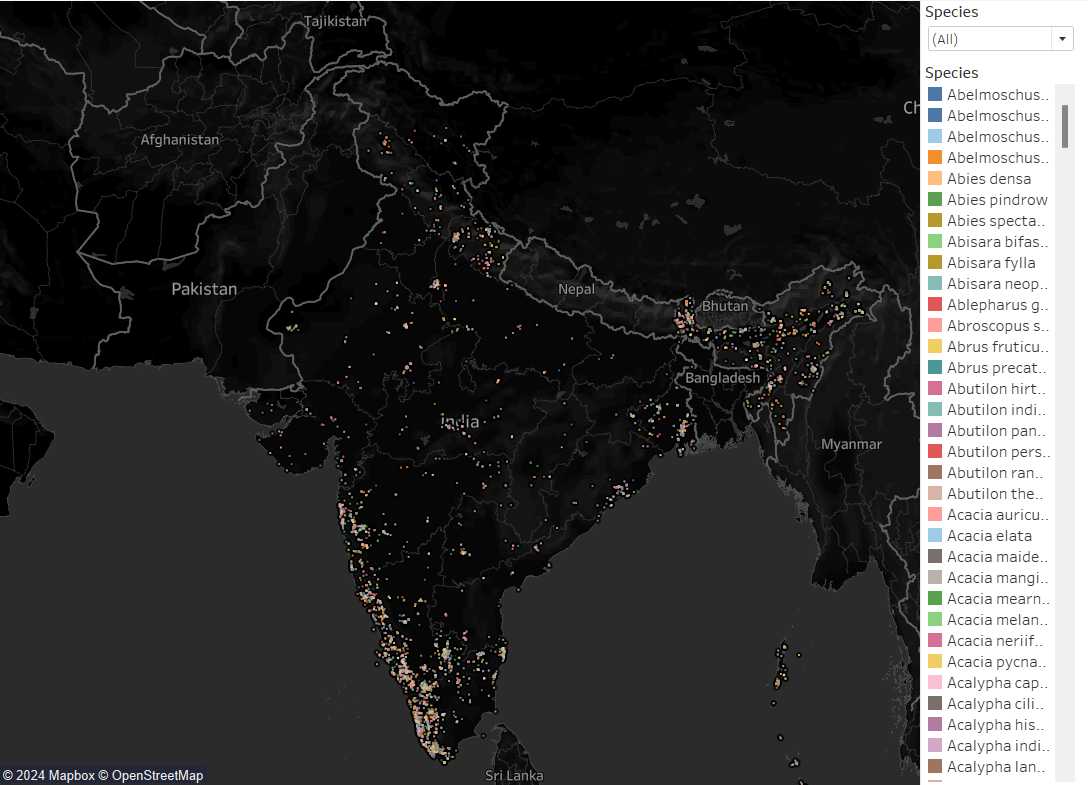
-
K-Means Clustering: A Tableau map is used to visualize species clustering based on geographic coordinates.
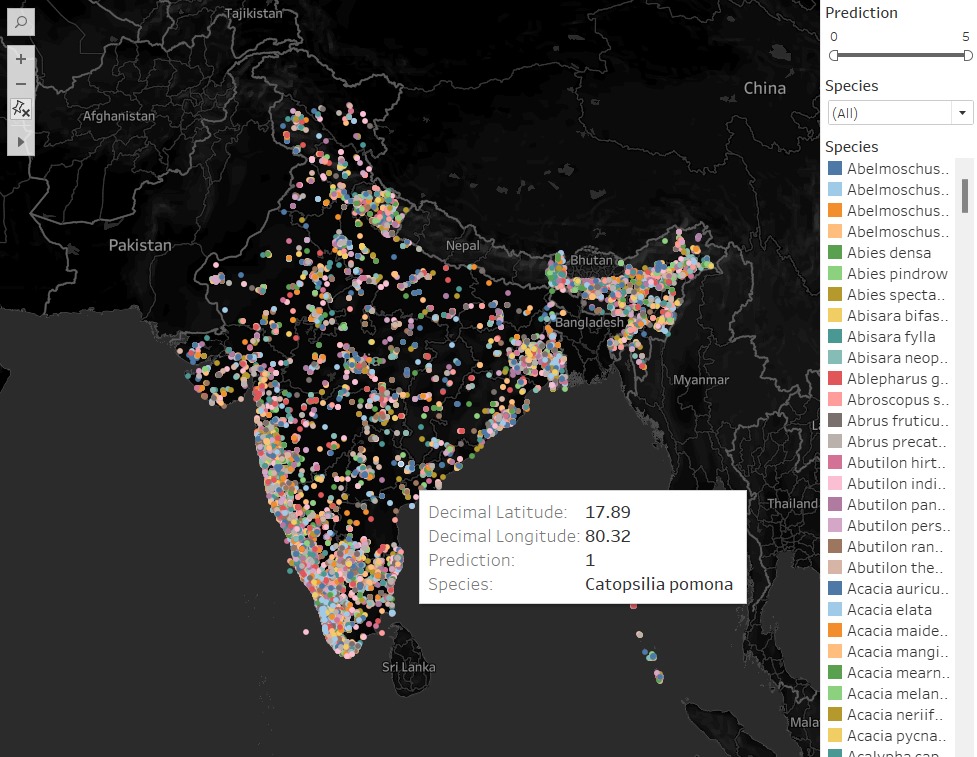
-
Decision Tree: A Tableau map shows habitat suitability predictions, identifying the best areas for species conservation.
wildlife_monitoring.py: Script used for preprocessing species data using PySpark.sum.py: Script to calculate and store the sum of species occurrences.kmeans_specieswise.py: Script to run the K-means clustering model and generate the output.tree.py: Script to run the Decision Tree classifier and generate habitat suitability results.
- GBIF Dataset: Source of species occurrence data.
- Apache Spark / PySpark: Used for data preprocessing, clustering, and classification.
- Machine Learning: K-means clustering and Decision Tree classification.
- Tableau: Visualization tool used to plot and map the results.
- CSV: Format used to store intermediate and final outputs.
The project effectively combines big data and machine learning to support wildlife conservation. Future improvements can involve incorporating more environmental factors (e.g., vegetation, climate) and tracking species over time to improve habitat suitability predictions.