Attention - BETA, version!!!
- Download FWHexView https://github.com/AlexanderBagel/FWHexView and compile FWHexView.LCL.lpk
- Open CPUView_D.lpk and install it in the IDE (menu: Package->Install/Uninstall Packages)
- Rebuild IDE
- In debug mode select menu "View->Debug Windows->CPU-View" or press Ctrl+Shift+C
- Enjoy
If during rebuild Lazarus writes "Fatal: Can't find unit dlgCpuViewImplementation used by CpuView.Reg", is necessary:
- Compile the CPUView_D package again
- Rebuild the IDE again
The reasons for this error are not yet clear.
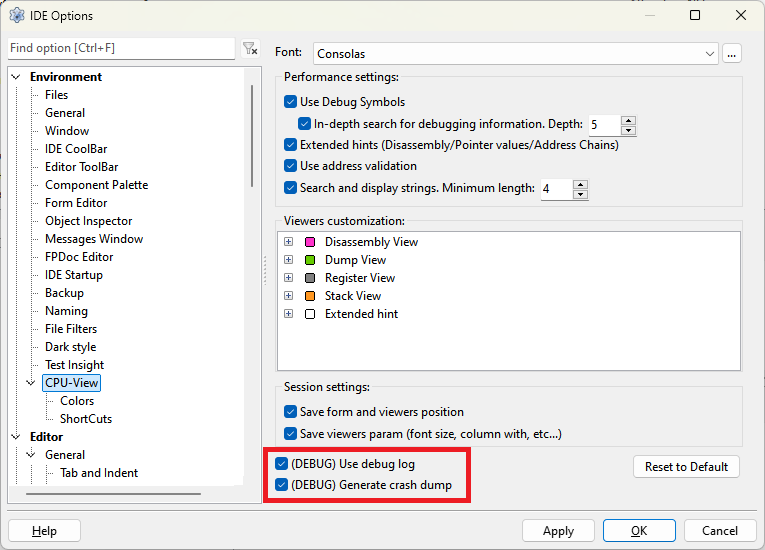
The debug log is stored in the following path: “lazarus_path\config_lazarus\cpuview\debug.log”.
It is created when the CPU-View dialog is first opened, and contains all logs added during the session (i.e. until Lazarus is finally closed).
The previous session's log is deleted on startup, so if an error occurs, you should save the log file for later analysis.
If an exception occurs, CallStack is saved to the current log.
You can disable logging or crash dump collection in the settings "Tools->Options->Environment->CPU-View".
- Disassembler
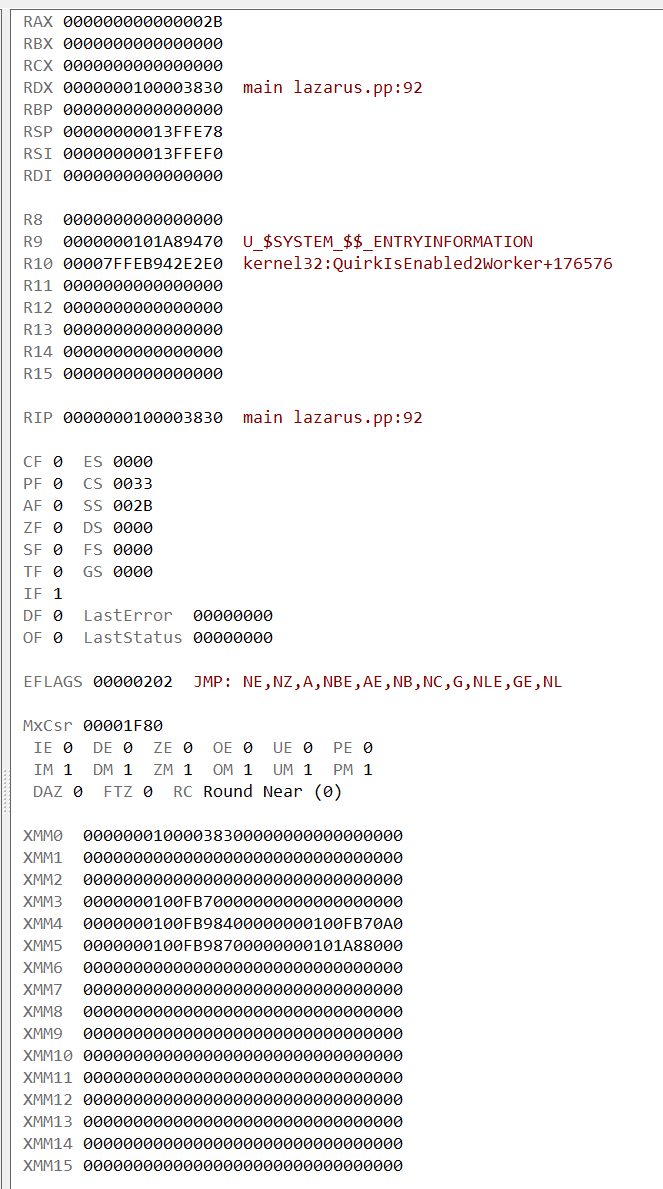
- Registers
- Dump
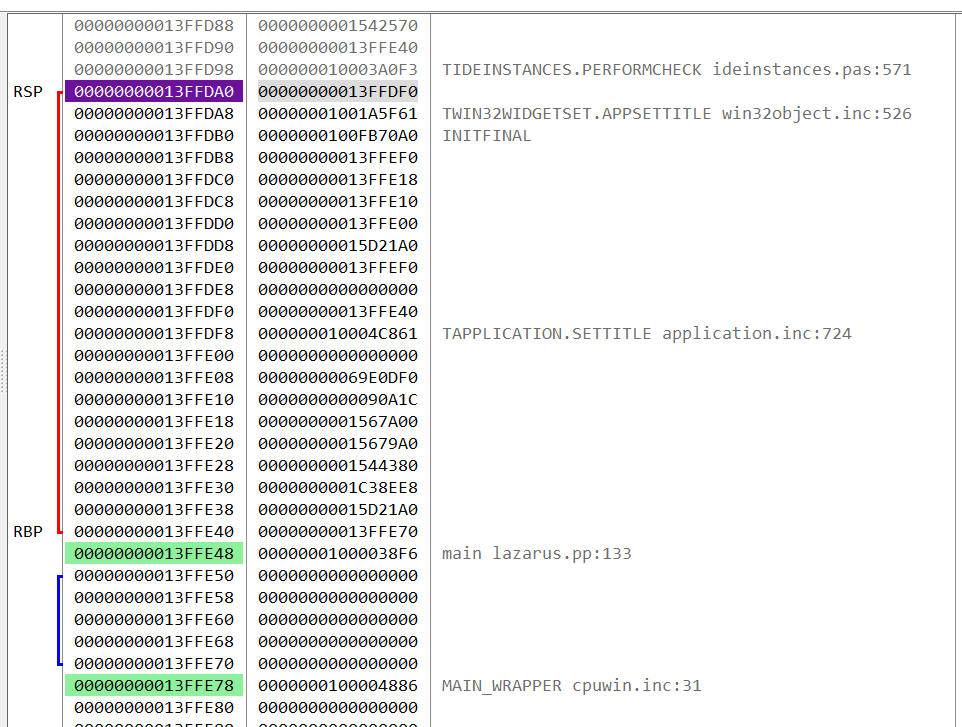
- Stack
- Script and Hint
- OS: Windows and Linux support via Gtk2 or Qt5
- Proc: Intel x86_64 (ARM not yet implemented)
- Thread context (Basic, x87 and SIMD register) full support on Windows and Linux
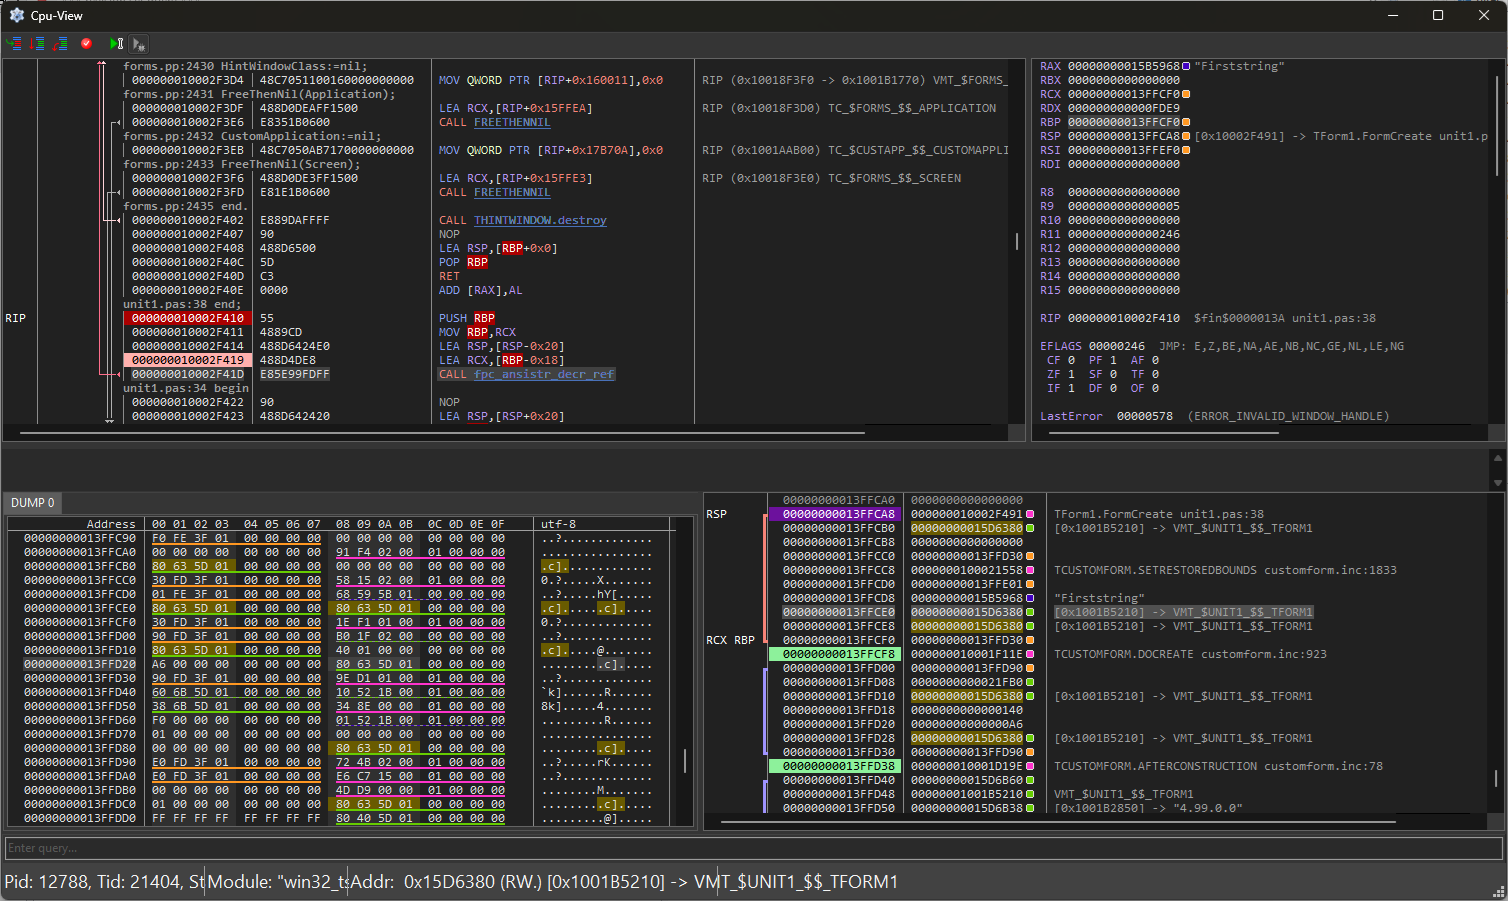
- Light and dark display themes
- Crosscompiling support
- Supports thread switching with instantaneous change of displayed information about the active thread
- Command to jump the selected address in any of the windows
- Bidirectional jump stack in each editor
- Output debugging information
- Jump direction display
- Active jump highlighting
- Highlighting of the selected register
- Displays the names of called functions instead of their addresses
- Offsets
- Hinting on the selected instruction with a menu to jump to each block of the received information
- Instruction coloring for easy code reading
- Breakpoints (display and modify)
- Bookmarks synchronization (not yet implemented)
- Display the disassembler for each jump in the tooltip (not yet implemented)
- Contains debugging information for each register (RAX..R15)
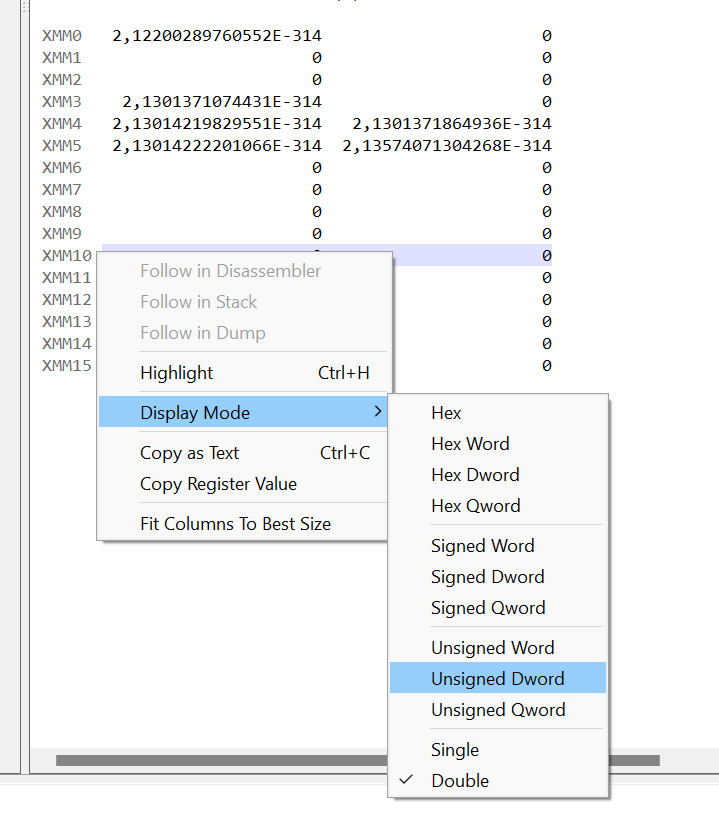
- Display SIMD registers (XMM and YMM) with 12 display mode
- Three display modes for x87 registers (ST-R-M)
- Bitwise representation of EFLAGS, TagWord, StatusWord, ControlWord, MxCsr flag registers (include decoded TagWord on x64)
- Change ALL register value and fast flag switching (x87/SIMD change not yet implemented)
- Two display modes (full and compact)
- Quick hint on active jump instructions
- LastError and LastStatus code with description (Windows only)
- Highlight of changed registers
- Highlighting and hinting to validated addresses
- Debug information
- Active and previous frames highlighting
- Return address highlighting
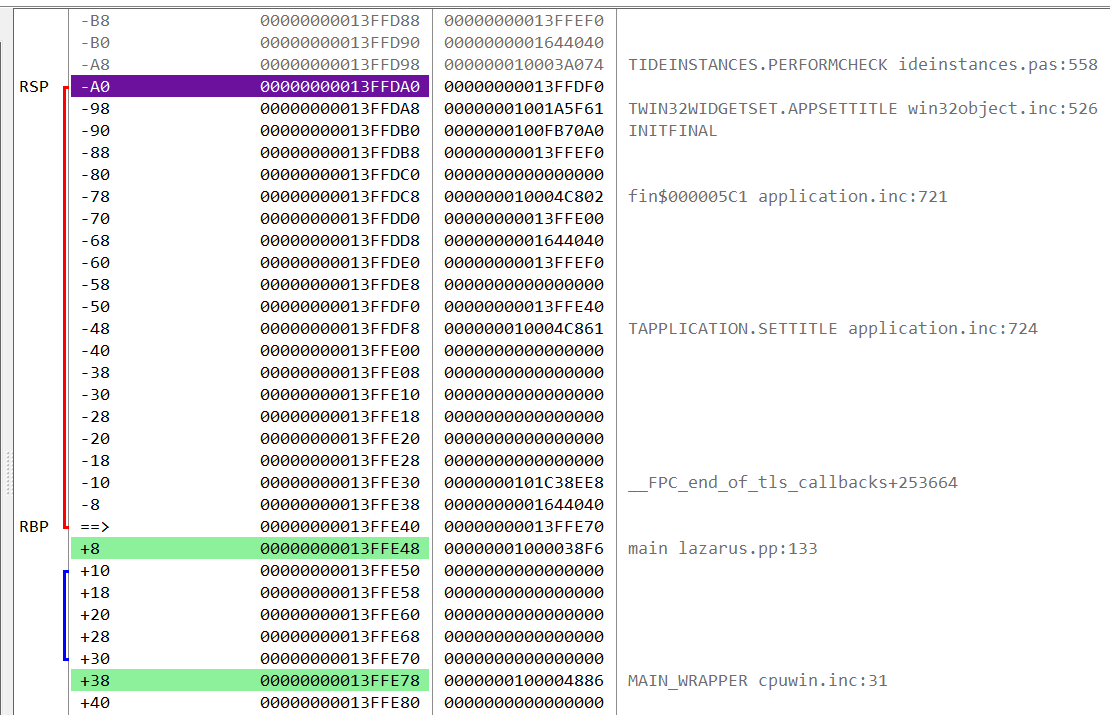
- Offsets
- Highlighting and hinting to validated addresses
- Offsets
- Multiple dump windows
- 17 display mode (include Long Double 80 bit)
- 6 text encoding mode
- 5 Copy mode (include pascal array)
- Highlighting and hinting to validated addresses
- Quick jumps to found validated addresses (via Ctrl+Click)
- Selections (not yet implemented)
- Address recognition and highlighting (not yet implemented)
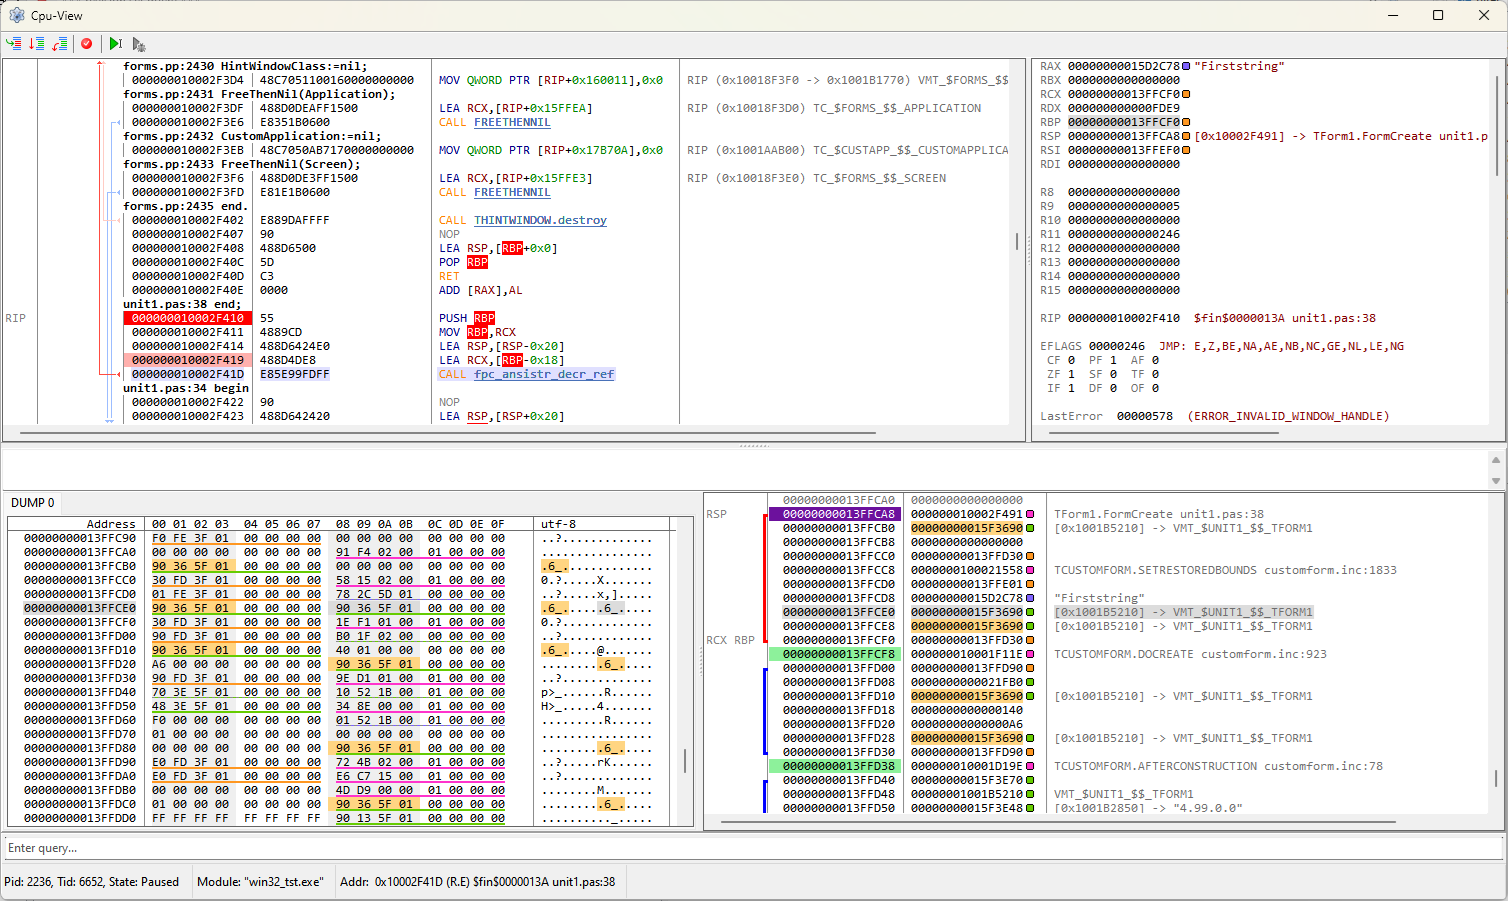
Active jump, breakpoints, smart hints for selected instructions and their menus:

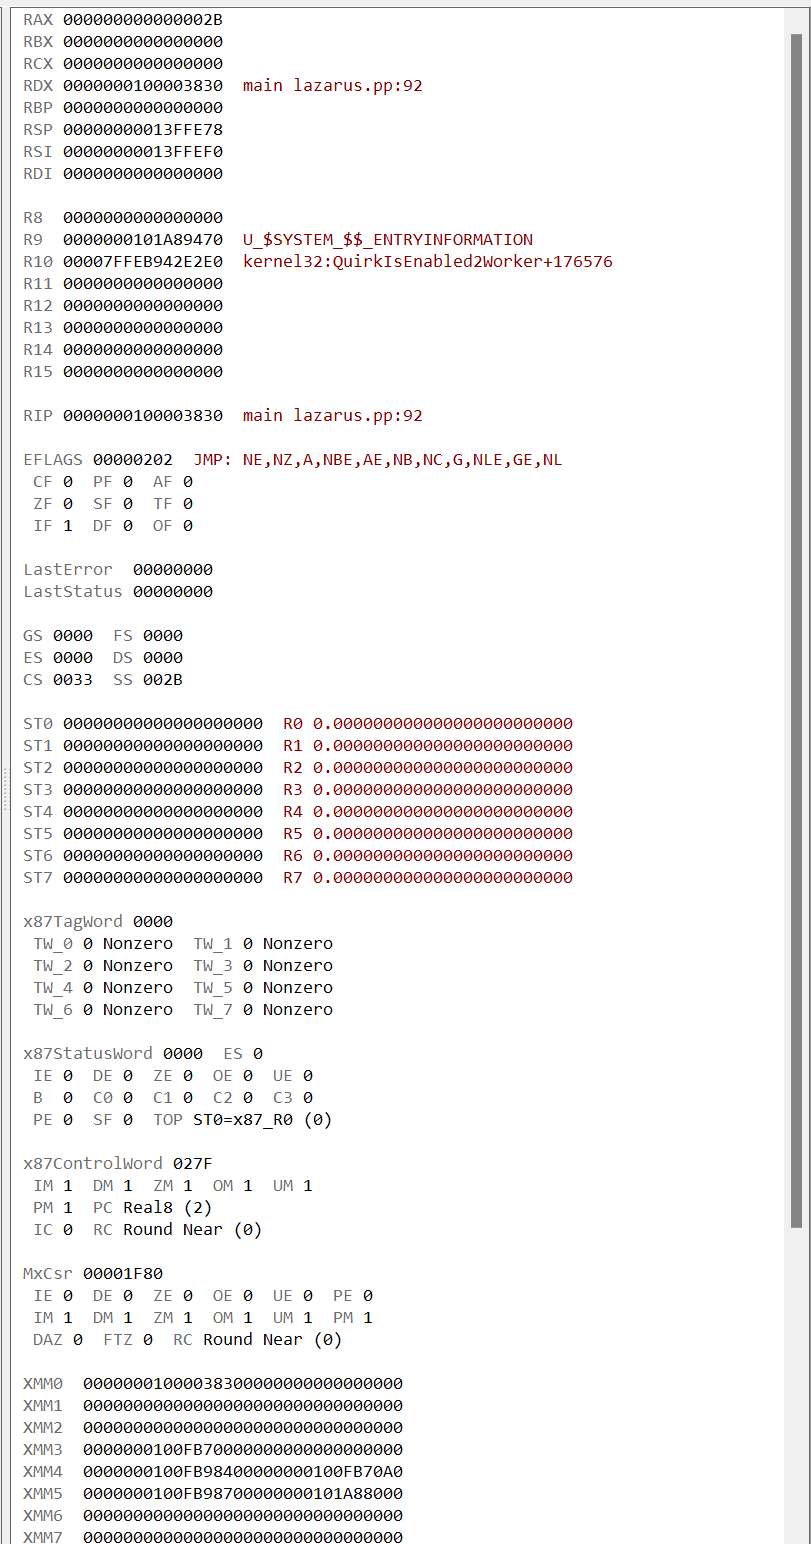
Full regview mode:
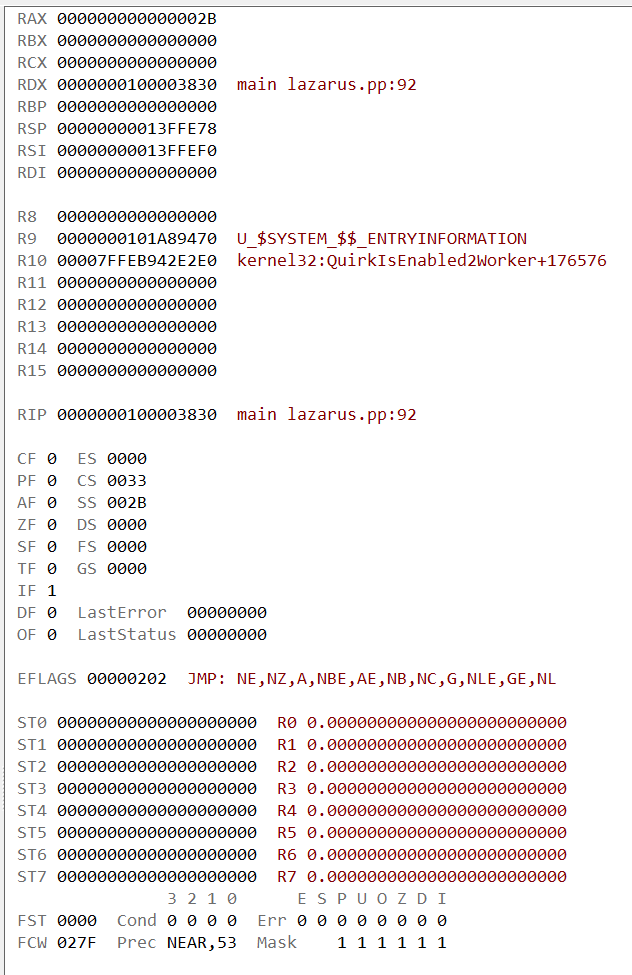
Short regview mode with FPU-STx regs (Rx and Mx available):
Short regview mode with XMM regs (ymm and debug available):
Various options for displaying registers:
Stack:
Stack with offsets:
