- Extracted customer sentiment from reviews using text mining
- Applied cluster analysis to identify segments with differentiating needs and characteristics
- Provided insights regarding which services need the most improvement
R Version: 1.4.1717
Packages:
Data: Raw Data
- The raw dataset includes 17 variables
- A subset of 8 relevant variables was selected
- Review (free text)
- Overall Rating (numerical)
- Food and Beverage Rating (numerical)
- Cabin Service Rating (numerical)
- Seat Comfort Rating (numerical)
- Entretainment Rating (numerical)
- Value for Money Rating (numerical)
- Ground Service Rating (numerical)
- Imputation of Missing Values
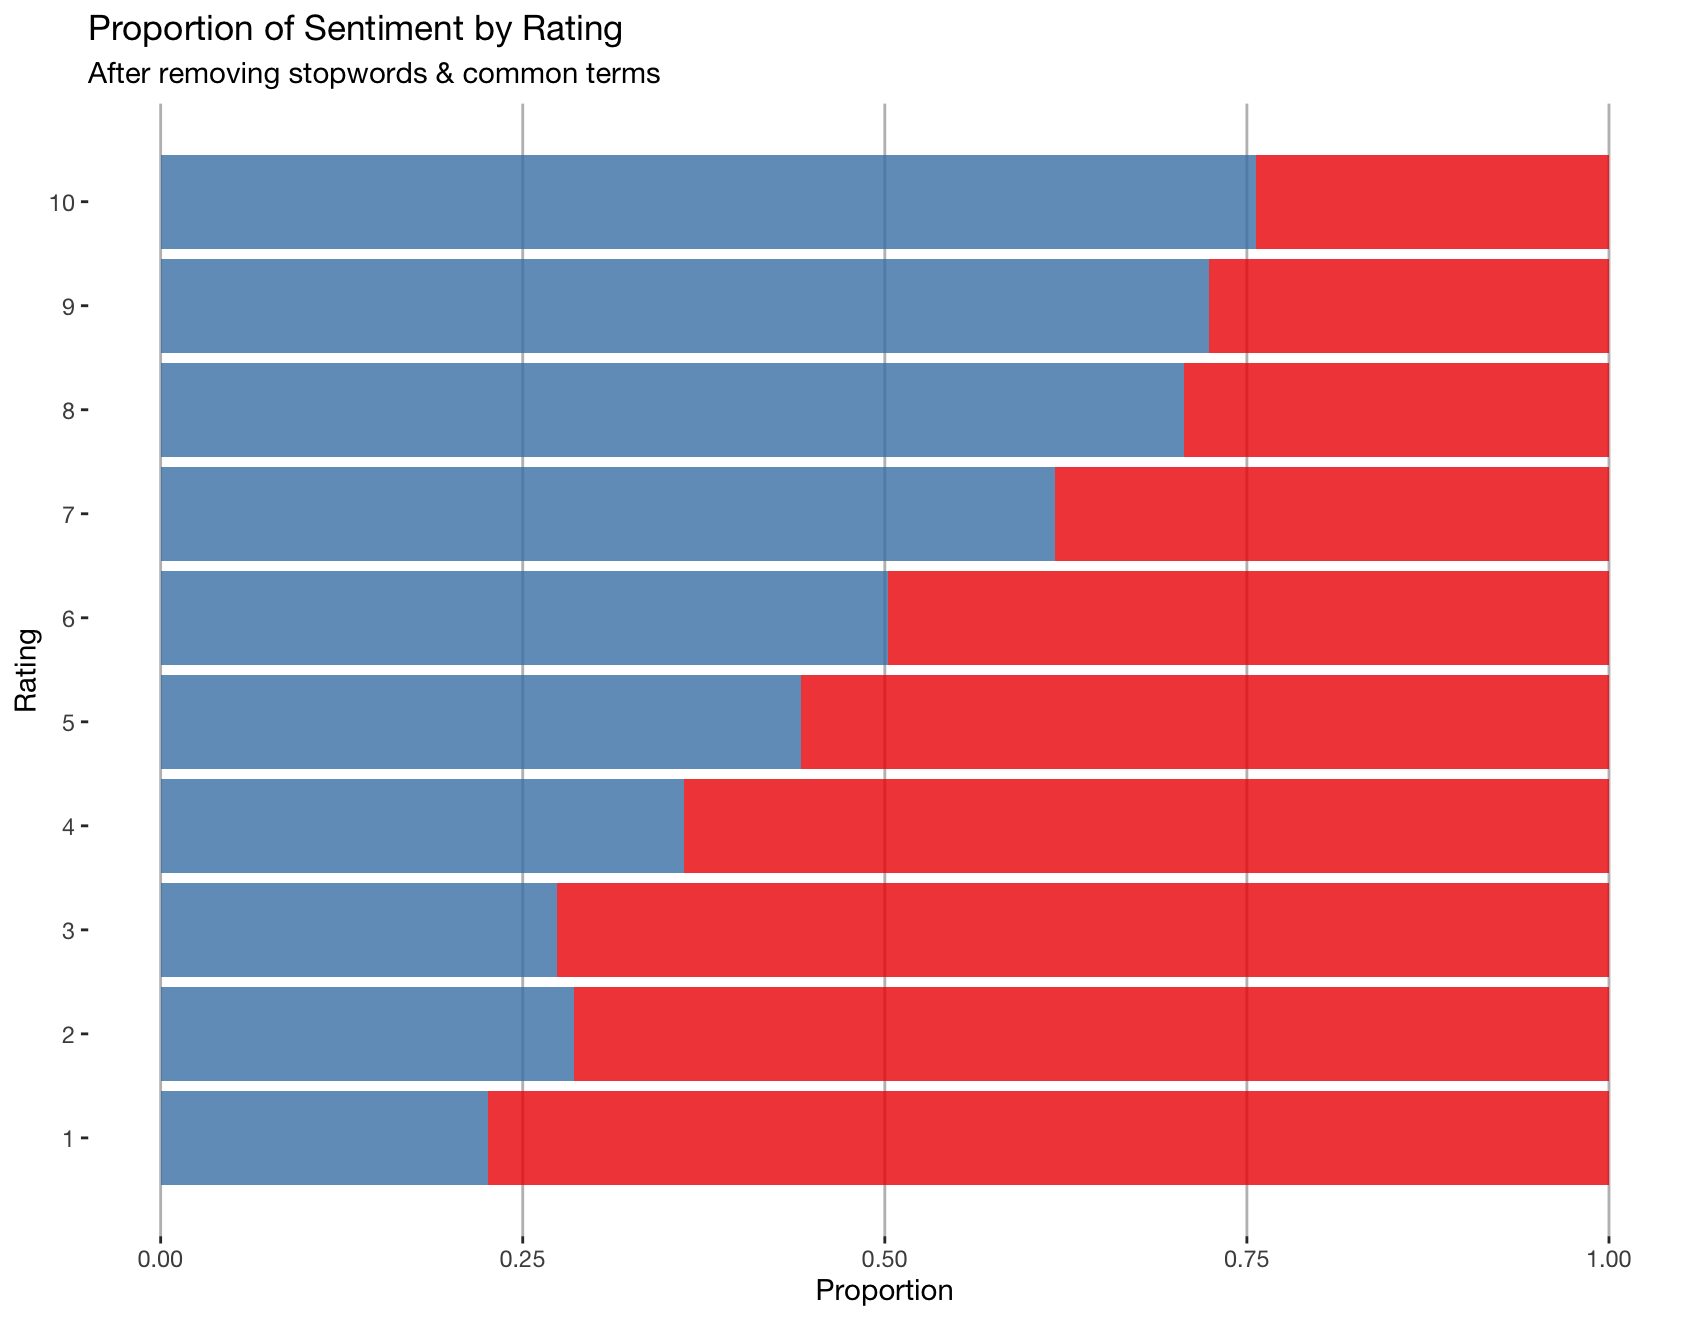
- Exploration of the proportion of positive and negative words for each rating (1-10)
- Three general-purpose lexicons were evaluated to against ratings: bing, ncr, and AFINN
- The bing lexicon, as it presented a significant correlation with the overall rating
- Exploration also indicated a prevalence of passenger dissatisfaction
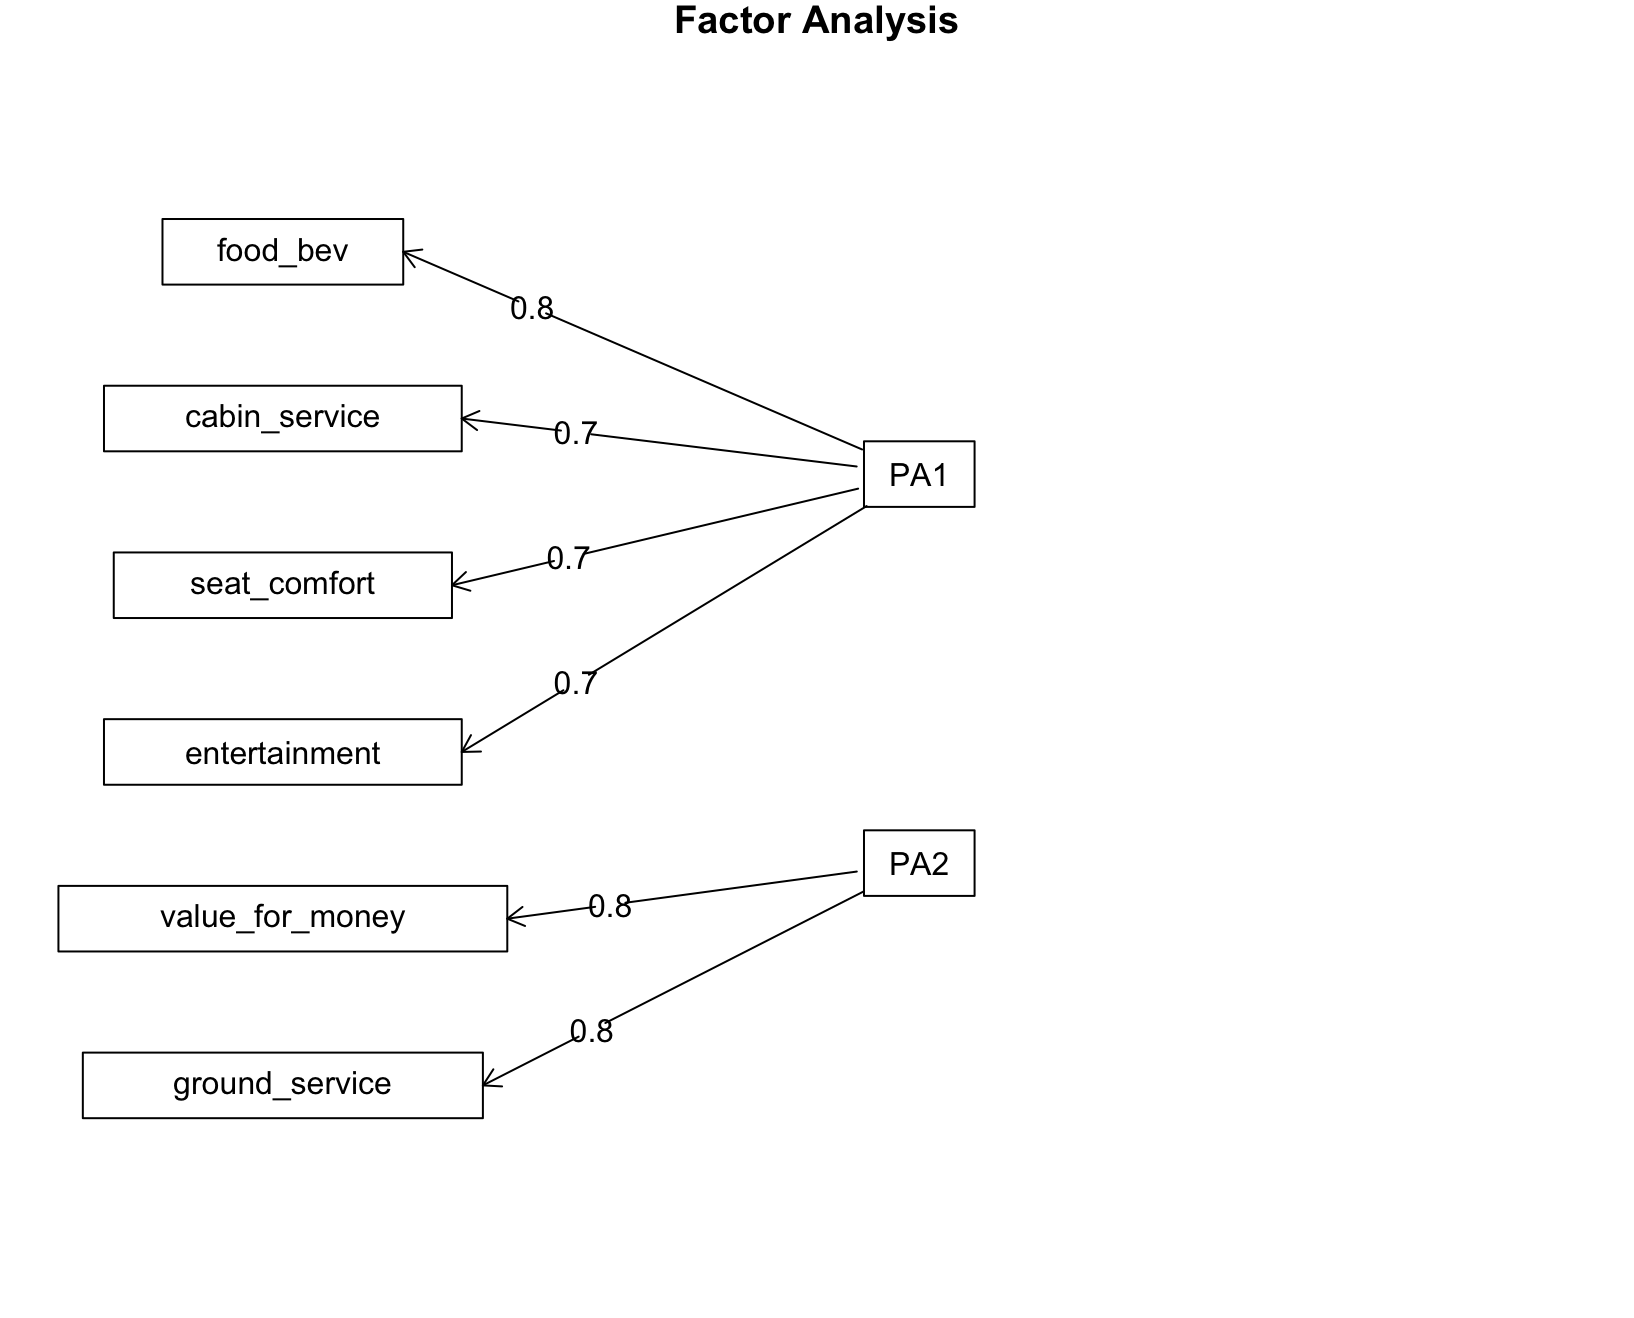
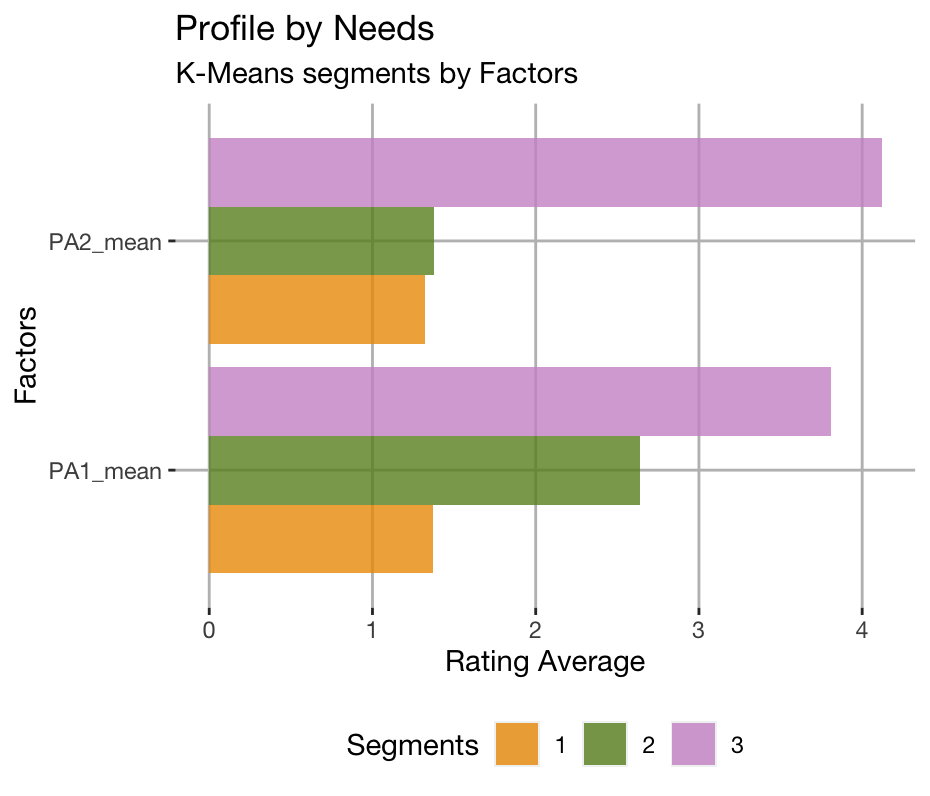
- Through factor analysis, we found that using two components would explain 74% of the six rated categories
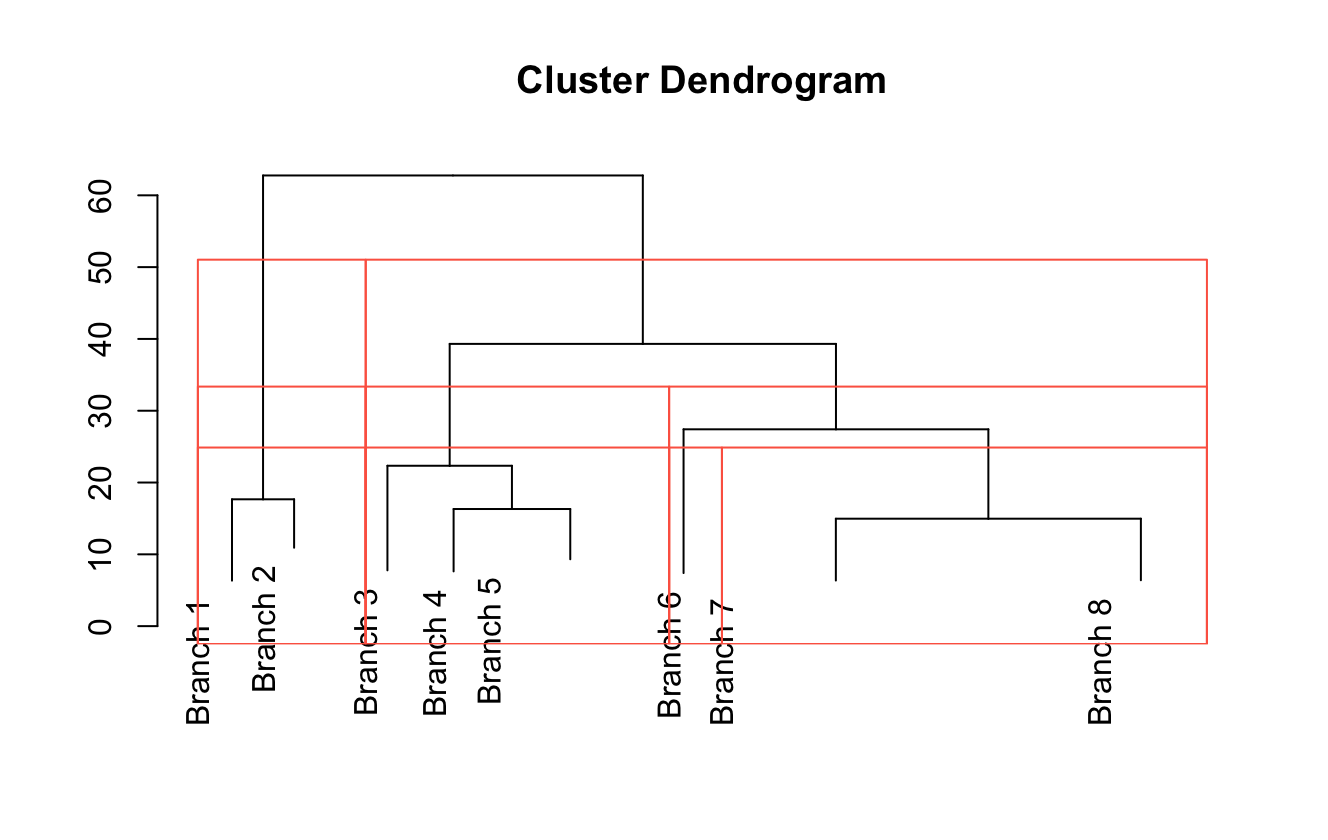
- To determine the optimal number of clusters multiple methods
- Results from Analyses suggest a three-cluster solution
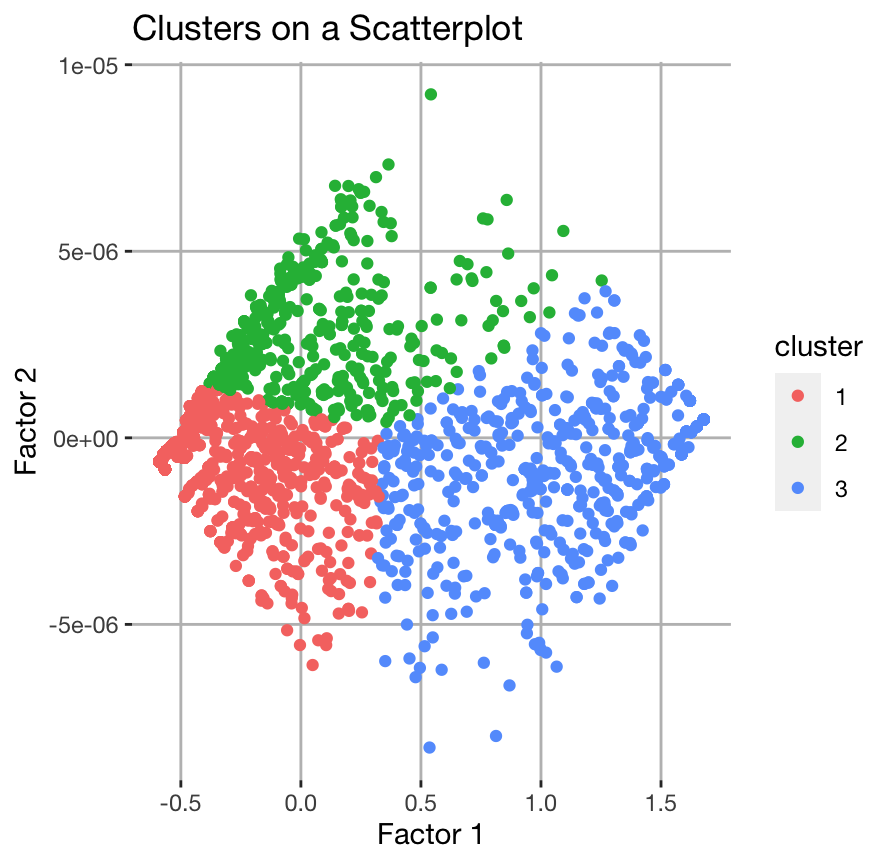
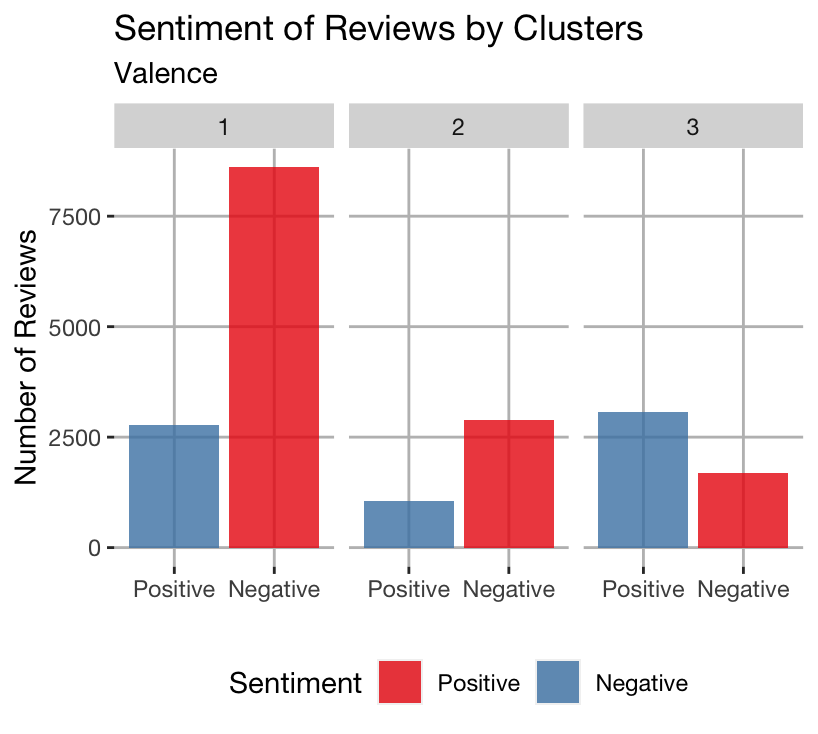
- The highest prevalence of positive reviews was in Cluster 3
- The highest prevalence of negative reviews was in Cluster 1
Cluster 1:
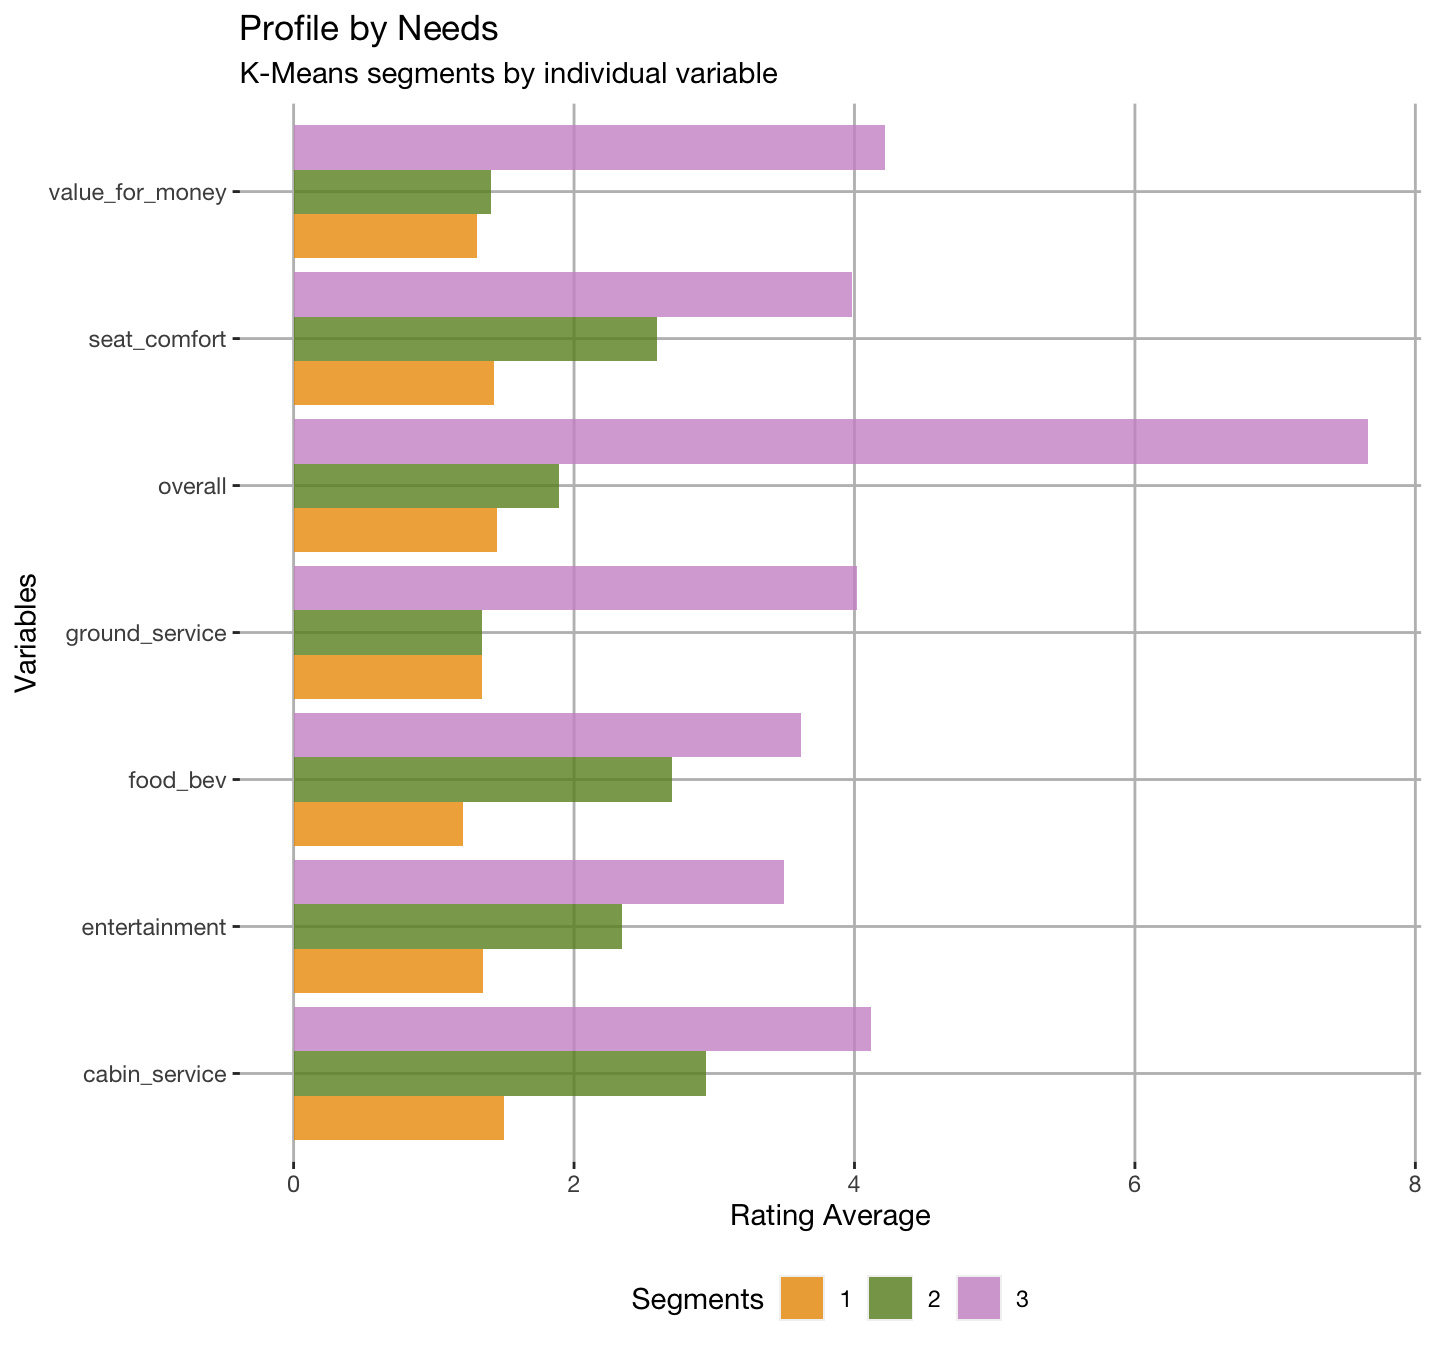
- Represent the most unsatisfied passengers overall
- Reviews suggest that negative ratings are largely driven by:
- Poor customer service
- Flight delays
- Overall poor experience across pre-flight(PA2), in-flight(PA1), and post-flight categories(PA2)
Cluster 2:
- More likely to have negative pre-flight experiences, such as flight delays or cancellations
- In comparison to Cluster 2, they are slightly more satisfied with the in-flight experience
Cluster 3:
- Represent the most satisfied passengers overall
- Provided relatively positive text reviews and ratings across all measures.
- Reviews are largely positive and primarily attributed to the in-flight experience (PA1)
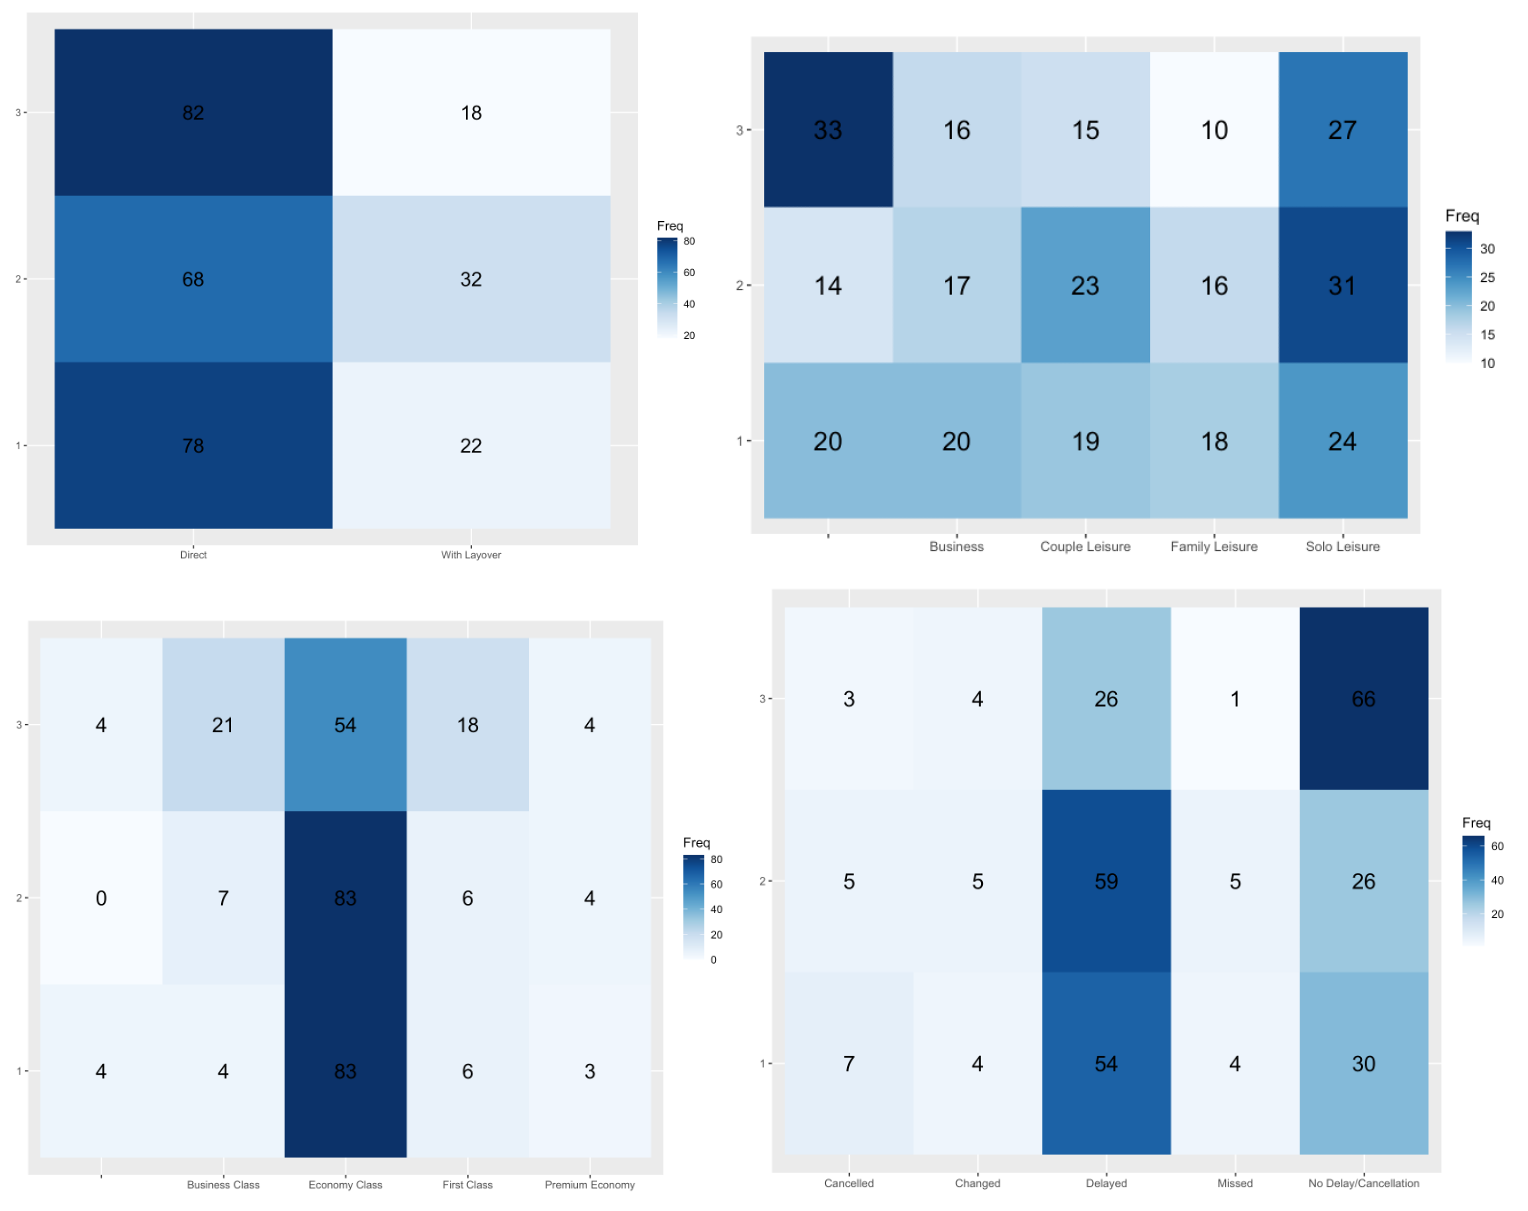
Profiling Across Factors
Profiling Across Individual Variables
Common Words on Reviews
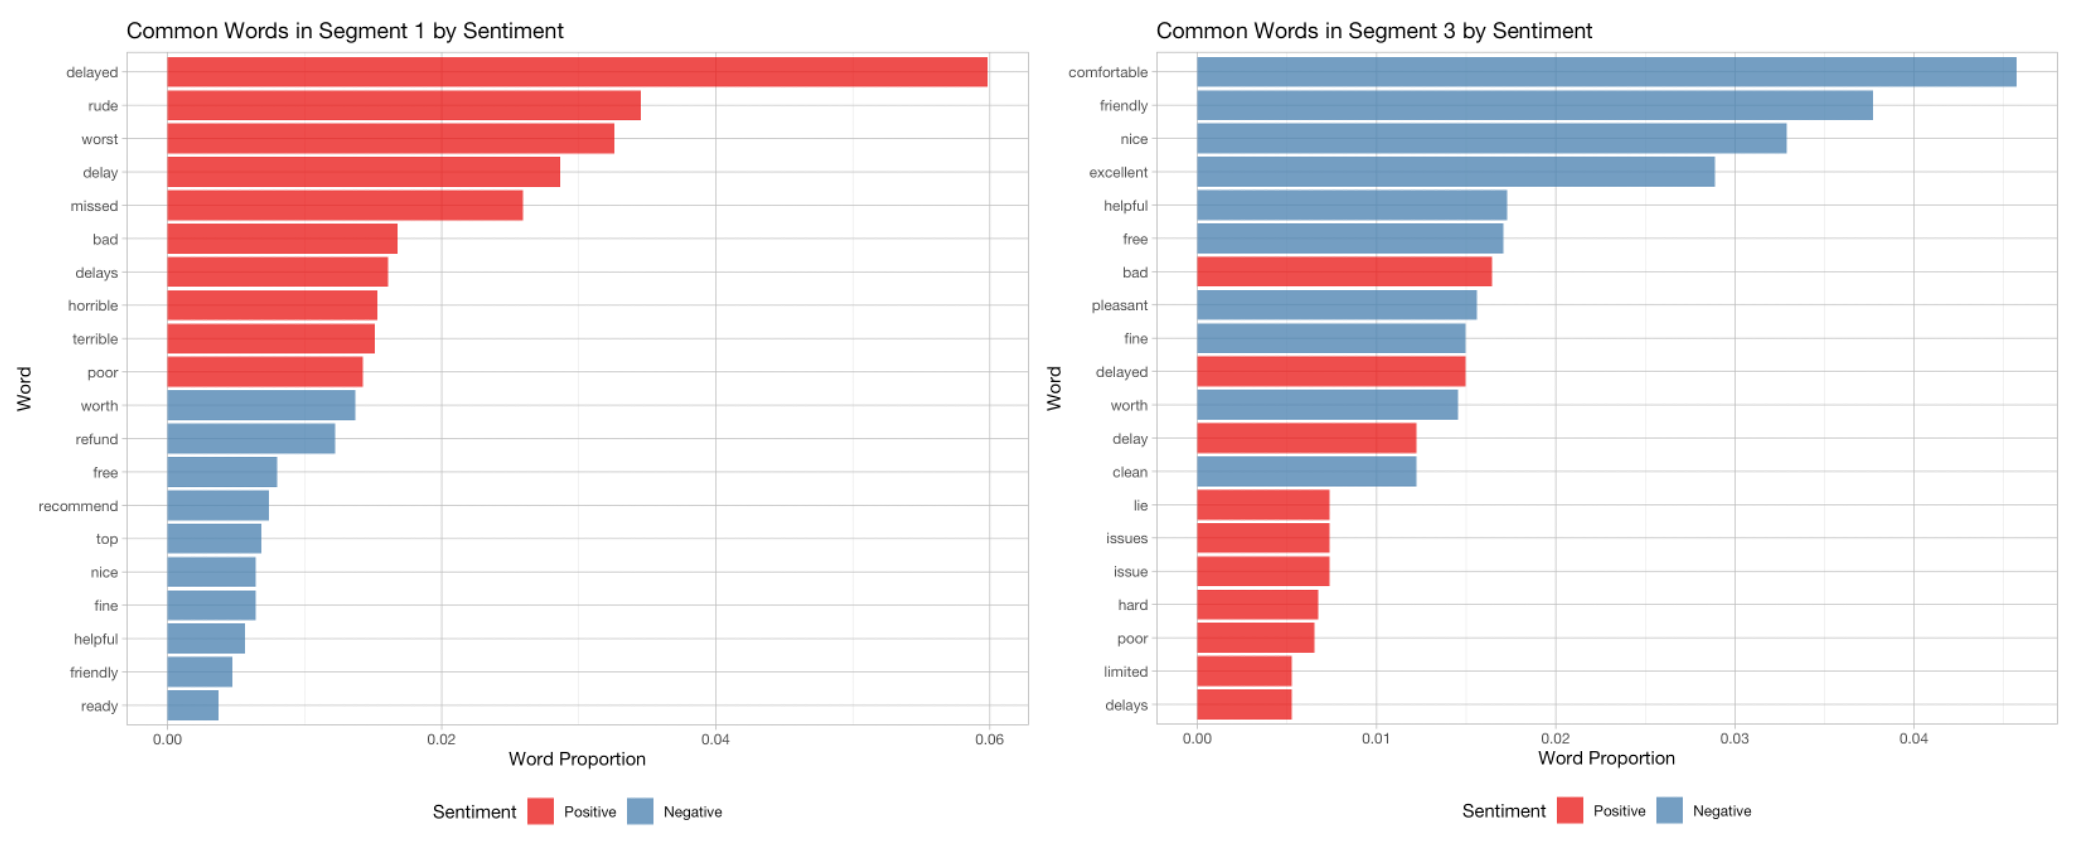
Cluster 1:
- Least likely to travel in first or business class
- The least likely to have experienced a flight delay/cancellation or layover
Cluster 2:
- The most likely to have experienced a flight delay, consistent with common words
- The most likely to have a connecting flight
Cluster 3:
- Higher percentage of business or first class passengers
- They appear less likely to travel for leisure purposes, compared to Cluster 1 and 2