Created and maintained by @GioeleB00.


AsyncFlow is a scenario-driven simulator for asynchronous distributed backends. You don’t “predict the Internet” — you declare scenarios (network RTT + jitter, resource caps, failure events) and AsyncFlow shows the operational impact: concurrency, queue growth, socket/RAM pressure, latency distributions. This means you can evaluate architectures before implementation: test scaling strategies, network assumptions, or failure modes without writing production code.
At its core, AsyncFlow is event-loop aware:
- CPU work blocks the loop,
- RAM residency ties up memory until release,
- I/O waits free the loop just like in real async frameworks.
With the new event injection engine, you can explore what-if dynamics: network spikes, server outages, degraded links, all under your control.
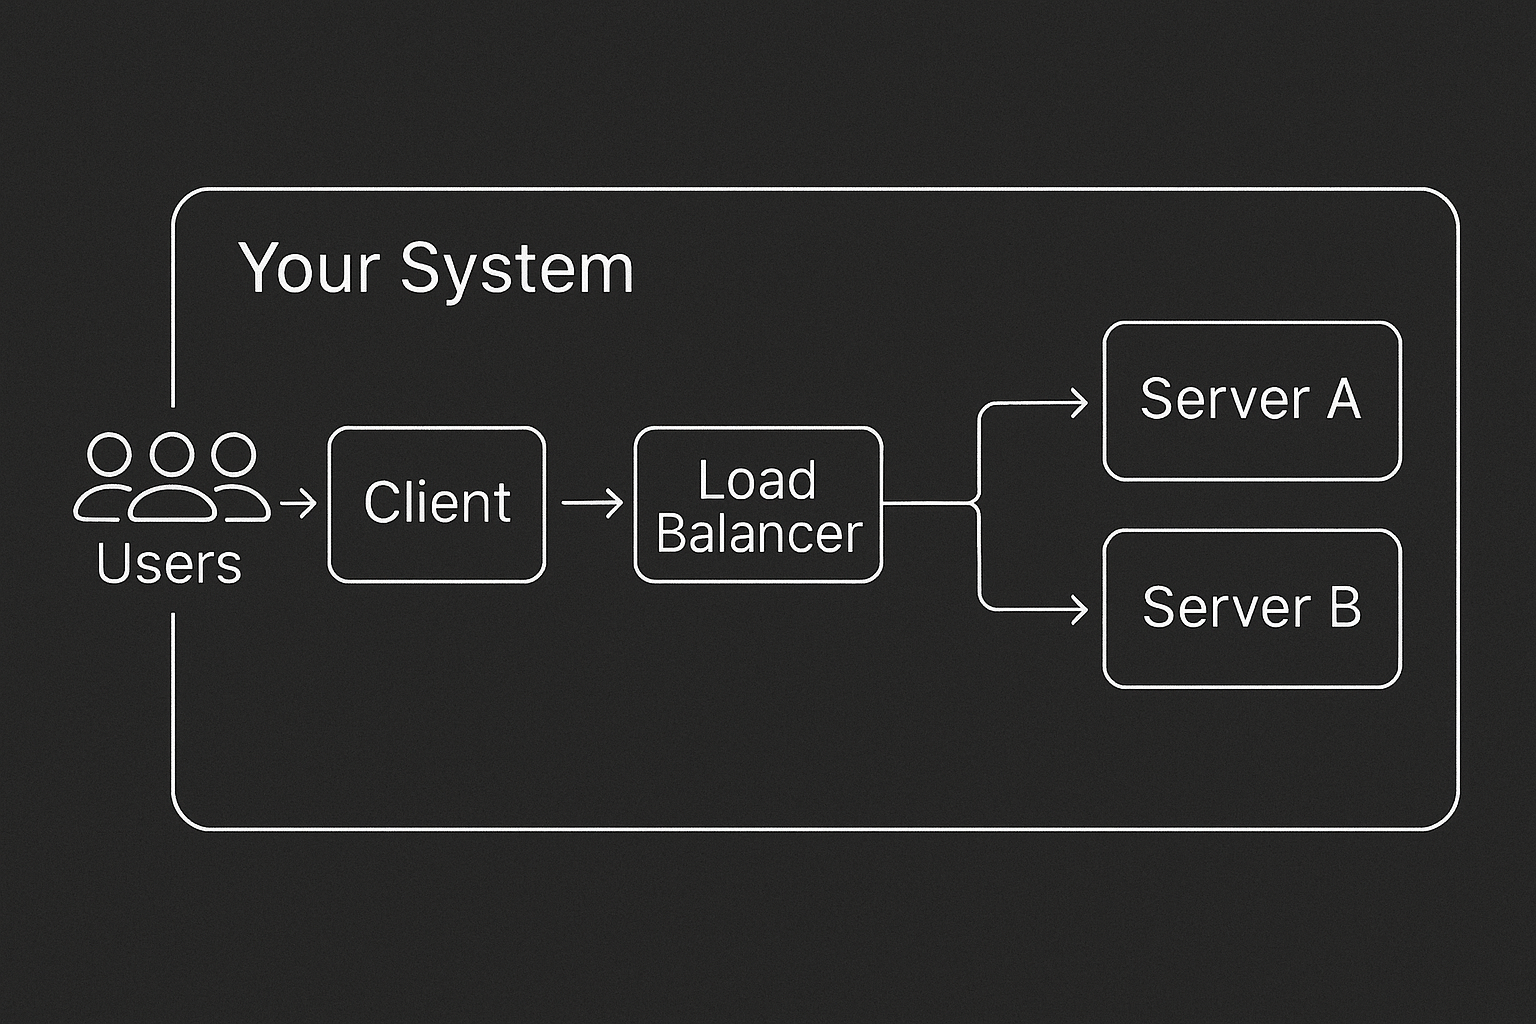
AsyncFlow represents your system as a directed graph of components, for example: clients, load balancers, servers—connected by network edges with configurable latency models. Each server is event-loop aware: CPU work blocks, RAM stays allocated, and I/O yields the loop, just like real async frameworks. You can define topologies via YAML or a Pythonic builder.
Run the simulation and inspect the outputs:
Predicting how an async system will behave under real-world load is notoriously hard. Teams often rely on rough guesses, over-provisioning, or painful production incidents. AsyncFlow replaces guesswork with scenario-driven simulations: you declare the conditions (network RTT, jitter, resource limits, injected failures) and observe the consequences on latency, throughput, and resource pressure.
AsyncFlow doesn’t need your backend to exist. You can model your architecture with YAML or Python, run simulations, and explore bottlenecks before writing production code. This scenario-driven approach lets you stress-test scaling strategies, network assumptions, and failure modes safely and repeatably.
With scenario simulations, AsyncFlow helps answer questions such as:
- How does p95 latency shift if active users double?
- What happens when a client–server edge suffers a 20 ms spike for 60 seconds?
- Will a given endpoint pipeline — CPU parse → RAM allocation → DB I/O — still meet its SLA at 40 RPS?
- How many sockets and how much RAM will a load balancer need under peak conditions?
Install from PyPI: pip install asyncflow-sim
- Python 3.12+ (tested on 3.12, 3.13)
- OS: Linux, macOS, or Windows
- Installed automatically (runtime deps): SimPy (DES engine), NumPy, Matplotlib, Pydantic + pydantic-settings, PyYAML.
Save as my_service.yml.
The full YAML schema is explained in docs/guides/yaml-input-builder.md and validated by Pydantic models (see docs/internals/simulation-input.md).
rqs_input:
  id: generator-1
  avg_active_users: { mean: 100, distribution: poisson }
  avg_request_per_minute_per_user: { mean: 100, distribution: poisson }
  user_sampling_window: 60

topology_graph:
  nodes:
    client: { id: client-1 }

    servers:
      - id: app-1
        server_resources: { cpu_cores: 1, ram_mb: 2048 }
        endpoints:
          - endpoint_name: /api
            # Realistic pipeline on one async server:
            # - 2 ms CPU parsing (blocks the event loop)
            # - 120 MB RAM working set (held until the request leaves the server)
            # - 12 ms DB-like I/O (non-blocking wait)
            steps:
              - kind: initial_parsing
                step_operation: { cpu_time: 0.002 }
              - kind: ram
                step_operation: { necessary_ram: 120 }
              - kind: io_db
                step_operation: { io_waiting_time: 0.012 }

  edges:
    - { id: gen-client,   source: generator-1, target: client-1,
        latency: { mean: 0.003, distribution: exponential } }
    - { id: client-app,   source: client-1,   target: app-1,
        latency: { mean: 0.003, distribution: exponential } }
    - { id: app-client,   source: app-1,      target: client-1,
        latency: { mean: 0.003, distribution: exponential } }

sim_settings:
  total_simulation_time: 300
  sample_period_s: 0.05
  enabled_sample_metrics:
    - ready_queue_len
    - event_loop_io_sleep
    - ram_in_use
    - edge_concurrent_connection
  enabled_event_metrics:
    - rqs_clock
Prefer building scenarios in Python? There’s a Python builder with the same semantics (create nodes, edges, endpoints programmatically). See docs/guides/python-builder.md.
Save as run_my_service.py.
from __future__ import annotations
from pathlib import Path
import simpy
import matplotlib.pyplot as plt
from asyncflow.runtime.simulation_runner import SimulationRunner
from asyncflow.metrics.analyzer import ResultsAnalyzer
def main() -> None:
script_dir = Path(__file__).parent
yaml_path = script_dir / "my_service.yml"
out_path = script_dir / "my_service_plots.png"
env = simpy.Environment()
runner = SimulationRunner.from_yaml(env=env, yaml_path=yaml_path)
res: ResultsAnalyzer = runner.run()
# Print a concise latency summary
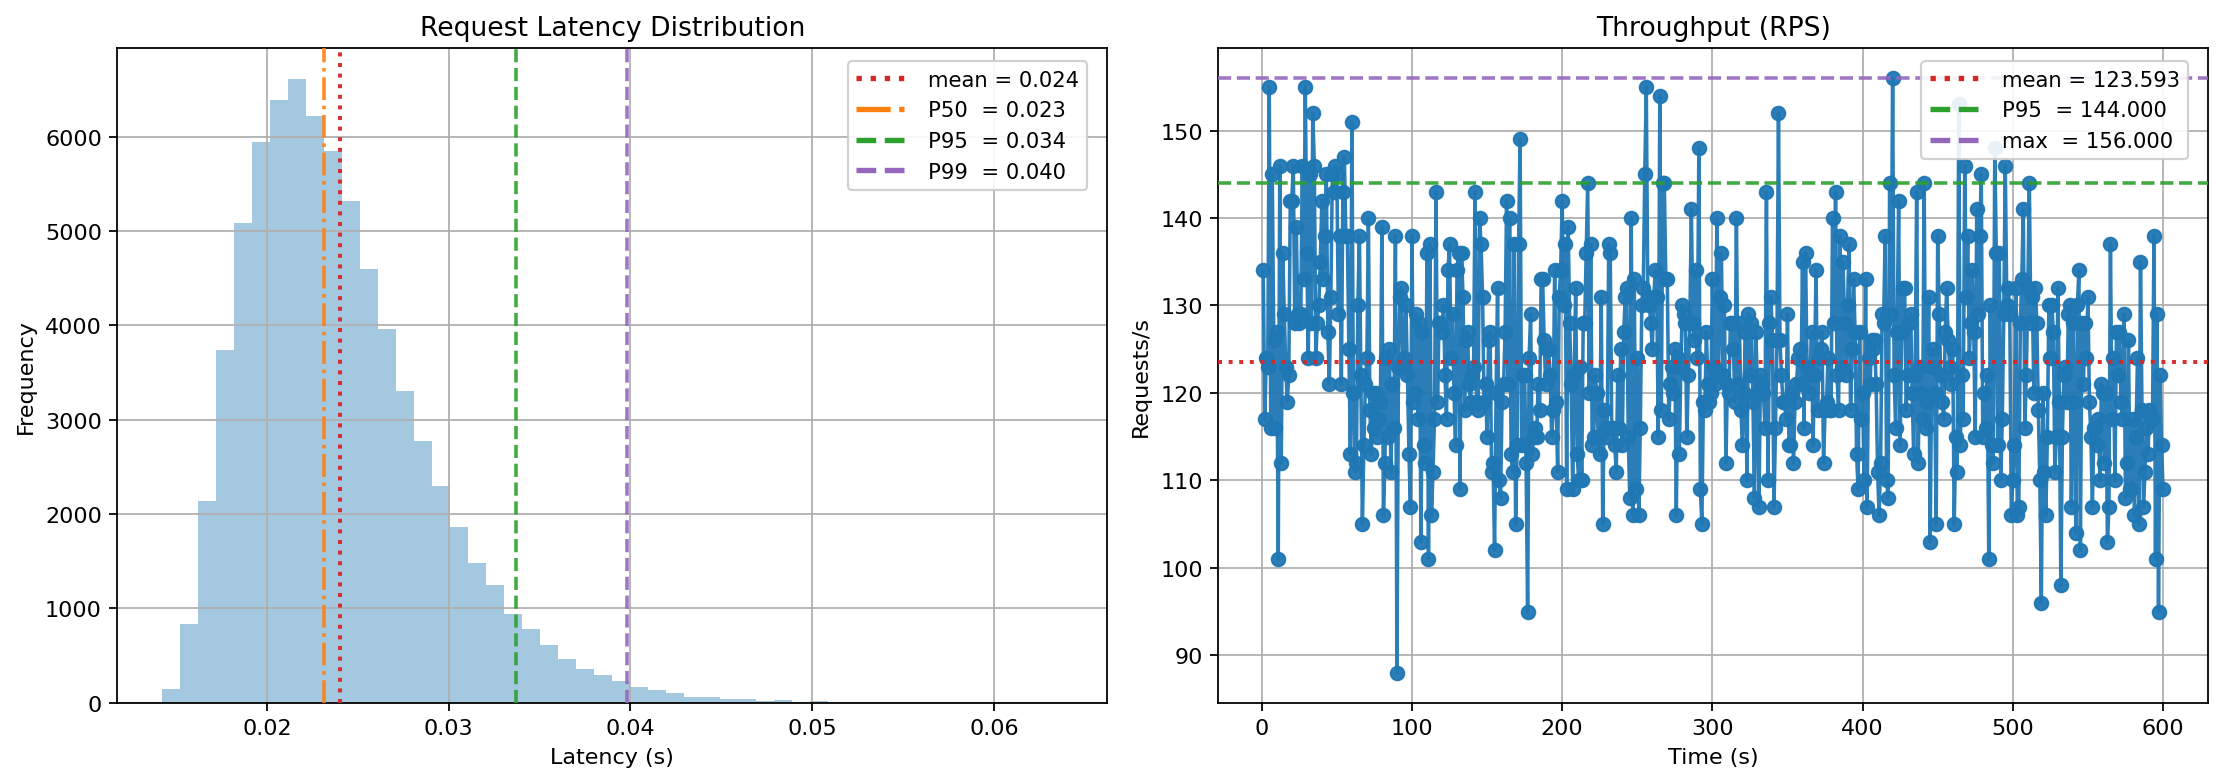
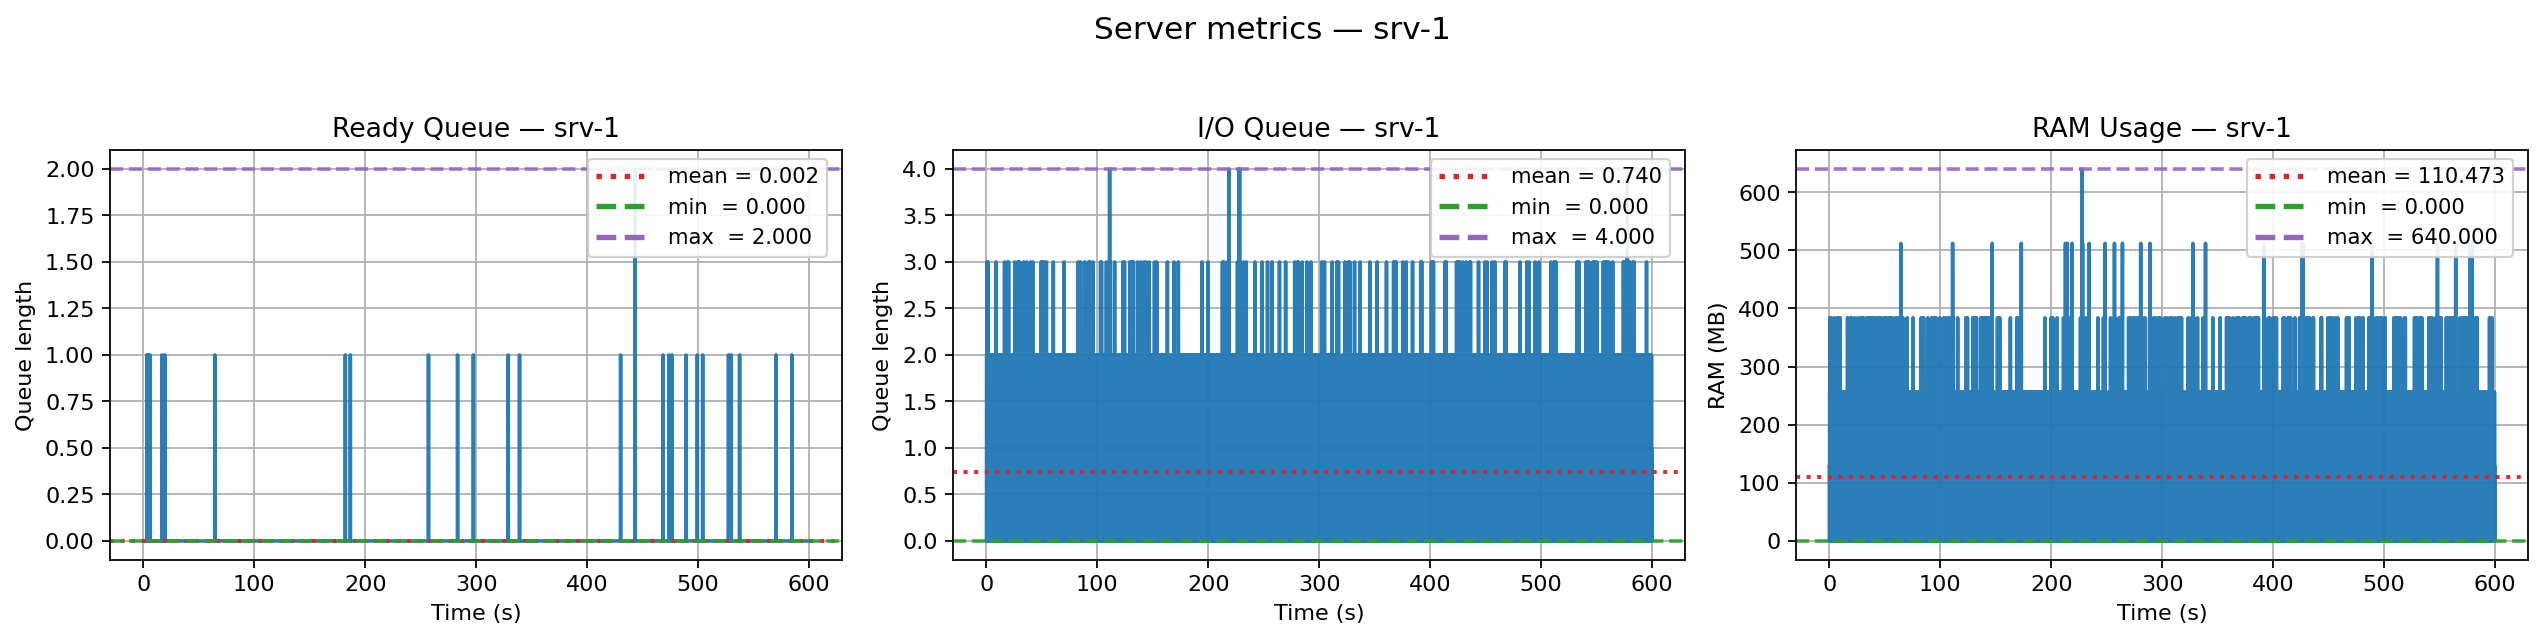
print(res.format_latency_stats())
# 2x2: Latency | Throughput | Ready (first server) | RAM (first server)
fig, axes = plt.subplots(2, 2, figsize=(12, 8), dpi=160)
res.plot_latency_distribution(axes[0, 0])
res.plot_throughput(axes[0, 1])
sids = res.list_server_ids()
if sids:
sid = sids[0]
res.plot_single_server_ready_queue(axes[1, 0], sid)
res.plot_single_server_ram(axes[1, 1], sid)
else:
for ax in (axes[1, 0], axes[1, 1]):
ax.text(0.5, 0.5, "No servers", ha="center", va="center")
ax.axis("off")
fig.tight_layout()
fig.savefig(out_path)
print(f"Plots saved to: {out_path}")
if __name__ == "__main__":
main()Run the python script
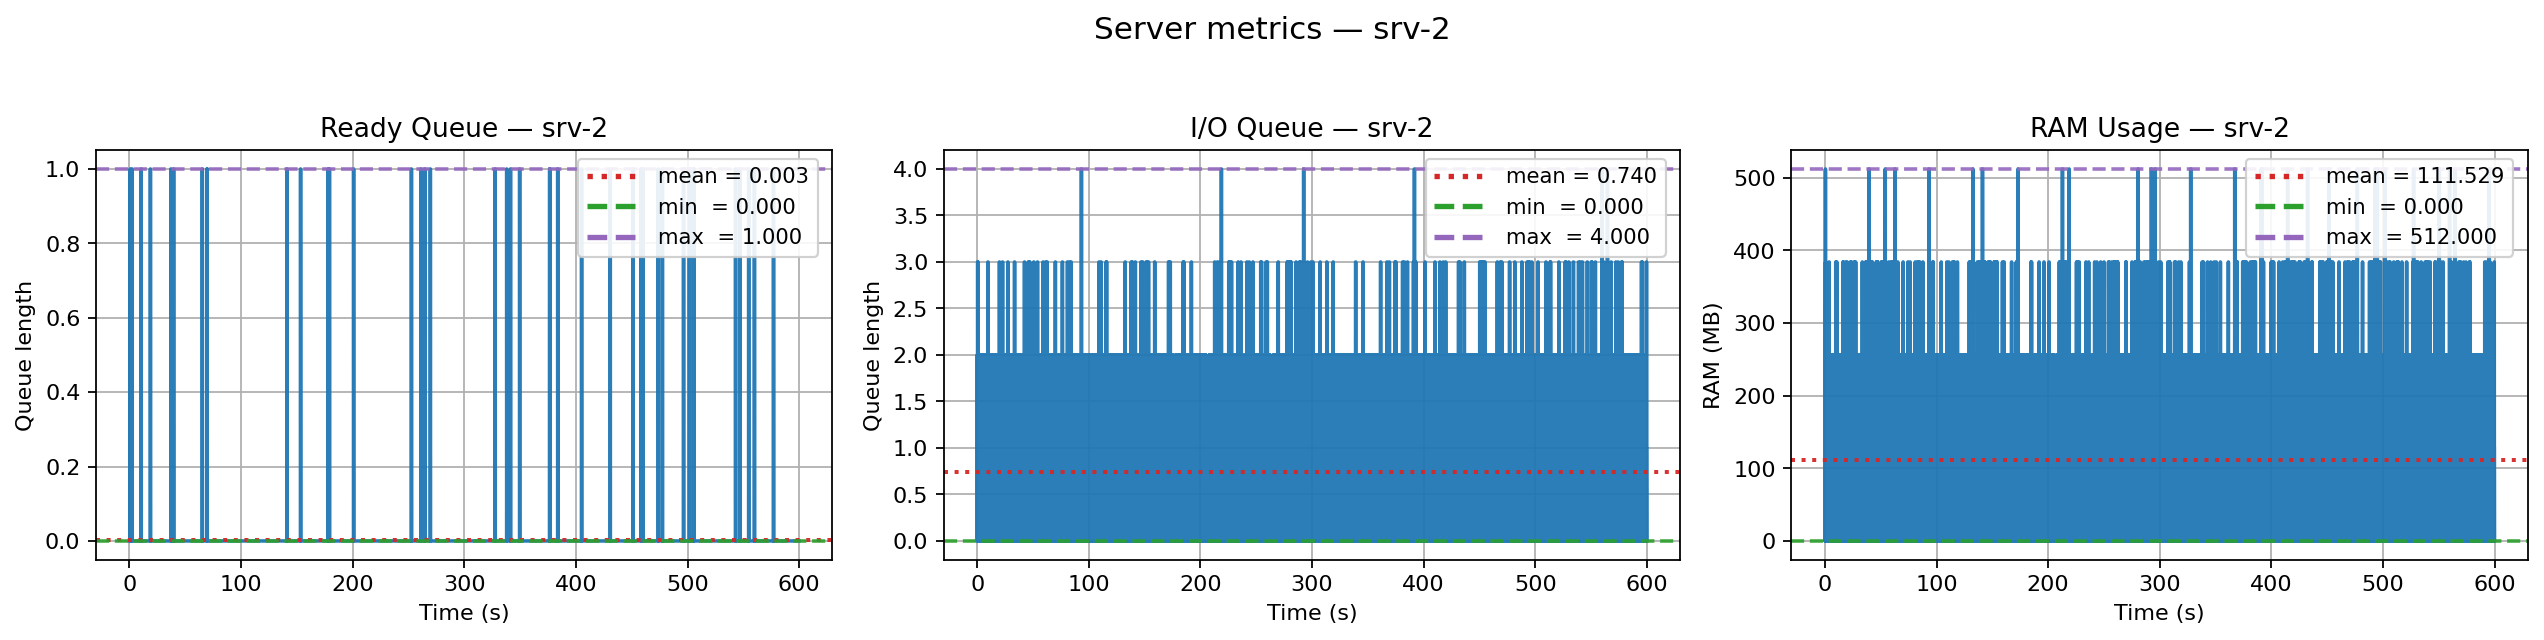
You’ll get latency stats in the terminal and a PNG with four charts (latency distribution, throughput, server queues, RAM usage).
Want more?
For ready-to-run scenarios including examples using the Pythonic builder and multi-server topologies, check out the examples/ directory in the repository.
If you want to contribute or run the full test suite locally, follow these steps.
- Python 3.12+ (tested on 3.12, 3.13)
- OS: Linux, macOS, or Windows
- Runtime deps installed by the package: SimPy, NumPy, Matplotlib, Pydantic, PyYAML, pydantic-settings
Prerequisites: Git, Python 3.12+ in PATH, curl (Linux/macOS/WSL), PowerShell 7+ (Windows)
git clone https://github.com/AsyncFlow-Sim/AsyncFlow.git
cd AsyncFlow
From the repo root, run the one-shot post-clone setup:
Linux / macOS / WSL
bash scripts/dev_setup.shWindows (PowerShell)
# If scripts are blocked by policy, run this in the same PowerShell session:
# Set-ExecutionPolicy -Scope Process -ExecutionPolicy Bypass
.\scripts\dev_setup.ps1
What this does (concise):
- Ensures Poetry is available (installs if missing).
- Uses a project-local
.venv. - Removes
poetry.lockfor a clean dependency resolve (dev policy). - Installs the project with dev extras.
- Runs ruff, mypy, and pytest (with coverage).
Quick sanity check after setup:
poetry --version
poetry run python -V
Note (lock policy):
dev_setupintentionally removespoetry.lockto avoid cross-platform conflicts during development.
Scripts (for quick access):
scripts/dev_setup.sh/scripts/dev_setup.ps1scripts/quality_check.sh/scripts/quality_check.ps1scripts/run_tests.sh/scripts/run_tests.ps1
Linux / macOS / WSL
bash scripts/quality_check.shWindows (PowerShell)
.\scripts\quality_check.ps1Runs ruff (lint/format check) and mypy on src and tests.
Linux / macOS / WSL
bash scripts/run_tests.shWindows (PowerShell)
.\scripts\run_tests.ps1Linux / macOS / WSL
bash scripts/run_sys_tests.shWindows (PowerShell)
.\scripts\run_sys_tests.ps1Executes pytest with a terminal coverage summary (no XML, no slowest list).
AsyncFlow is still in alpha. The current release has some known limitations that are already on the project roadmap:
-
Network model — only base latency + jitter/spikes.
Bandwidth, queuing, and protocol-level details (HTTP/2 streams, QUIC, TLS handshakes) are not yet modeled. -
Server model — single event loop per server.
Multi-process or multi-threaded execution is not yet supported. -
Endpoint flows — endpoints are linear pipelines.
Branching/fan-out (e.g. service calls to DB + cache) will be added in future versions. -
Workload generation — stationary workloads only.
No support yet for diurnal patterns, feedback loops, or adaptive backpressure. -
Overload policies — no explicit handling of overload conditions.
Queue caps, deadlines, timeouts, rate limiting, and circuit breakers are not yet implemented. -
Sampling cadence — very short events may be missed if the
sample_period_sis too large.
📌 See the ROADMAP for planned features and upcoming milestones.