Example Usage and Interpretation
-
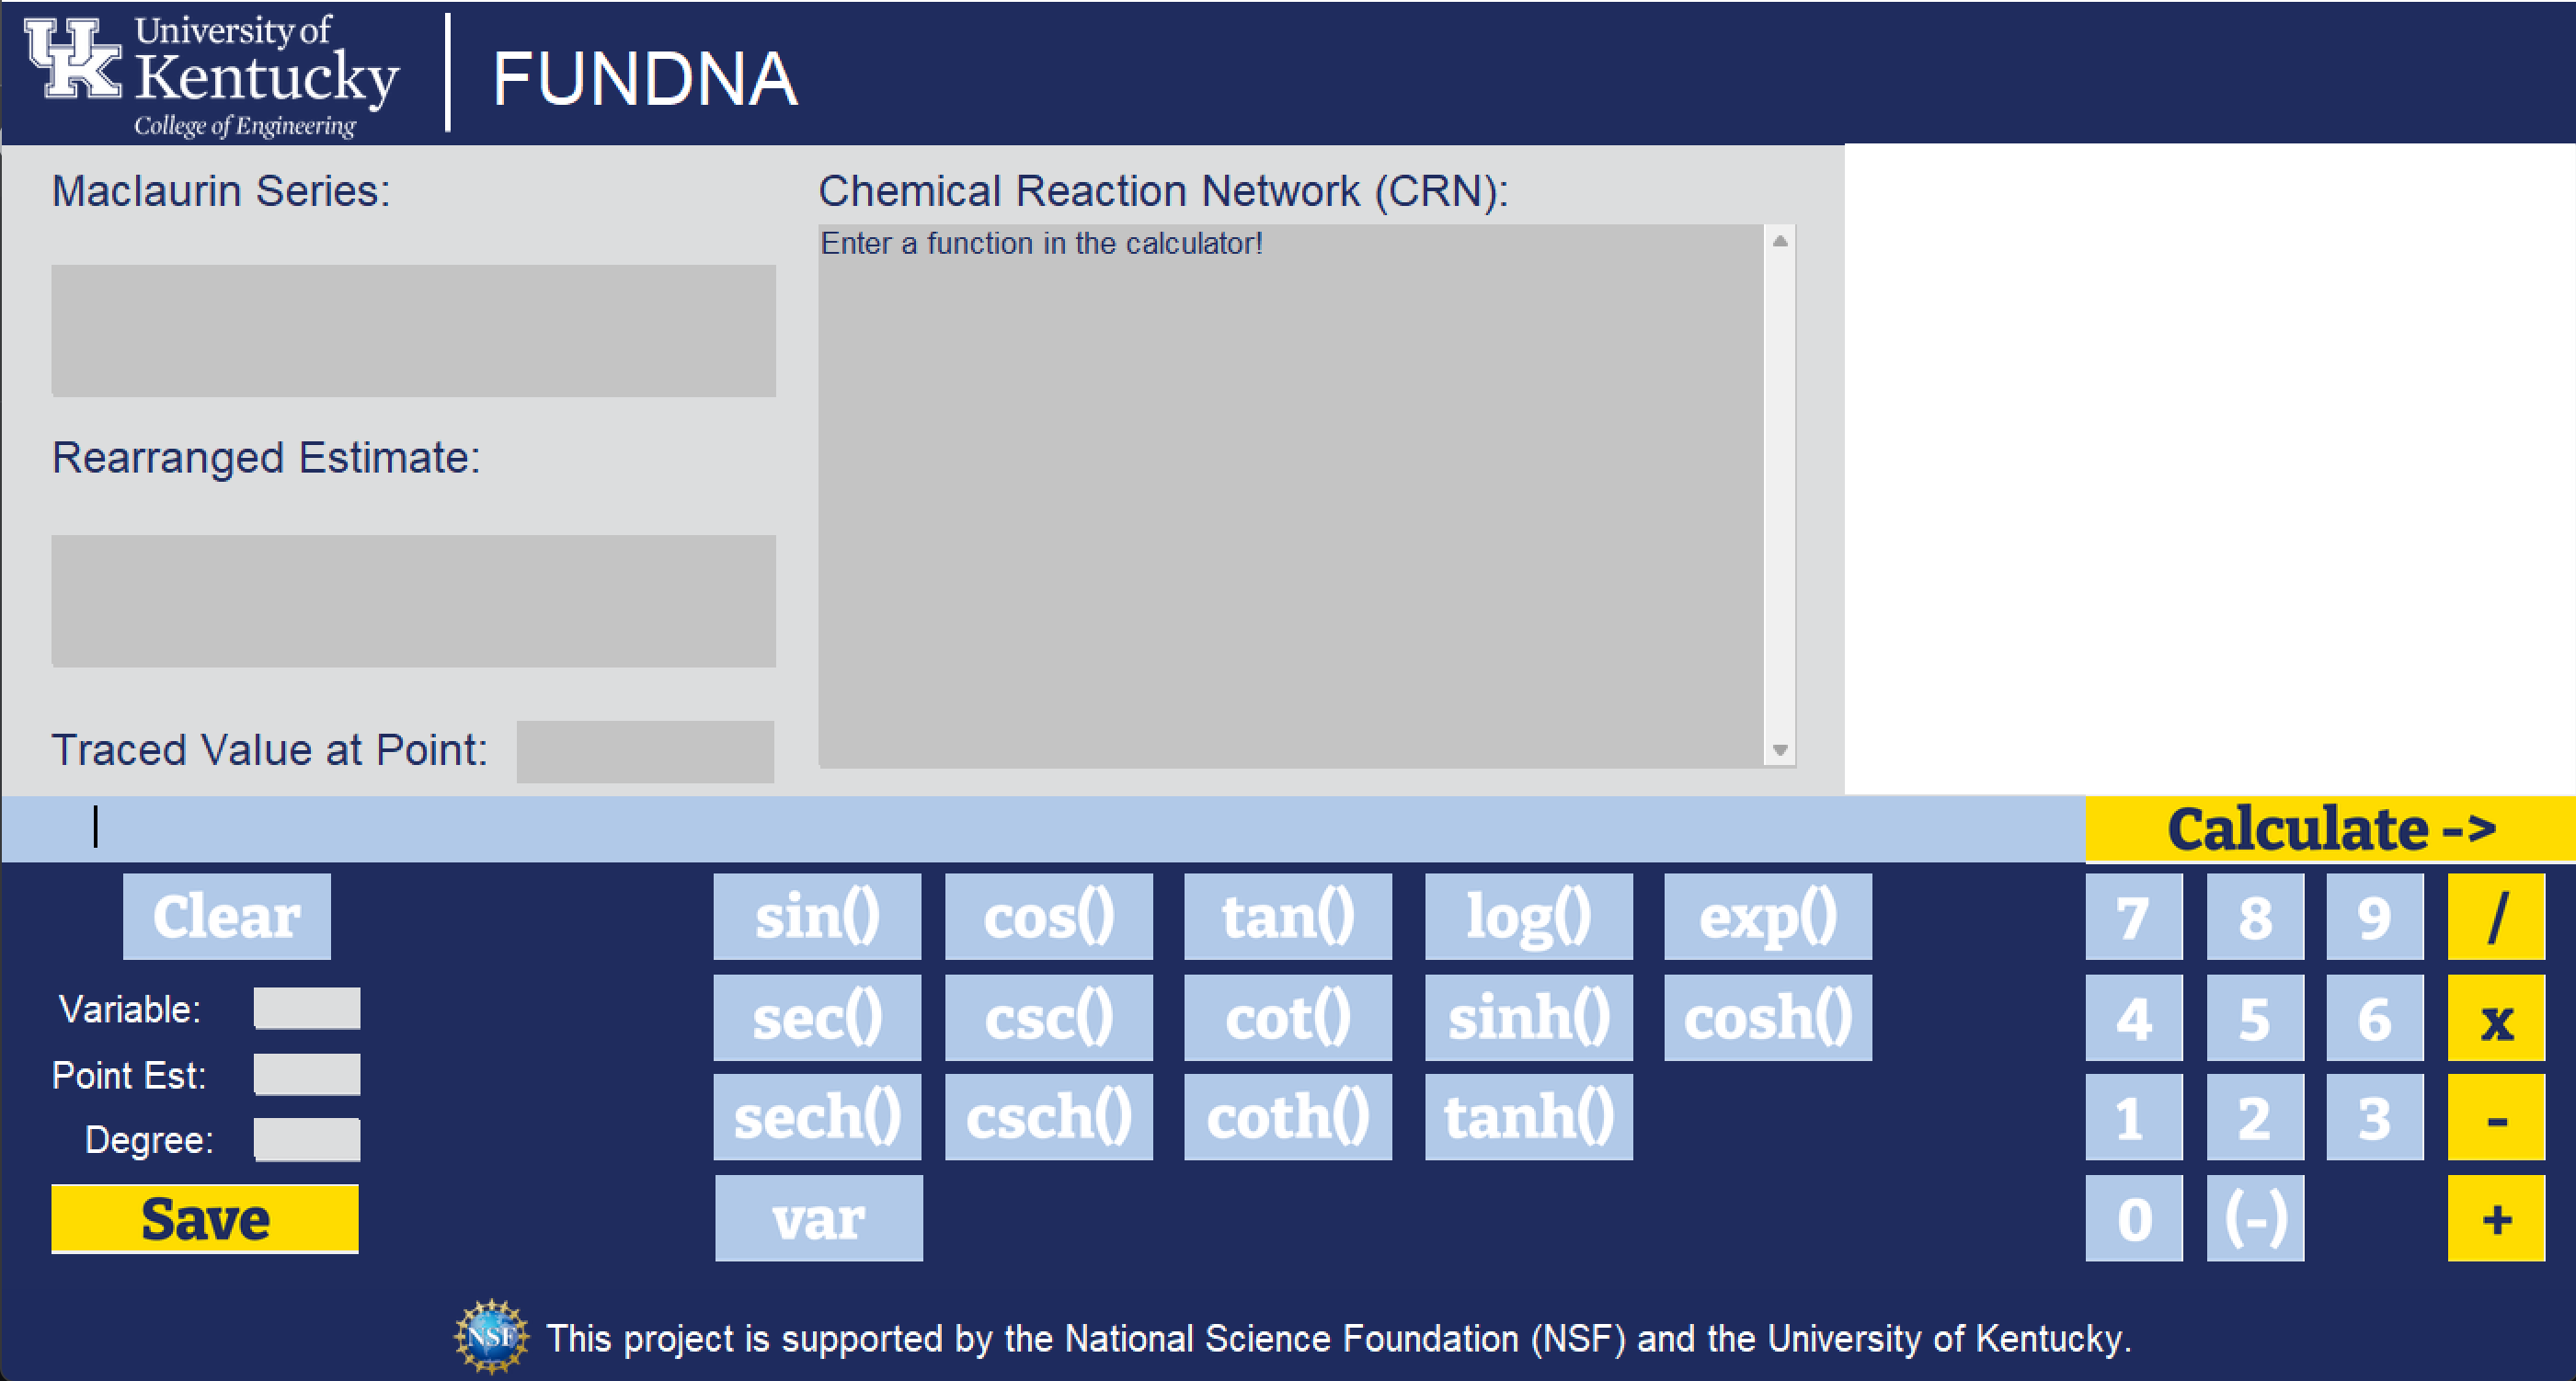
Launch the Function Designer GUI
-
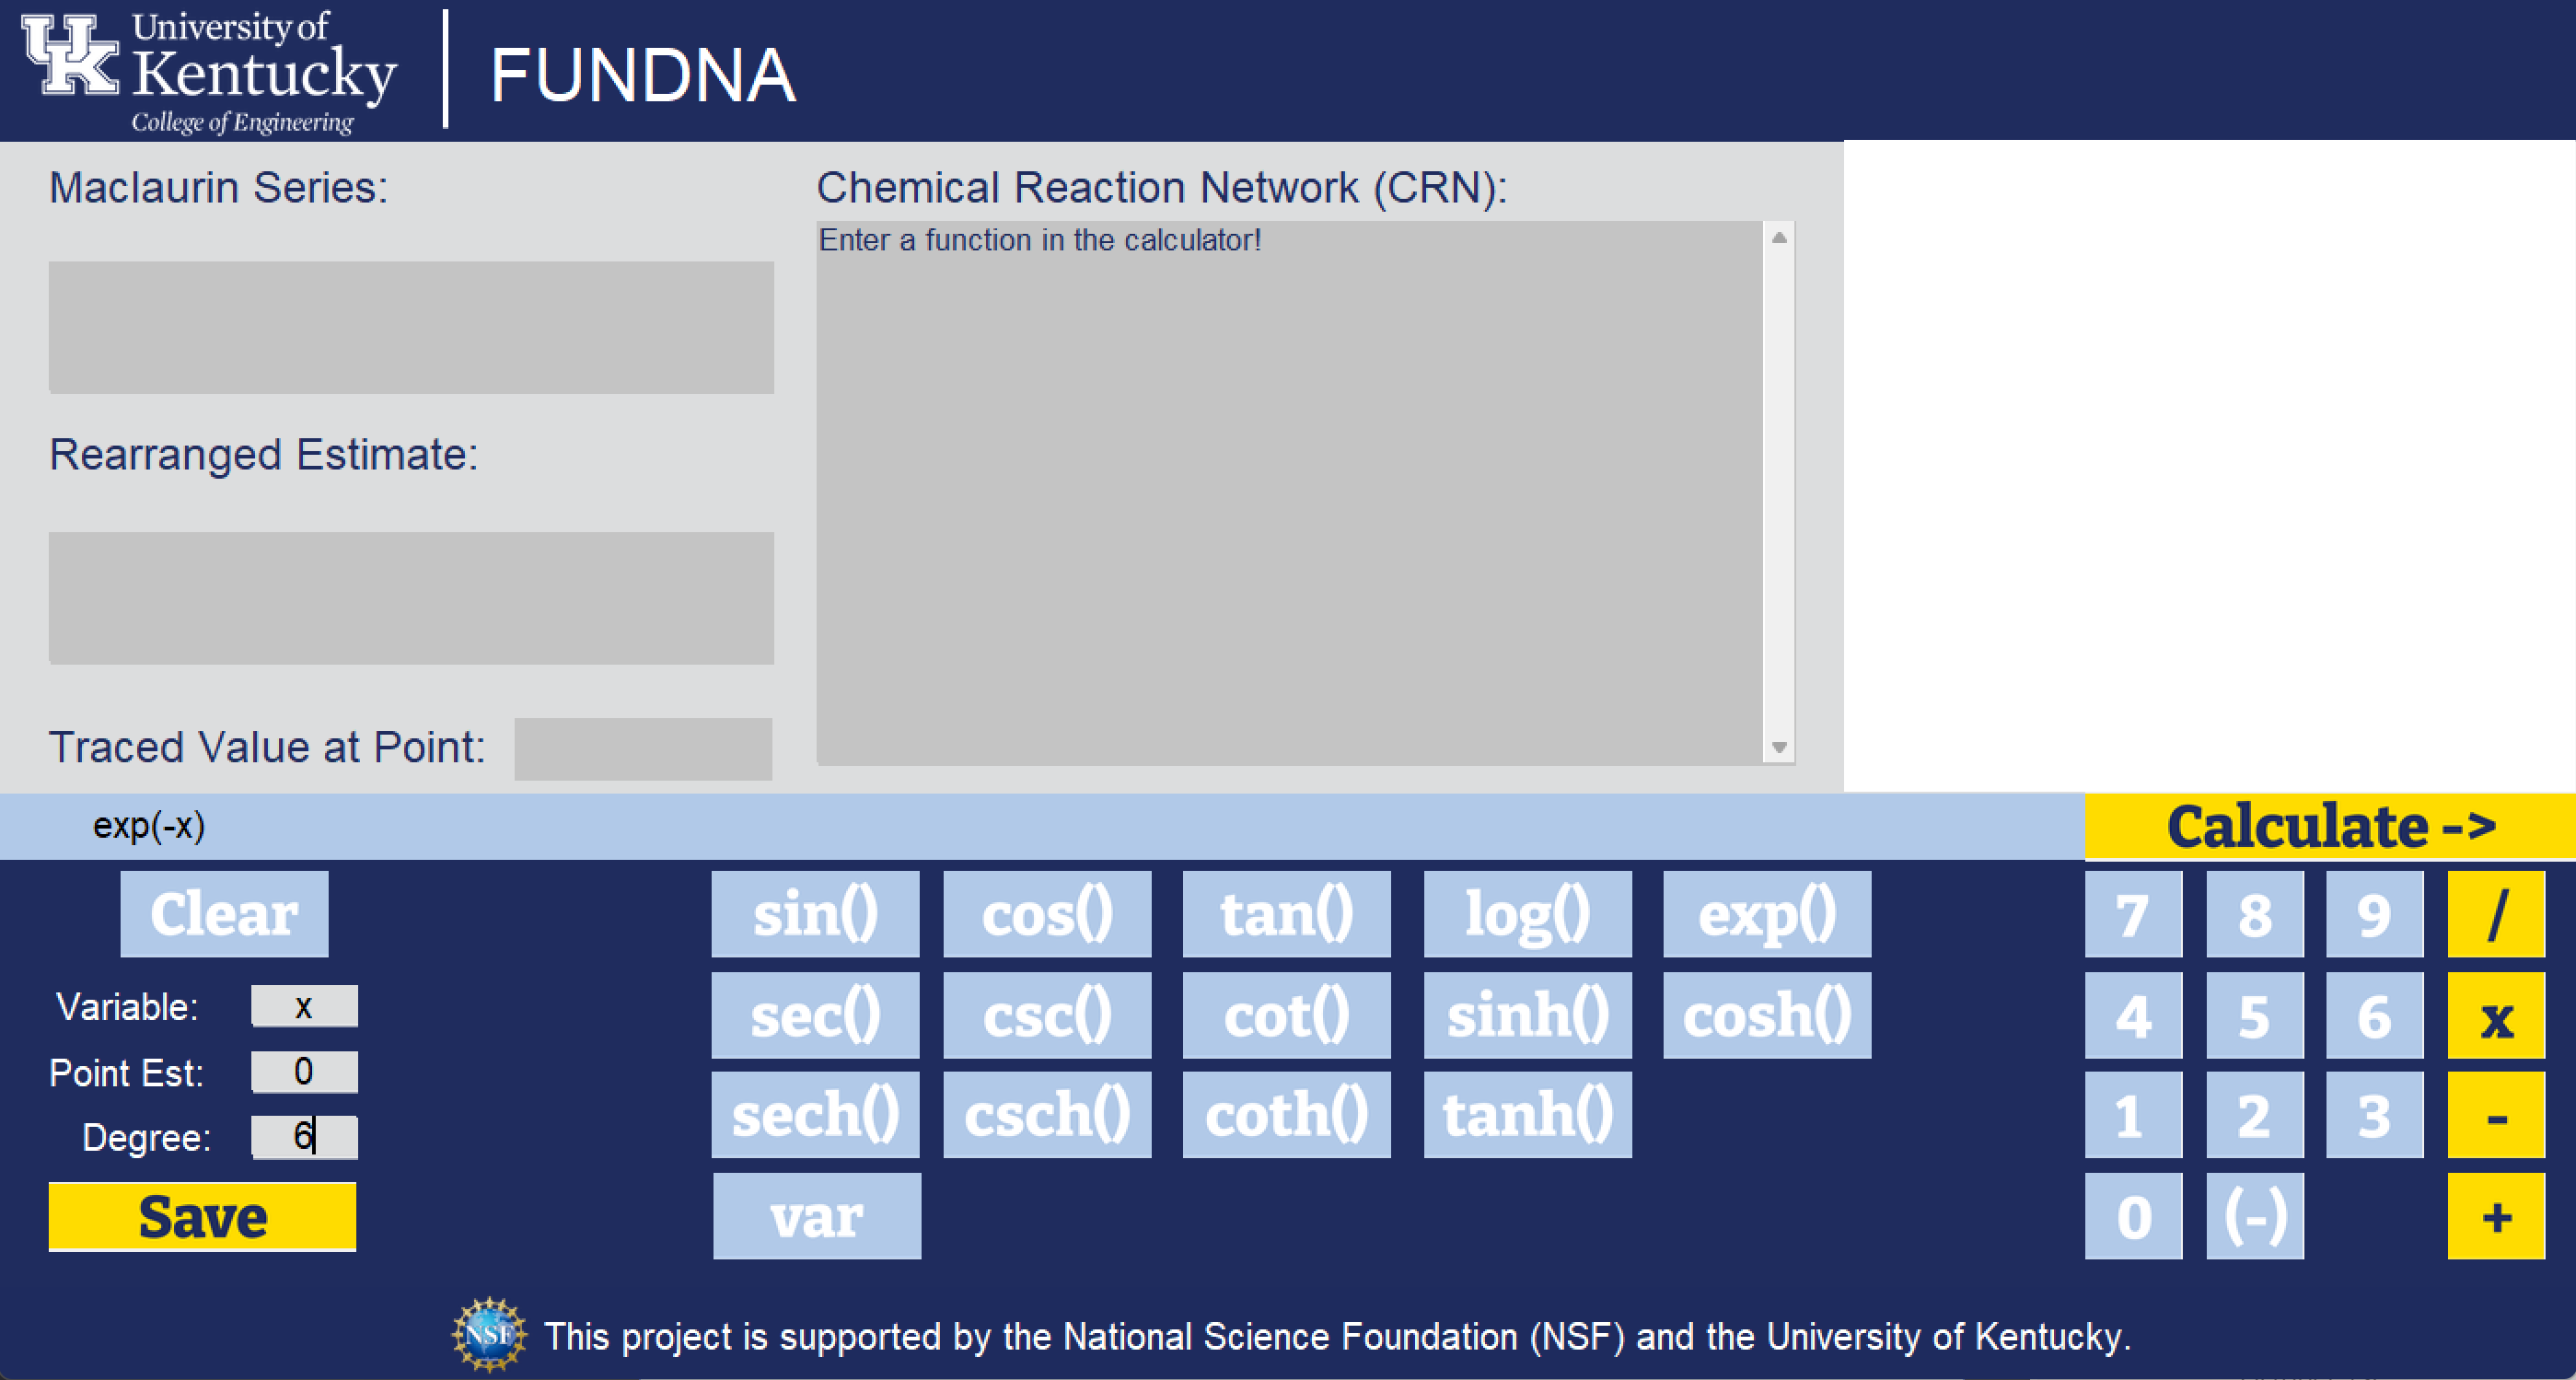
Enter your function and its specifications
- Please make sure it fits the specifications on the Software Usage and Notes Page.
-
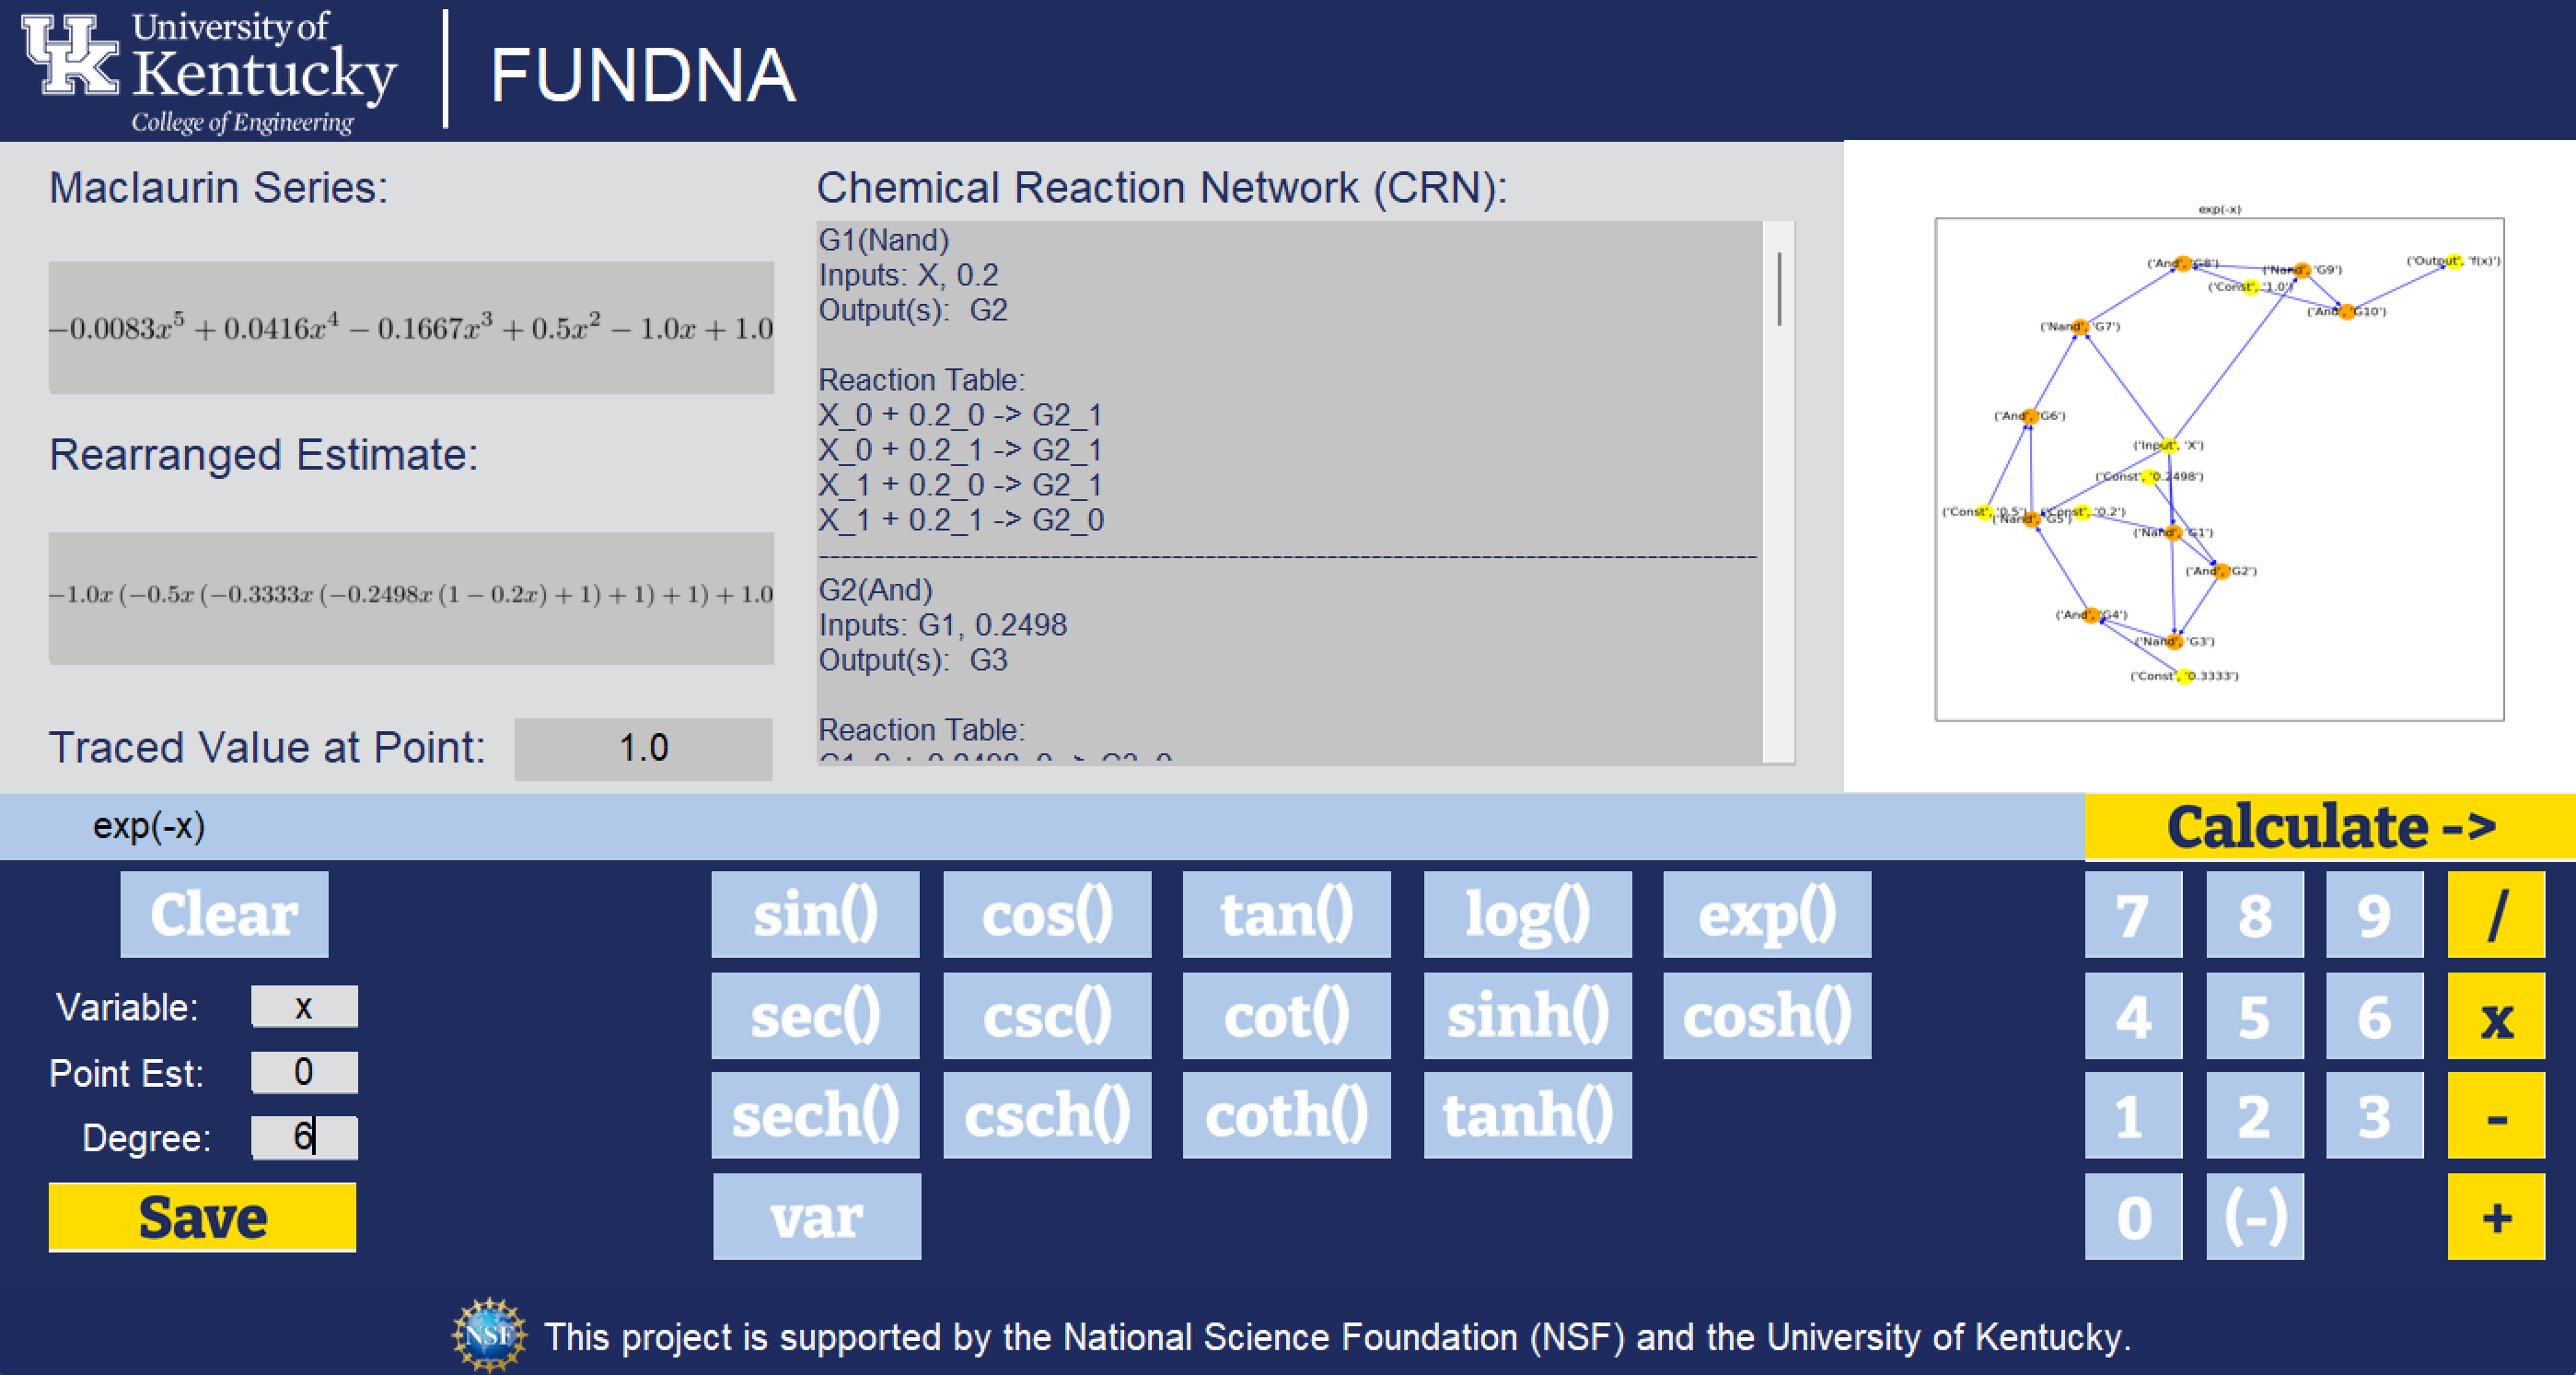
Press "Calculate"


-
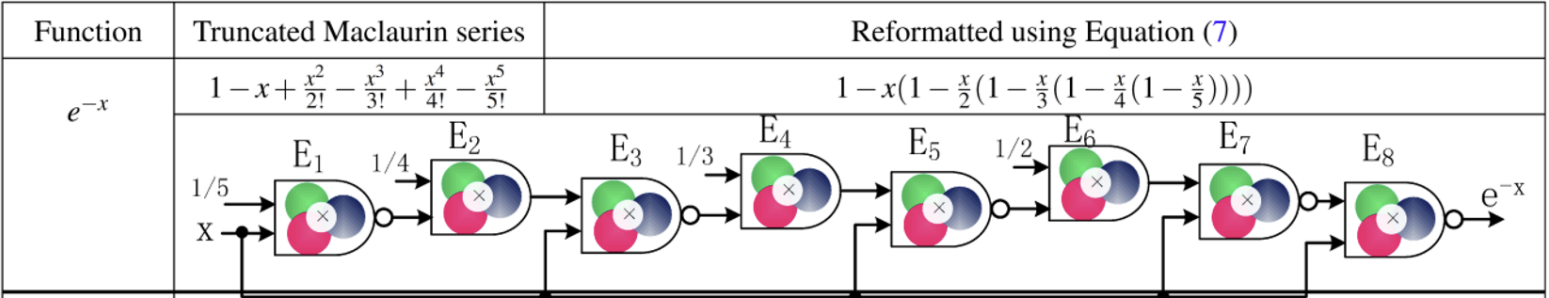
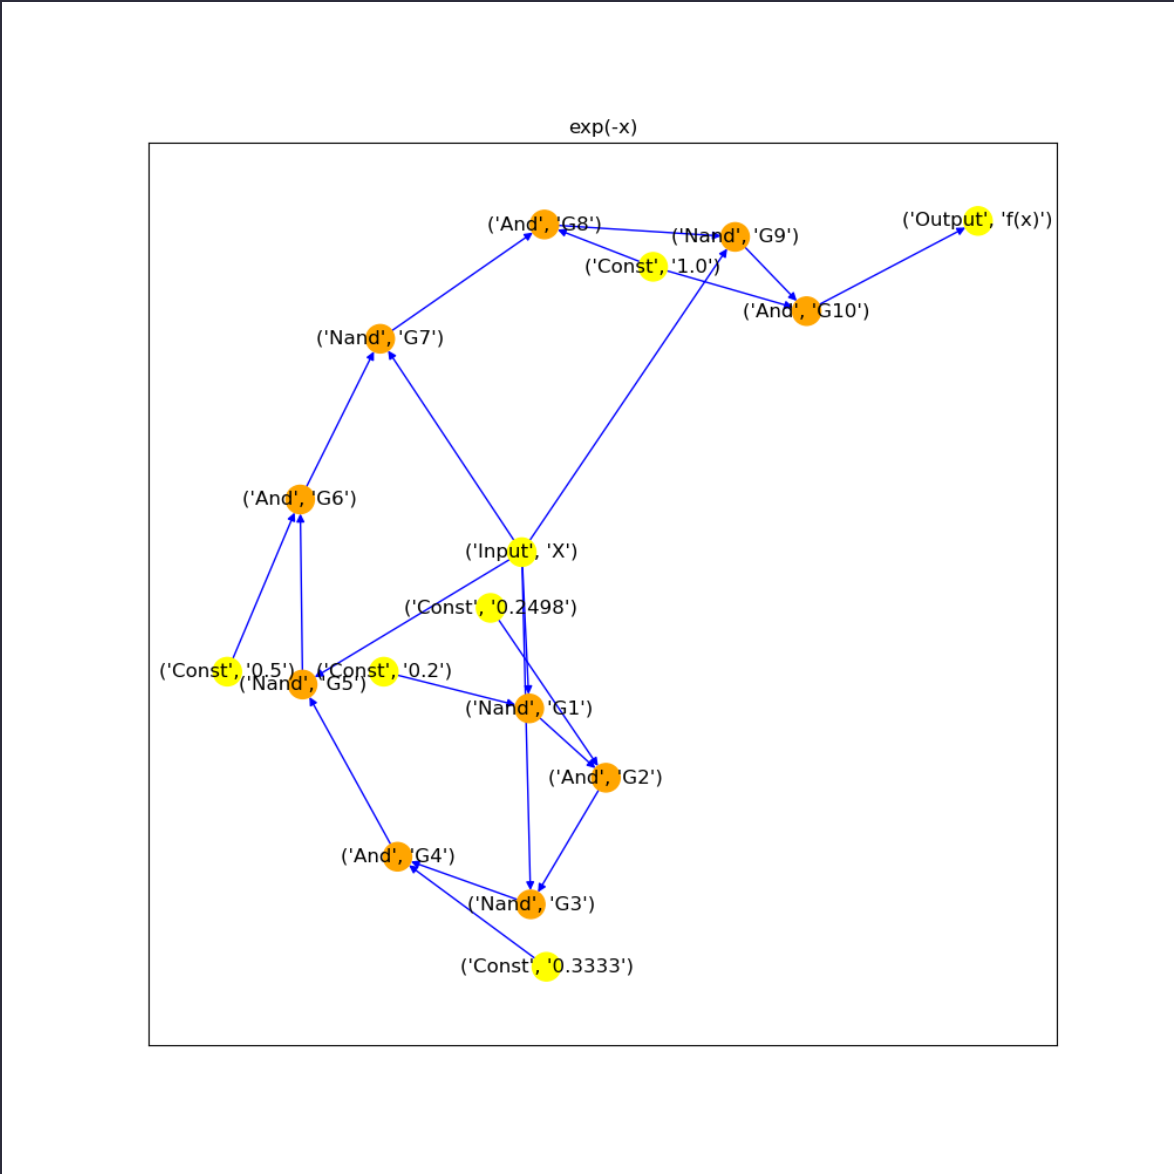
This shows a generated NetworkX graph of a circuit diagram in which there are 2 inputs and 1 output for each gate (Orange) with constants and variables as inputs (Yellow). For example, gate G1 shows input X NAND 0.2 (which is 1/5 in the Expected Results section) and output to gate G2. Following that, gate G2 uses the output of G1 to AND it with 0.2498 (estimate of 1/4 in the Expected Results section). This process continues to get to the yellow output, f(x).
-
An important note is that this diagram shows using an AND gate with 1, which is essentially wasteful in most cases. Therefore, this 10-gate circuit diagram is really 8 gates. This is to be fixed in a later version, but please be cautious for as long as this note stays.
This project uses DNA as logic gates to create a Chemical Reaction Network (CRN) that allows us to compute values of different mathematical functions.
- Project Basis and Horner's Expansion Scholarly Article: https://www.nature.com/articles/s41598-018-26709-6
- Double-NAND Expansion Scholarly Article DOI: http://dx.doi.org/10.1145/3060403.3060410
Project Lead
Dr. Sayed Ahmad Salehi
Assistant Professor
Department of Electrical and Computer Engineering
Director of Computing with Unconventional Technologies (CUT) Lab
University of Kentucky | http://salehi.engr.uky.edu/
This project is supported by the National Science Foundation (NSF) and the University of Kentucky's College of Engineering.