This is the backend for Wazimap-NG.
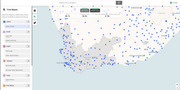
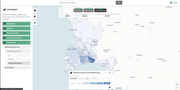
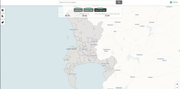
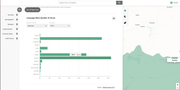
Wazimap-NG is the next version of Wazimap. It provides a platform for users to bind tabular data to spatial boundaries in order create curated views of datasets. Yes - that's probably too vague a description to understand what it is. Hopefully the images below provide a better description:
See a link to the beta site here: https://beta.youthexplorer.org.za.
You can find the backend code in this repository. The frontend is available here: https://github.com/openupsa/wazimap-ng-ui.
The main new features are:
- Admins now have more flexibility when it comes to loading data. This includes uploading massive datasets and then slicing and dicing in the backend rather than pre-preparing datasets beforehand.
- Point data is now fully integrated as a first-class spatial object.
- Choropleths built into the main view. These were hidden behind multiple clicks in the previous version.
- One platform can host multiple profiles off the same database.
- The Rich data view allows richer disaggregation of indicators.
- The administrator can configure the view to use custom basemaps, colours, and other UI settings.
- Arbitrary spatial boundaries and hierarchies can be loaded onto the same server.
- Toggling of overlapping boundary layers such as switching between wards and mainplaces which typically cover the same areas.
- Integration into third-party data sources for realtime data feeds.
There is no shortage of mapping software available, both commerical and open-source. Wazimap focuses on providing a platform for data custodians to showcase their datasets and mashing them up with public data. The most similar tool that we have found is the excellent GeoNode. We feel that approach to publishing data is significantly different enough to warrant a separate project.
Version 0.8 is due soon and will fix bugs that currently don't have workarounds. We'll publish the 1.0 roadmap soon.
- WFS endpoint for publishing data to other GIS software
- Pluggable data visualisations
- Better handling of geography hierarchies.
- Improved handling of temporal and other types of non-census-like data.
- Speed improvements
- A large standard database of public datasets.
Local development is normally done inside docker-compose so that the supporting services are available and the environment is very similar to how the application is run in production.
Make docker-compose start the supporting services
docker-compose run --rm web python wait_for_postgres.py
docker-compose run --rm web python manage.py collectstatic --no-input
Migrate, load development data and start the app
docker-compose run --rm web python manage.py migrate
docker-compose run --rm web python manage.py loaddata demodata.json
docker-compose up
Run the tests
docker-compose run --rm -e DJANGO_CONFIGURATION=Test web pytest /app/tests
Run Django manage commands inside docker-compose, e.g. create a superuser:
docker-compose run --rm web python manage.py createsuperuser
These are works in progress:
Contributions are welcome - we are working towards making this process easier. New development takes place in the staging branch
This project is the next iteration of a number of excellent projects starting with CensusReporter and Wazimap that followed it. Special thanks to William Bird from Media Monitoring Africa whose initial idea (and funding) it was to build a tool to help journalists better understand areas they were reporting on. Also thanks to Chris Berens from VPUU who directed funding to help kickstart this new build. Finally, all of the amazing spatial software and tools developed by one of the most dedicated open source communities out there.