
A TUI (Text-based User Interface) for monitoring network usage in real-time, with support for data limits and desktop notifications.
- Real-time Dashboard: A clean, terminal-based dashboard showing total download, upload, and current speeds.
- Historical Analytics: View your usage trends for the last 24 hours with hourly breakdown, peak hour identification, and traffic statistics including download/upload percentages and average usage.
- Crash-Proof Database: Powered by SQLite with Write-Ahead Logging (WAL) to ensure your data is safe even if your PC loses power.
- Data Cap Monitoring: Set a data limit (e.g.,
10GB) and see your usage on a real-time progress bar. - Standalone Binaries: Available as a single .exe or binary file, that way no Python installation is required but no.
Note: Double-clicking the file launches the Basic Monitor (all interfaces, no limit). To set Data Caps or Filters, run the file via Command Prompt/Terminal.
- Smart Units: Toggle between Bits (Mbps) and Bytes (MB/s) instantly with Ctrl+B to match ISP speeds or file sizes.
- Desktop Notifications: Get native desktop notifications when you hit 80% and 100% of your data limit.
- Live Activity Log: An interactive, scrolling log of all network activity, updated every second.
- Command Palette & Dark Mode: A modern TUI experience with a built-in command palette (
Ctrl+P) and dark mode support (Ctrl+D). - Auto-Migration: Automatically detects and imports data from older versions (
quota.json) so you never lose history. - Cross-Platform: Runs perfectly on Windows, macOS, and Linux.
No Python required.
- Download
netwatch-windows.exefrom the Releases Page. - Basic Usage: Double-click the file to start monitoring immediately.
- Advanced Usage: To set limits (e.g.,
-l 10GB), open your terminal (PowerShell/CMD) in the download folder and run:.\netwatch-windows.exe -l 10GB
Designed for Python 3.8+ and distributed on PyPI for simple installation with pip.
pip install netwatchpyOnce installed, the netwatch command will be available in your terminal.
To start the monitor (monitors all interfaces):
netwatchTo see all available options and help:
netwatch --helpYou can control the monitor with these arguments:
-
-h,--help- Shows the help message and all options.
-
-i INTERFACE,--interface INTERFACE- Monitors a single, specific network interface (e.g., -i "Wi-Fi"). Defaults to "all".
-
-l LIMIT,--limit LIMIT- Sets a data cap and shows a progress bar (e.g., -l "10GB" or -l "500MB").
-
--log LOG- Saves all network activity to a specified CSV file (e.g., --log "usage.csv").
Set a 10GB data limit:
netwatch -l "10GB"Monitor a specific interface ("Wi-Fi") and log to a file:
netwatch -i "Wi-Fi" --log "my_usage.csv"-
Ctrl+p: Open the Command Palette -
Ctrl+d: Toggle Dark / Light Mode -
Ctrl+b: Toggle Bits/Bytes (Mbps ↔ MB/s) -
r: Refresh the history chart -
Ctrl+r: Reset all counters and history to zero -
Ctrl+s: Show save status (Data is auto-saved) -
Ctrl+q: Quit the application
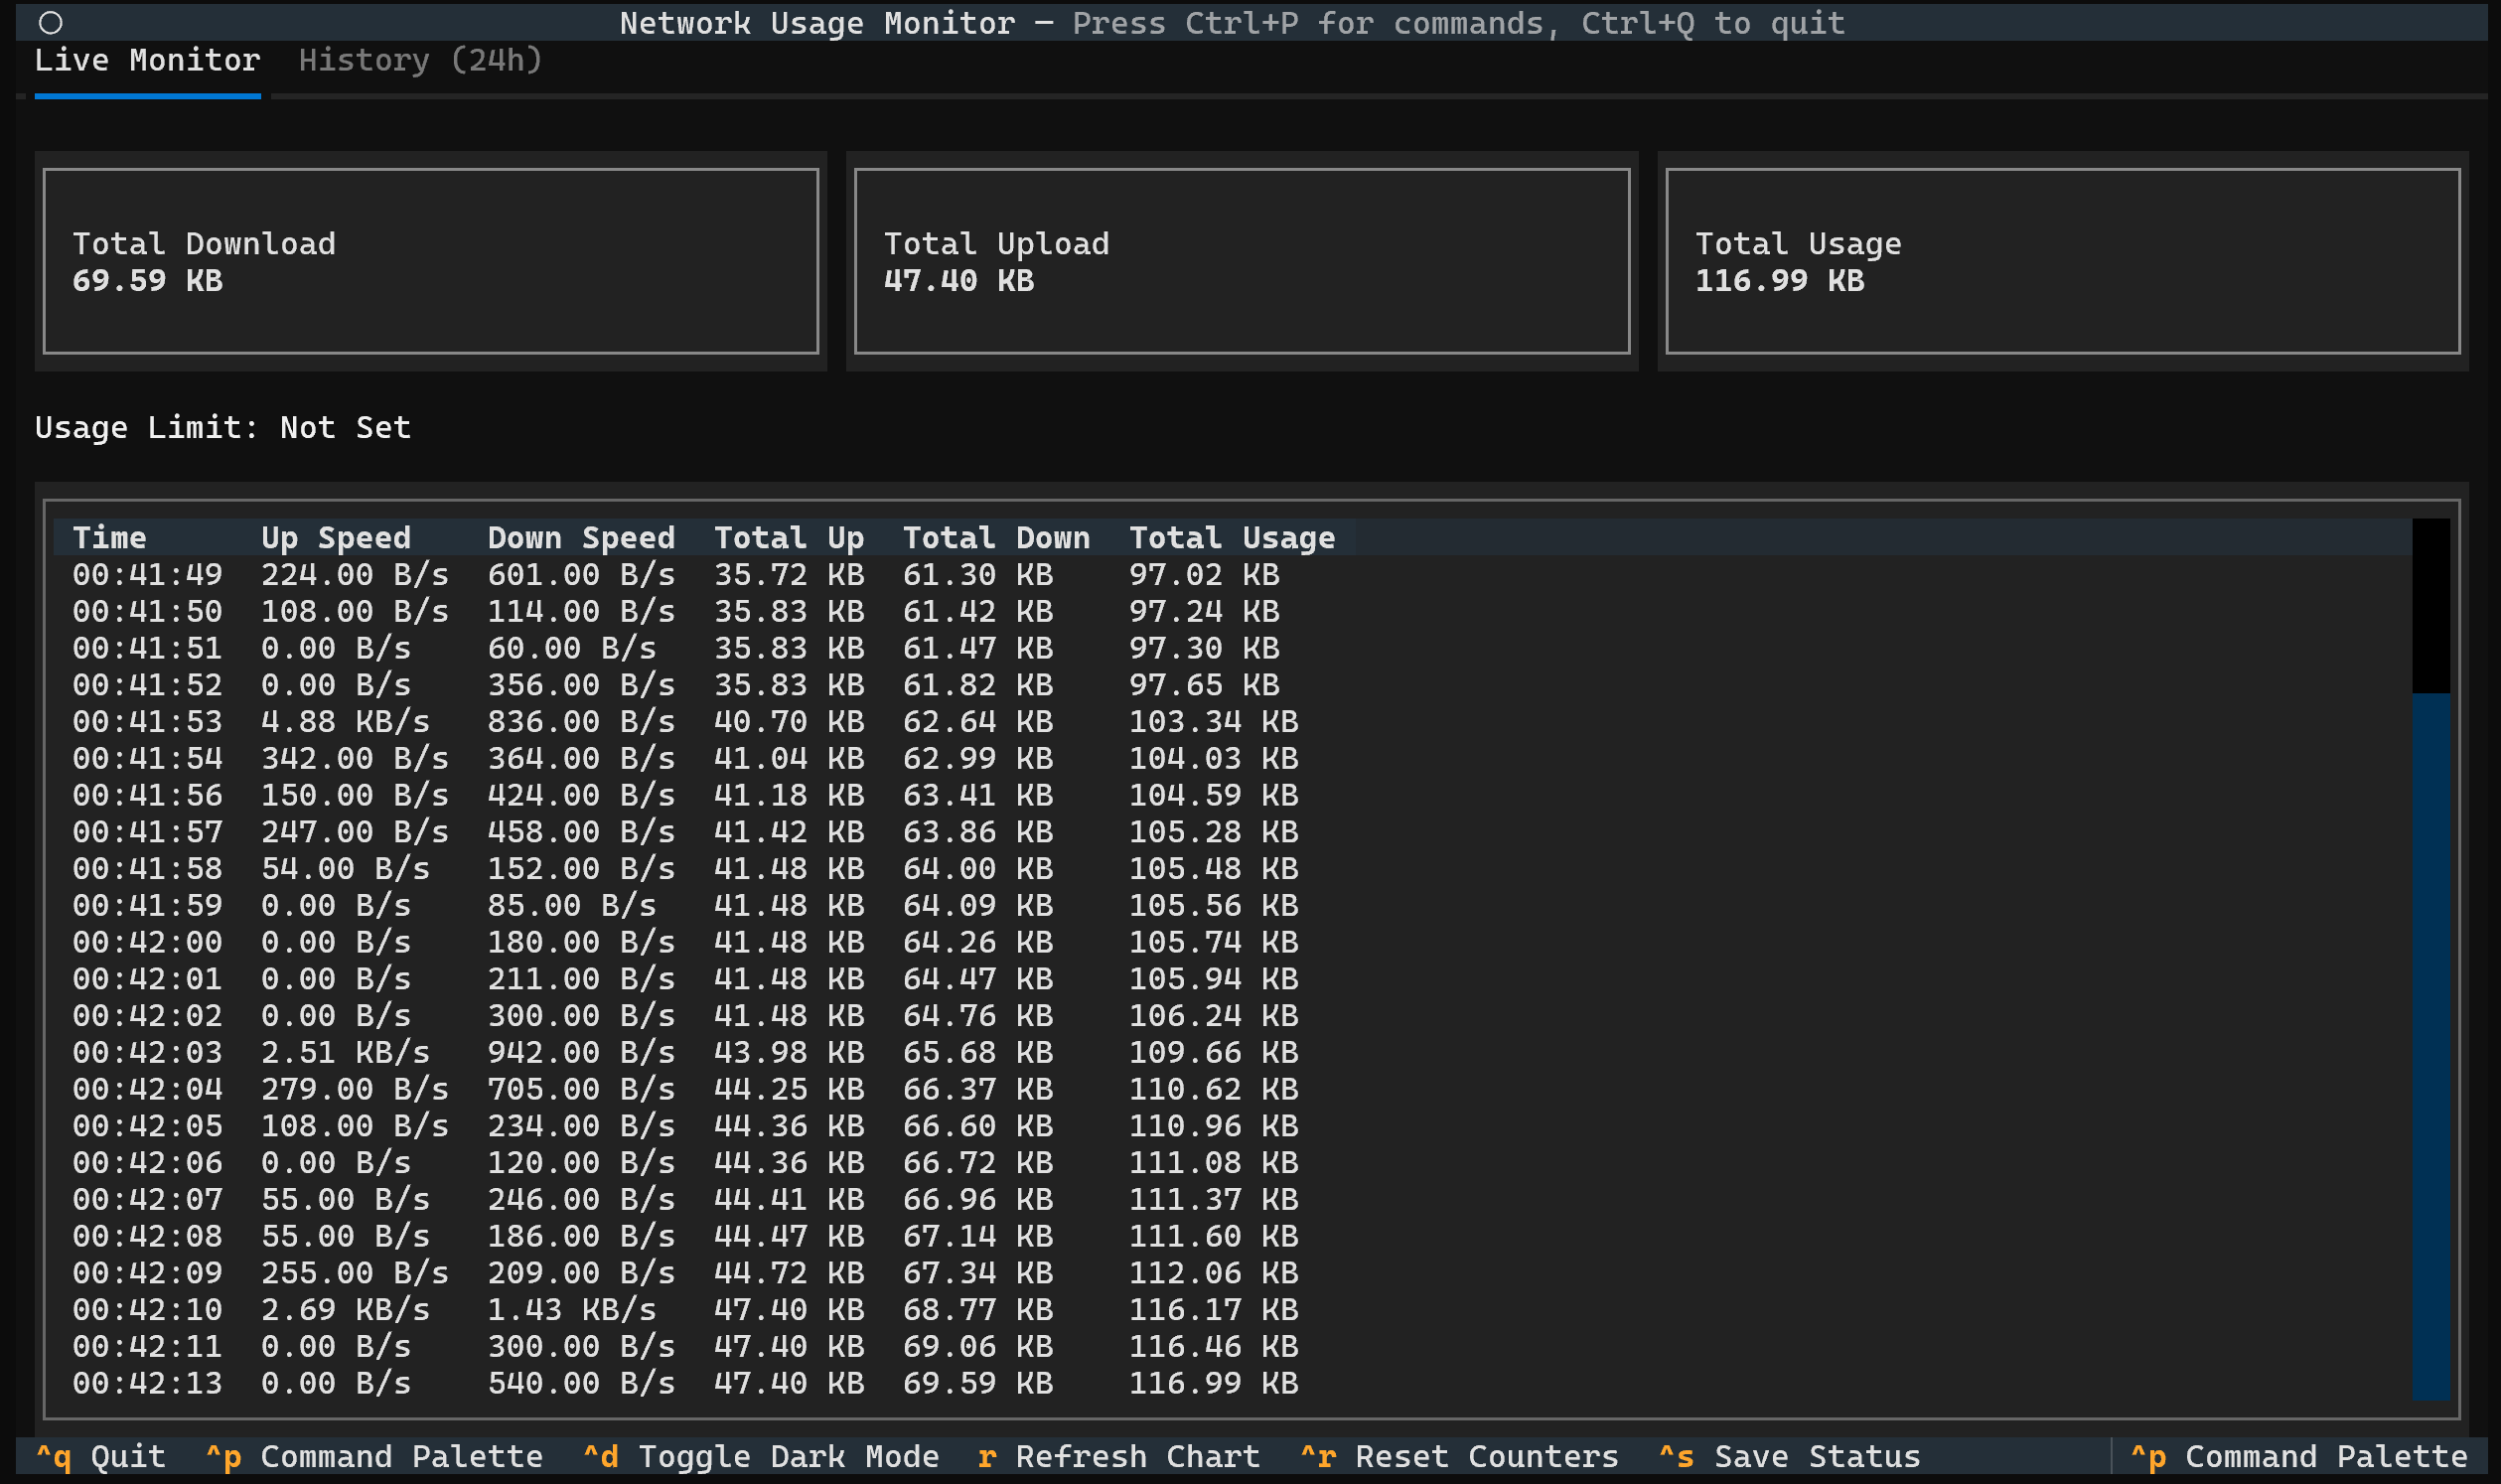
This is the default view. It shows:
-
Summary Cards: Total Upload, Download, and Combined Usage for the current session + history.
-
Quota Bar: If a limit was set, this bar fills up. It turns Yellow at 80% and Red at 100%.
-
Live Table: A scrolling list of network speeds recorded every second.
This tab visualizes your traffic over the last 24 hours.
-
Rows: Each row represents a 1-hour block of time (e.g., 14:00 covers 2:00 PM to 2:59 PM).
-
The Bar:
-
Solid Block (█): Represents Download traffic.
-
Shaded Block (░): Represents Upload traffic.
-
-
Total: The text on the right shows the exact data transferred during that hour.
Tip: If the graph looks outdated, press r to pull the latest stats from the database.
Found a bug or have a great idea? Please open an issue on the GitHub repository.
This project is licensed under the MIT License.