This project aims to visualize the intricate web of connections within the German podcast "Geschichten aus der Geschichte" (Stories from History). It creates a network visualization based on the podcast's episode list on Wikipedia, showcasing how the Wikipedia articles of the topics mentioned in the podcast are interconnected.
The GAG Network Visualizer scrapes data from Wikipedia, processes it, and generates a interactive network graph. It reveals interesting connections between historical topics discussed in the podcast episodes.
Key features:
- Scrapes podcast episode data and related Wikipedia articles
- Processes and analyzes links between articles
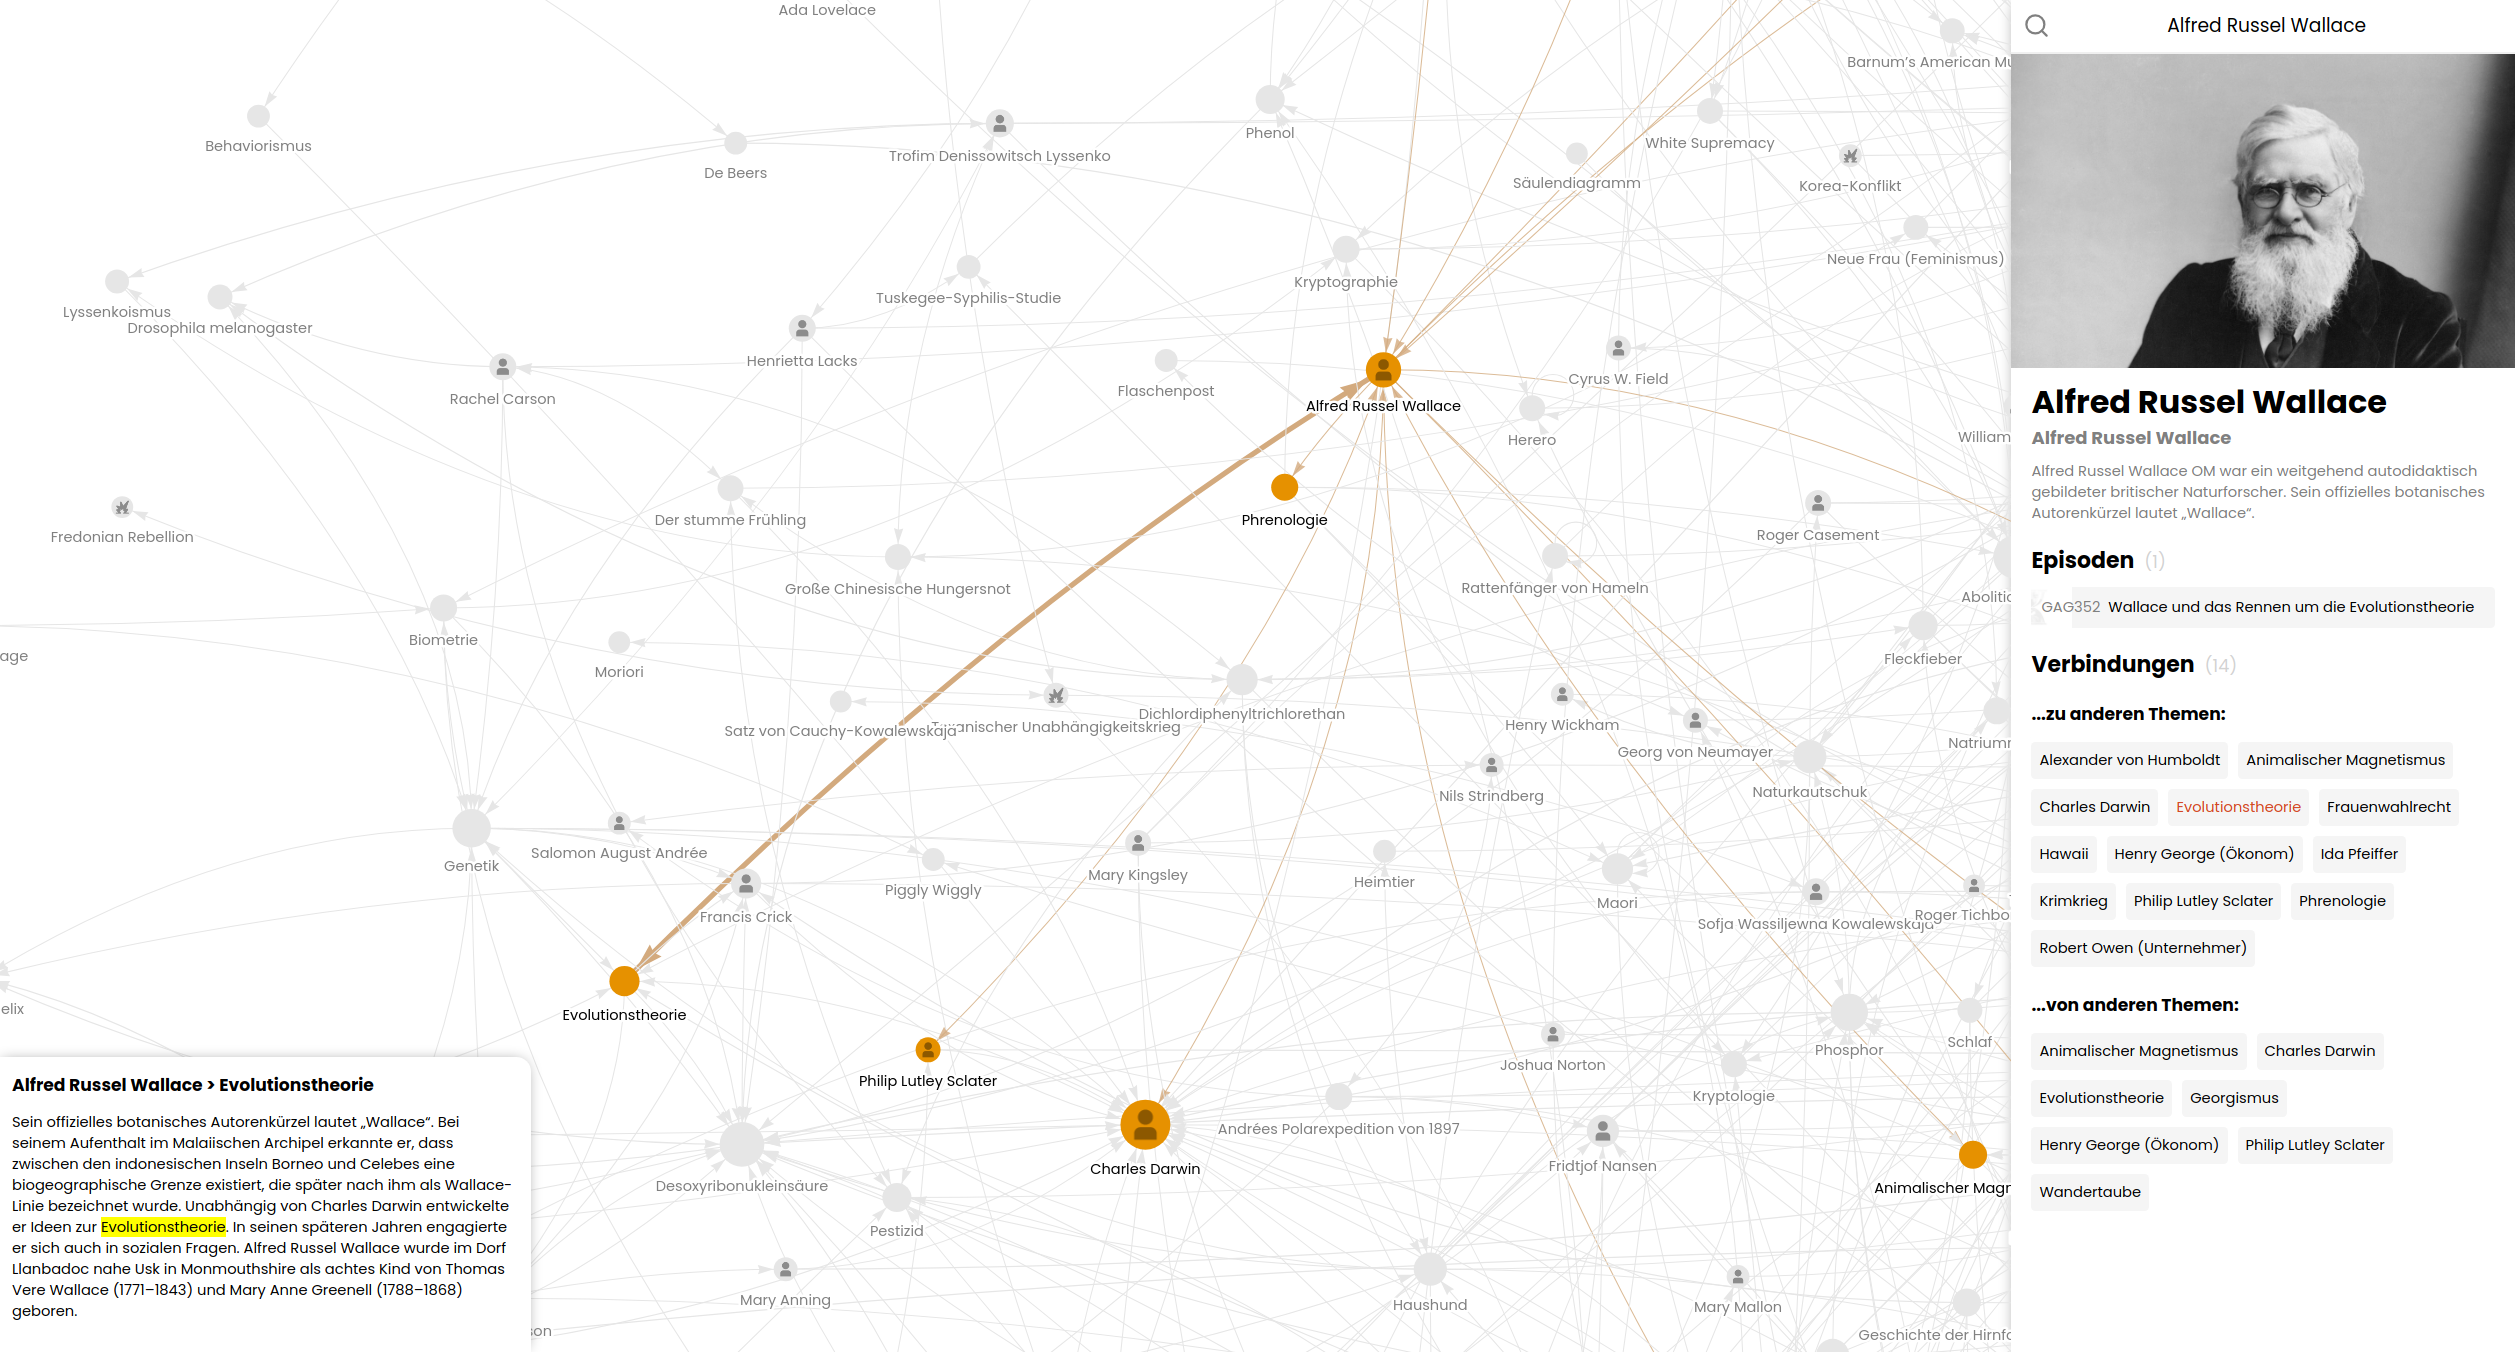
- Generates a visual network of interconnected topics
- Provides an interactive web interface to explore the network
- Python
- Web scraping:
requests,BeautifulSoup, andSelenium - Data processing:
pandasandnumpy - Text parsing:
wikitextparser(it speaks Wikipedia fluently) - Multiprocessing
- SQLite database
- JavaScript-based visualization with
vis.js
Significant effort has been put into optimizing the performance of this project as processing complete Wikipedia dumps:
- Wikipedia index file is converted to an sqlite database at the beginning to make it searchable more easily.
- Utilizes multiprocessing for parallel execution of tasks.
- Uses database indexing and optimized SQL queries to speed up data retrieval.
- Pre-loads and compresses network data to reduce initial loading times for the visualization.
- Chrome browser for Selenium WebDriver (or change it in build.py)
- Python packages:
pip install -r requirements.txt - Node.js tools:
sudo npm install terser roadroller -g
- Visit dumps.wikimedia.org/dewiki and ddumps.wikimedia.org/enwiki
- Choose the latest timestamp directory
- Download the two topmost files:
*-pages-articles-multistream.xml.bz2and*-pages-articles-multistream-index.txt.bz2
You need to set several environment variables that define the user agent, database path, and paths to the Wikipedia dump files.
GAG_USER_AGENT="GAG-Network (your-email@example.com)"
GAG_DATABASE="/path/to/database"
GAG_WIKIDUMP_DE="/path/to/german/wikipedia-dump.xml.bz2"
GAG_WIKIDUMP_DE_INDEX="/path/to/german/wikipedia-dump-index.txt.bz2"
GAG_WIKIDUMP_EN="/path/to/english/wikipedia-dump.xml.bz2"
GAG_WIKIDUMP_EN_INDEX="/path/to/english/wikipedia-dump-index.txt.bz2" The project's main script (main.py) orchestrates the entire process of data collection, processing, and visualization creation. You can run it in different modes depending on your needs.
You can run main.py in three different modes:
-
Full Process
To run the entire process (refresh data and create save):
python main.pyThis will execute all steps in order:
- Create the database
- Transform icons
- Build the network
- Minimize the build
-
Refresh Data Only
To only refresh the data without creating a new save:
python main.py --dataThis will run:
- Create the database
- Transform icons
-
Create Save Only
To create a new preloaded network save without refreshing data:
python main.py --preloadThis will run:
- Build the network
- Minimize the build
After running main.py, you will have:
- A SQLite database with scraped and processed data
- JavaScript files containing network data and metadata
- A preloaded network save for faster initial loading
- The full process can be time-consuming, especially when processing complete Wikipedia dumps. Ensure you have sufficient computational resources available.
- If you encounter any issues, check the console output for error messages and ensure all prerequisites are correctly set up.
- The
--dataoption is useful when you want to update the underlying data without regenerating the visualization. - The
--preloadoption is helpful when you've made changes to the visualization code but don't need to refresh the underlying data.
After running the script, you can view the visualization by opening the visualize/index.html or build/index.html in a web browser.
An up-to-date build can also be found at Dr-Lego/gag-network-build.