-
Notifications
You must be signed in to change notification settings - Fork 3
Charts
You can visualise result lists of words, queries and notes by means of a clickable chart.

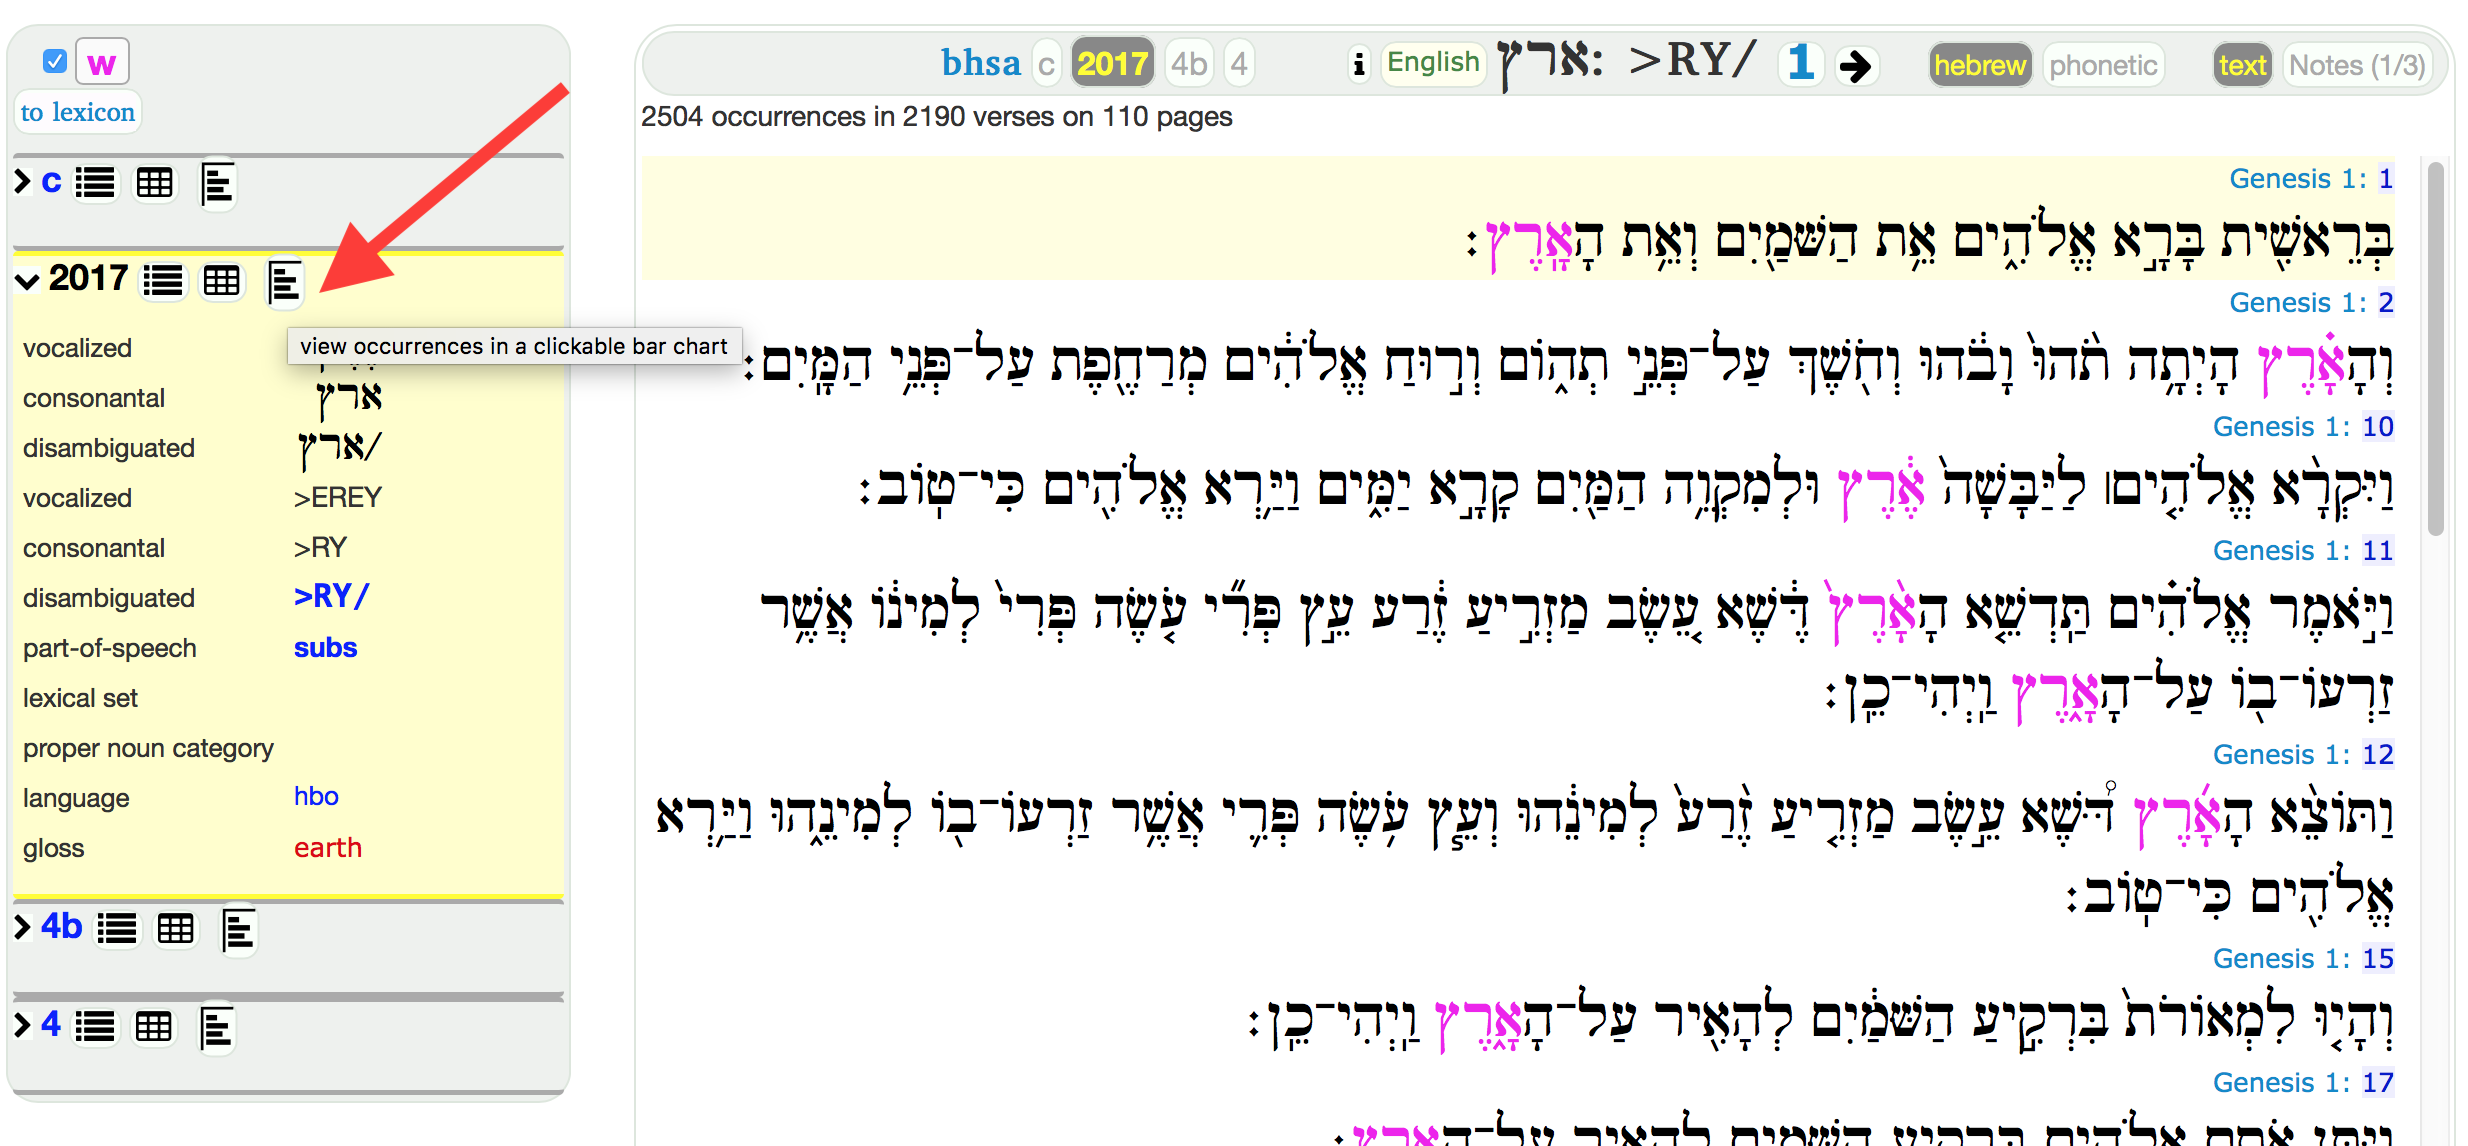
Once you have navigated to a single query, word, or note set in the right side bar, you can click the icon for a chart.
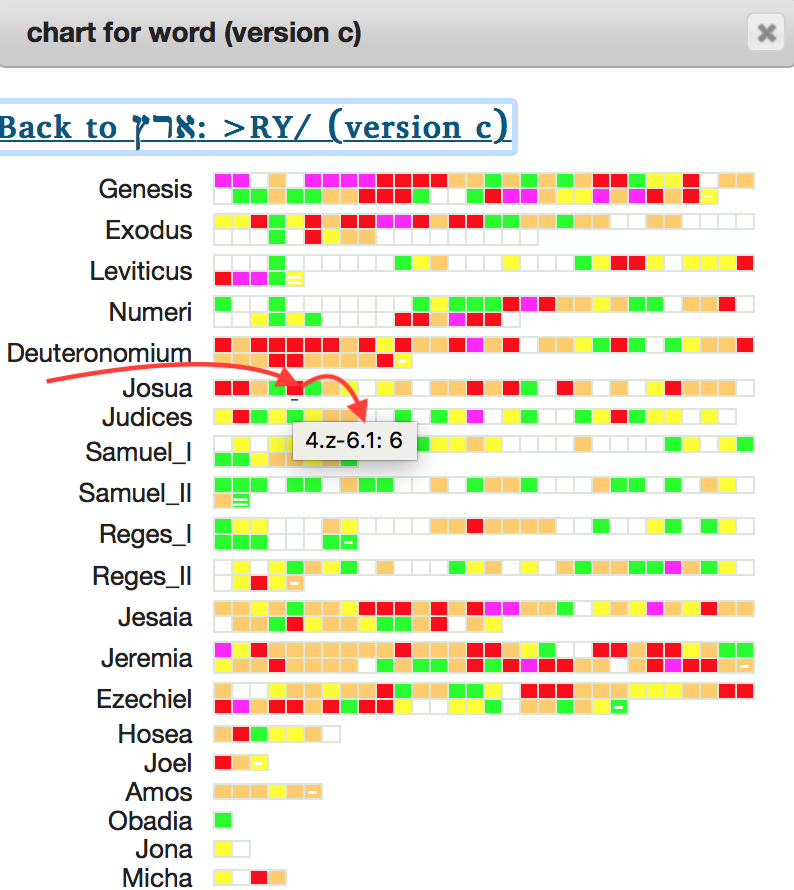
You get a heat map, an overview of the whole Hebrew Bible, divided in blocks of 500 words, with a colour indication of the frequency of results in each block.

If you click on a box, you go to the corresponding passage.

If you hover over a block, a tooltip shows to what passage the block corresponds, and exactly how many hits it contains.
The numbers are decimal fractions, indicating the chapter and a position in that chapter as a fraction relative the size of the chapter in words.
For example: 4.3-6.1: 6 means:
from chapter 4, at fraction 0.3 of the chapter, till chapter 6, at fraction 0.1 of the chapter.
The fractions are rounded.
So what if a block starts at fraction 0.95 or beyond?
We use the z for that:
4.z means: at chapter 4, at or beyond fraction 0.95.
That means, that if a block starts at chapter 5.0, it is guaranteed that it really starts in chapter 5 and does not contain some lasts words of chapter 4.


 BHSA Feature docs