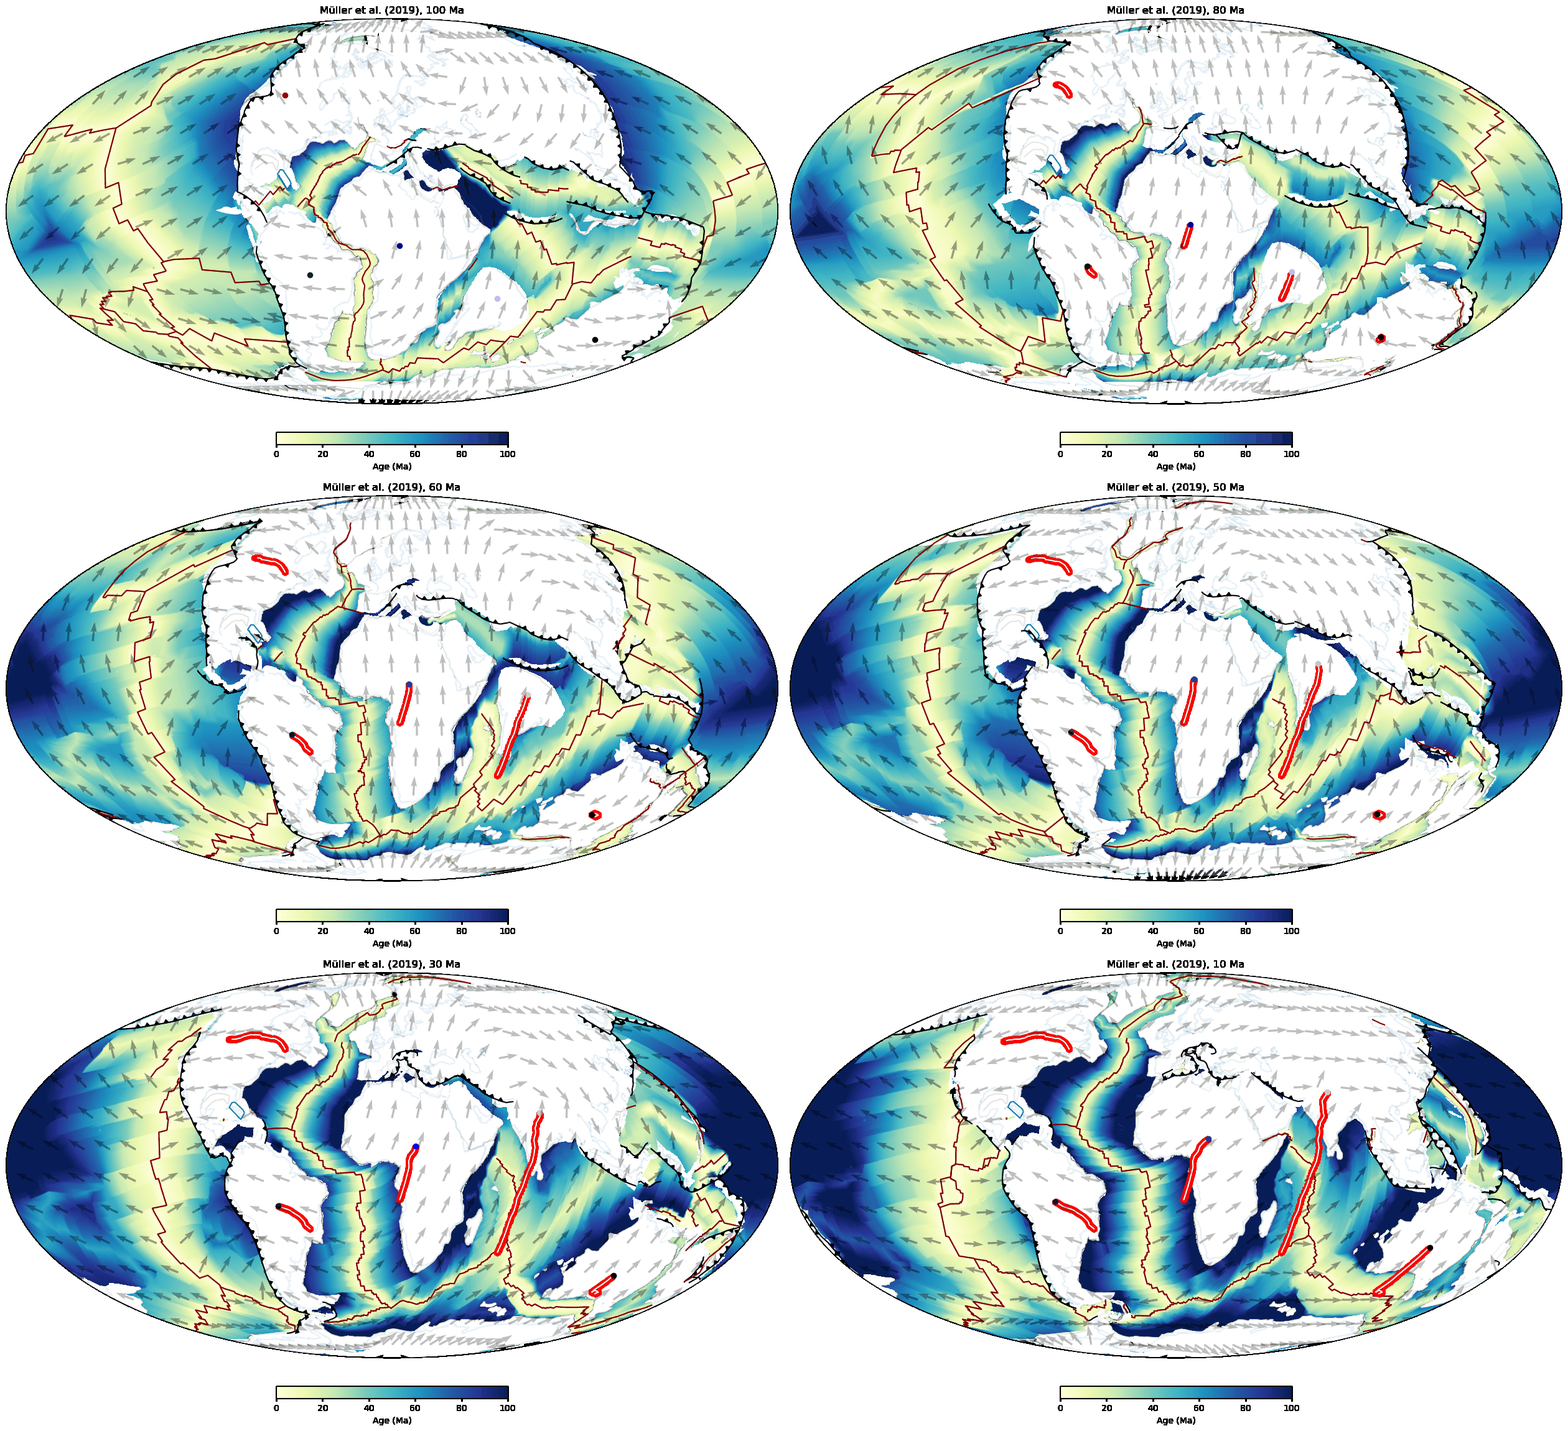
GPlately was created to accelerate spatio-temporal data analysis by leveraging pyGPlates and PlateTectonicTools within a simplified Python interface. This object-oriented package enables the reconstruction of data through deep geologic time (such as points, lines, polygons, and rasters), the interrogation of plate kinematic information (plate velocities, rates of subduction and seafloor spreading), the rapid comparison of multiple plate motion models, and the plotting of reconstructed output data on maps. All tools are designed to be parallel-safe, accelerating spatio-temporal analysis over multiple CPU processors.
GPlately requires a working installation of pyGPlates, which is freely available at https://www.gplates.org/download. All major system architectures (e.g., Linux, macOS, Windows) are supported, and installation instructions are well documented. Sample data is also available from EarthByte servers, which include rasters, seafloor age grids, rotation files, and more to help you get started with plate reconstructions.
Mather, B.R., Müller, R.D., Zahirovic, S., Cannon, J., Chin, M., Ilano, L., Wright, N.M., Alfonso, C., Williams, S., Tetley, M., Merdith, A. (2023) Deep time spatio-temporal data analysis using pyGPlates with PlateTectonicTools and GPlately. Geoscience Data Journal, 1–8. Available from: https://doi.org/10.1002/gdj3.185
@article{Mather2023,
author = {Mather, Ben R. and Müller, R. Dietmar and Zahirovic, Sabin and Cannon, John and Chin, Michael and Ilano, Lauren and Wright, Nicky M. and Alfonso, Christopher and Williams, Simon and Tetley, Michael and Merdith, Andrew},
title = {Deep time spatio-temporal data analysis using pyGPlates with PlateTectonicTools and GPlately},
year = {2023},
journal = {Geoscience Data Journal},
pages = {1-8},
keywords = {geospatial, plate reconstructions, pyGPlates, python, tectonics},
doi = {https://doi.org/10.1002/gdj3.185},
url = {https://rmets.onlinelibrary.wiley.com/doi/abs/10.1002/gdj3.185},
eprint = {https://rmets.onlinelibrary.wiley.com/doi/pdf/10.1002/gdj3.185},
}- pyGPlates
- plate-model-manager >= 1.2.2
- Shapely
- NumPy > 1.16
- SciPy > 1.0
- Matplotlib
- Cartopy (for mapping)
- Shapely
- Pooch
- GeoPandas
- netCDF4
- pygmt
- rioxarray
You can install the latest stable public release of GPlately and all its dependencies using conda.
This is the preferred method for installing GPlately, as it downloads binaries from the "conda-forge" channel.
conda install -c conda-forge gplatelyWe recommend creating a new conda environment in which to install GPlately. This avoids any potential conflicts within your base Python environment. In the example below, we create a new environment called my-env.
conda create -n my-env
conda activate my-env
conda install -c conda-forge gplately
The my-env environment needs to be activated before using GPlately, i.e., conda activate my-env.
Alternatively, you can install the latest stable public release of GPlately using the pip package manager.
pip install gplatelyor from this GitHub repository:
pip install git+https://github.com/GPlates/gplately.gitFirst-time installation: To install the latest version of GPlately from a specific repository branch (e.g., master), run the following commands in your terminal:
cd /directory-to-keep-gplately-files # go into the directory in which you'd like to keep the GPlately repository
git clone https://github.com/GPlates/gplately.git gplately.git
cd gplately.git # go into the root directory of your cloned gplately repository
git checkout master # check out the "master" branch or the name of branch you want
git pull # fetch all recent code changes from the GitHub remote repository to your computer
pip install . # alternatively, you can use "pip install -e ." to install gplately in editable mode
Update installation: To update your installation of GPlately by fetching the latest code from a specific repository branch (e.g., master), run the following commands in your terminal:
cd /path-to-gplately-repository # go into the root directory of your cloned gplately repository, such as ./gplately.git
git checkout master # check out the "master" branch or the name of branch you want
git pull # fetch all recent code changes from the GitHub remote repository to your computer
pip install . # alternatively, you can use "pip install -e ." to install gplately in editable mode👉 Run GPlately example notebooks with Docker
docker pull gplates/gplatelydocker run --rm -ti -p 8888:8888 gplates/gplately- http://localhost:8888
👉 Run GPlately command with Docker
docker run gplates/gplately gplately --versiondocker run gplates/gplately gplately --help
👉 Run your Python script with Docker
docker run -it --rm -v "$PWD":/ws -w /ws gplates/gplately python my_script_to_run.py(assume my_script_to_run.py is in the current working directory)
Visit this page for more details about using Docker with GPlately.
- Quick start - a brief tutorial to help users get up to speed
- Sample workflows - demonstrations of how GPlately can be used in various workflows
- Examples - code snippets that demonstrate the usage of GPlately's classes and methods
- command-line interface (CLI) - use GPlately in a command-line environment
To see GPlately in action, launch a Jupyter Notebook environment and check out the sample notebooks:
- 01 - Getting Started: A brief overview of how to initialise GPlately's main objects
- 02 - Plate Reconstructions: Setting up a
PlateReconstructionobject, reconstructing geological data through time - 03 - Working with Points: Setting up a
Pointsobject, reconstructing seed point locations through time with. This notebook uses point data from the Paleobiology Database (PBDB). - 04 - Velocity Basics: Calculating plate velocities, plotting velocity vector fields
- 05 - Working with Feature Geometries: Processing and plotting assorted polyline, polygon and point data from GPlates 2.3's sample data sets
- 06 - Rasters: Reading, resizing, resampling raster data, and linearly interpolating point data onto raster data
- 07 - Plate Tectonic Stats: Using PlateTectonicTools to calculate and plot subduction zone and ridge data (convergence/spreading velocities, subduction angles, subduction zone and ridge lengths, crustal surface areas produced and subducted etc.)
- 08 - Predicting Slab Flux: Predicting the average slab dip angle of subducting oceanic lithosphere.
- 09 - Motion Paths and Flowlines: Using pyGPlates to create motion paths and flowlines of points on a tectonic plate to illustrate the plate's trajectory through geological time.
- 10 - SeafloorGrid: Defines the parameters needed to set up a
SeafloorGridobject, and demonstrates how to produce age and spreading rate grids from a set of plate reconstruction model files. - 11 - AndesFluxes: Demonstrates how the reconstructed subduction history along the Andean margin can be potentially used in the plate kinematics analysis and data mining.


