Note: This project has been, to the best of my knowledge, verified to the best of my abilities. There may, however, still be errors or inaccuracies. If you bump into an inaccuracy, simply open an issue so I can correct as soon as I can.
Inspired by this Reddit post.
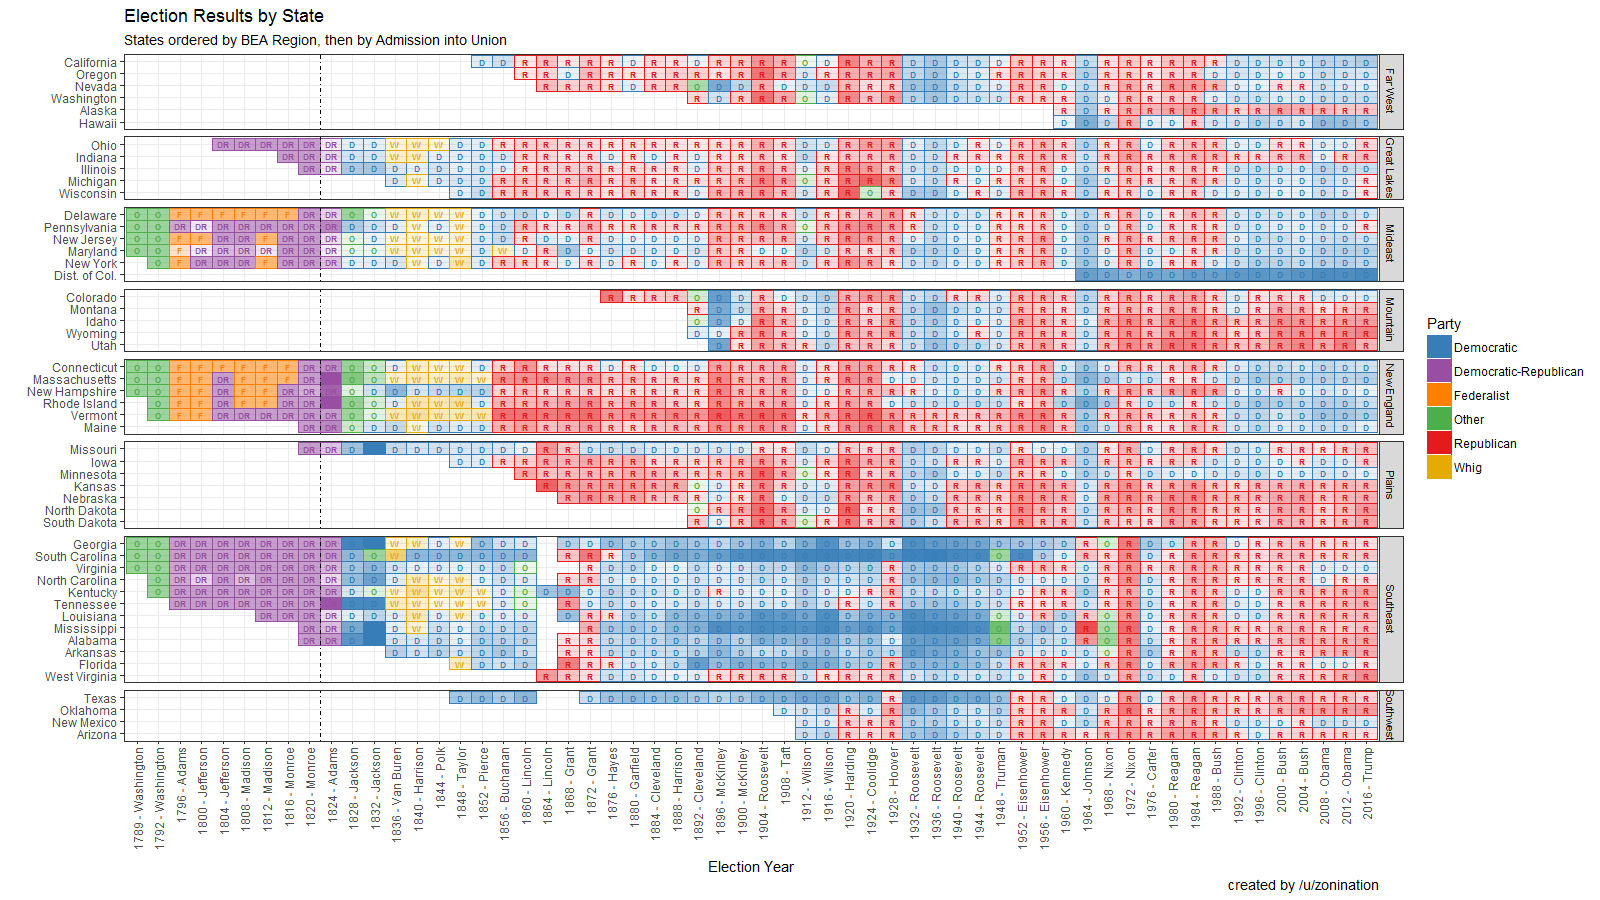
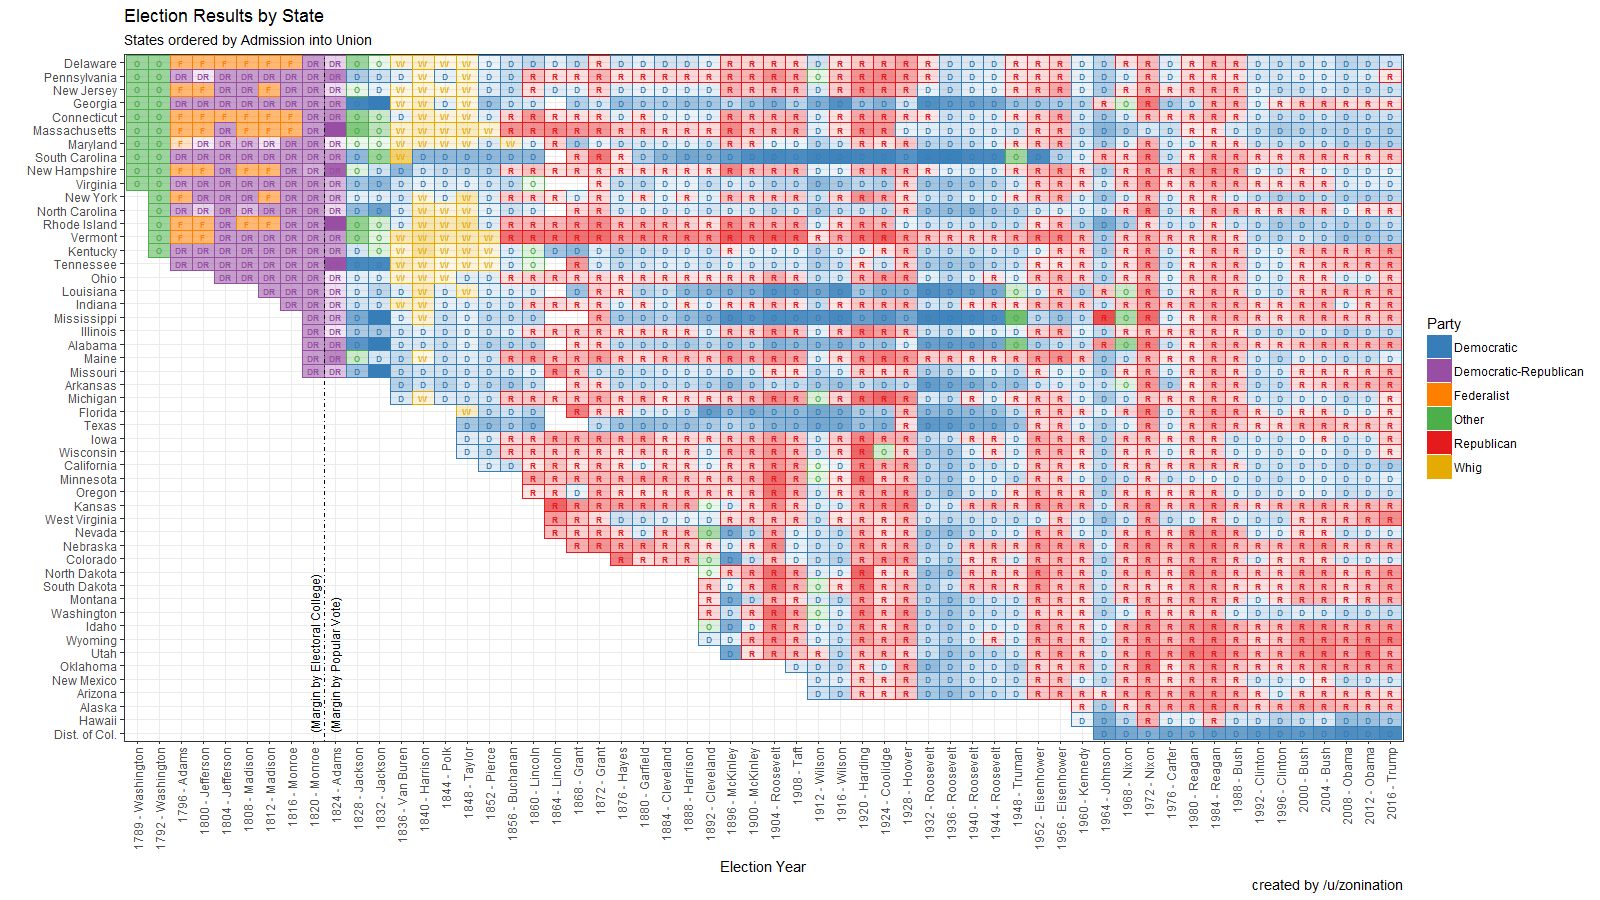
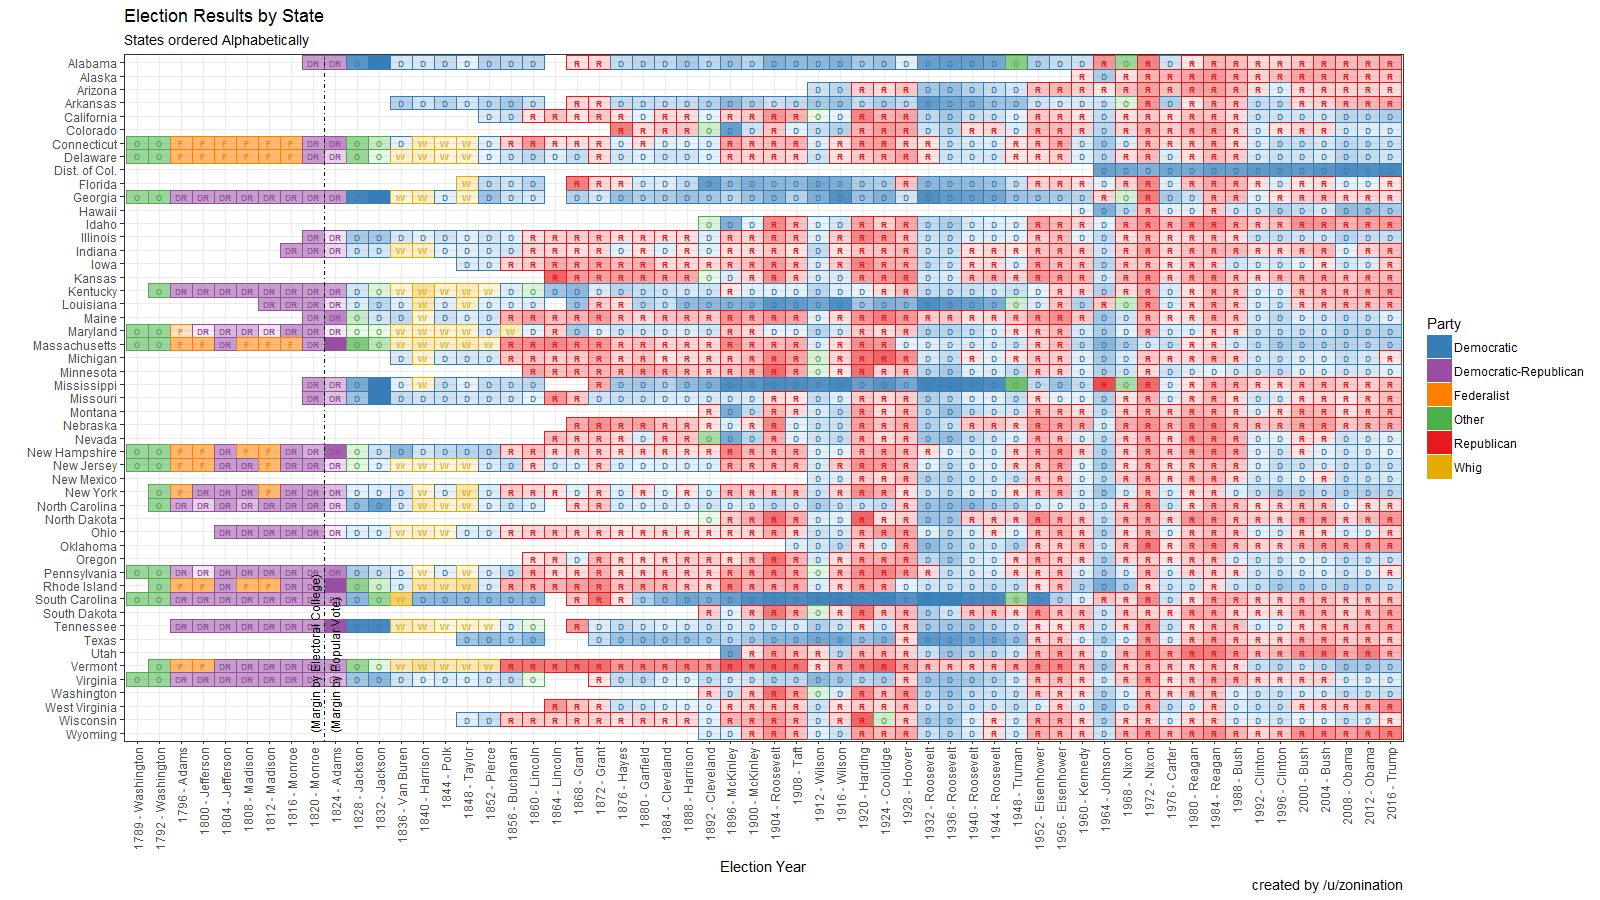
Wanted to expand on it with the following improvements:
- including shading for margin of victory (% of winning party - % of next highest party)
- expanding the dataset to the earliest possible election data
- breaking down the states into regions, since there are clear election patterns
Election Data
- 1821 and Before: http://www.archives.gov/federal-register/electoral-college/votes/1789_1821.html
- 1824 and After: http://www.presidency.ucsb.edu/showelection.php?year=1824
Other Data
- BEA regions: http://www.bea.gov/regional/docs/regions.cfm
- States by admission into union: https://en.wikipedia.org/wiki/List_of_U.S._states_by_date_of_admission_to_the_Union#List_of_U.S._states
- ggplot2
- Rstudio


