-
Notifications
You must be signed in to change notification settings - Fork 34
First Release Overview
Our goal is to accelerate the development of Streams healthcare applications by providing the necessary building blocks for constructing a clinical monitoring and analytics application.
The first pre-release is now available on Github.
This post will discuss the high-level design of the platform and how you can try this out.
To help us understand healthcare use-cases and requirements, we have talked to many of our healthcare customers and business partners. In these discussions, we try to learn about how our clients write their Streams application, and the common problems they try to solve. These conversations led us to the realization that many of our clients’ applications share a common design pattern. To understand the Healthcare Analytics Platform, we have to first talk about this common design pattern.

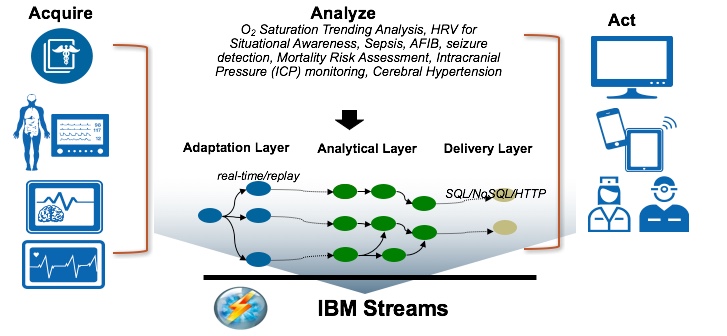
This diagram shows the typical Streams healthcare application design pattern. Under Acquire, you will find some of the common data sources for patient data:
- Physiological data from bedside monitors – This includes patient’s vitals, EEG signals, ECG signals, etc. This data is continuously collected and aggregated by a clinical device integrator (e.g. Vines by TrueProcess). The integrator is responsible for collecting data from all of the bedside monitors and publishing the data out onto the hospital network. This data gives insights to the patient’s current status.
- Electronic health records (EMR) – This represents patient admission, transfer and discharge data. This also includes patient medical history, related clinical notes, lab results, medication records, radiology reports, etc. This data is usually encoded in HL7 or FHIR format. This data is manually entered by a clinician and usually has a significant time delay between the time when the data is collected to the time when it is made available to the system. Including this data into a realtime analytics system gives a 360-degree view of the patient to the system, enabling it to produce more reliable analytics results.
- Mobile devices – With the explosion in popularity of the Internet of Things, we are starting to see a trend where patient’s heath-care data is being collected by mobile devices like smart watches, smart phones or other embedded devices. The data is collected on the device and then streamed to backend cloud systems for analysis.
Patient data is ingested into a Streams application in the Adaptation Layer, where custom source operators are written to ingest data from these common data sources. Once the data lands into the application, the data is then cleaned and normalized in preparation for it to be analyzed by applications in the Analytical Layer. Some of the common analytics like R-Peak detections, HRV analysis, trend analysis are listed in the diagram above. Finally, we turn the analytical results into actionable insights by delivering the data and results to external systems. For example, the data can be delivered to a visualization server for it to present the data on a centralized dashboard, aiding clinicians in the analysis of the data from the many data sources. Alternatively, the data can be delivered to external notification system, where the appropriate clinicians or personnel can be notified about the important clinical events in a timely fashion.
The main goal of the Streams Healthcare Analytics Platform is to make the Analyze part of this application design pattern easy. The platform will handle all the plumbing and infrastructure work for a Streams application, while researchers and developers can focus on developing the life-saving analytics.

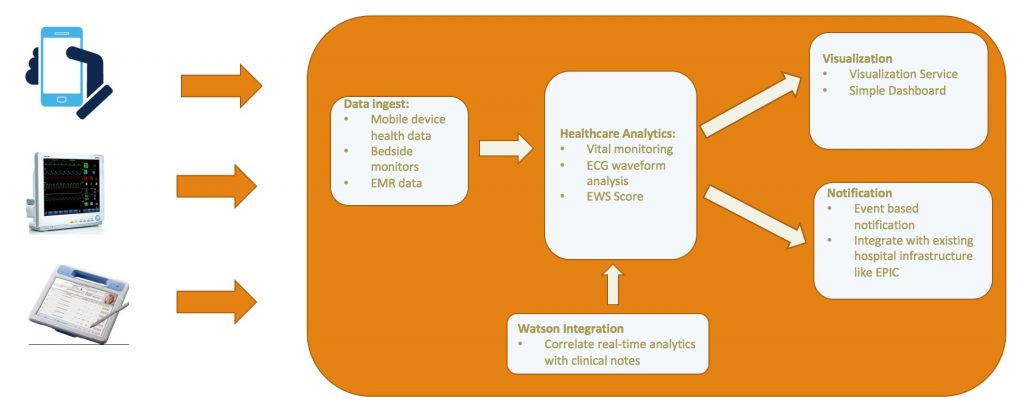
This diagram shows the major components of the platform:
- Data Ingest – The first problem that we have to handle is to help clients ingest data from the most common data sources. This component contains definitions of common data types and schema, services for data ingest from external sources and services to transform the incoming data into the common schema. By transforming all incoming data to a common data format, downstream applications do not have to worry about where the data is coming from, and how the data is structured. Analytics can be written once and support any data ingest services that follows the Ingest Service Framework of the platform. Click on this link for more information about the Ingest Service Framework
- Healthcare Analytics – This component contains basic analytics services for physiological data. Some of the analytics include R-Peak detection in an ECG signal, range checking for vitals, trend analysis, etc. The idea here is to for the platform to provide the most basic analytics. Clients can simply reuse the base analytics as-is, or build more complex algorithms by extending these base services, or combining multiple services to form more sophisticated rules.
- Visualization – This component helps our clients quickly visualize patients data as well as the analytics results. We would like to provide basic dashboard to help clients visualize healthcare data. Clients can also reuse some of the functions to build a more elaborate dashboard.
- Notification – This component delivers analytical insights to external notification systems.
- Watson Integration – This component integrates with Watson Explorer and IBM Care Management system. This integration enables us to gather insights from the unstructured text in clinical notes, medical history, lab results, etc. and incorporate these insights with real-time analytics.
The world would be a simple, but a boring place, if every system is the same for all of the hospitals and if they are all trying to solve the same problems. We have learned that while there is a common application design pattern; but every clinical environment is different. Each of the hospitals has its unique system configurations, clinical protocols and its own set of challenges. As a result, it is almost impossible to design a one-size-fits-all platform that will address all of the potential use cases in the healthcare domain.
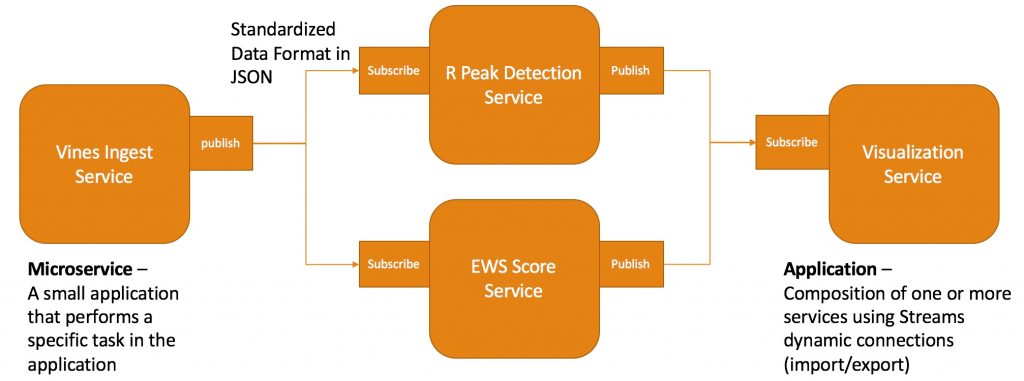
The Streams Healthcare Analytics Platform is designed using the Microservice Architecture. This architecture provides the much-needed flexibility in constructing a Streams healthcare application. Microservices are the basic building blocks of applications. A microservice is a small pre-built application that performs a very specific task within a larger application. Data from the microservice is made available to downstream services and applications using the Publish operator, which, in turn, consume the data using the Subscribe operator.
Applications using the microservice architecture are built by combining one or more of the microservices provided by the platform with custom, domain specific logic where needed. This architecture provides a number of benefits. For one, unlike using operators from a Streams toolkit, clients are not required to write an SPL application in order to reuse the function. Since the services are customizable using submission time parameters, they can reuse a component by simply launching the microservice application and supplying needed parameters.
The following diagram shows an application constructed using this architecture. In this application, we compose the application by launching four microservices. The Vines Ingest Service ingests data from a device integrator called Vines. The data is published using an Publish operator, with a specific topic. We have two analytics services consuming the data stream: The R-Peak Detect service detects the R-peaks in ECG signals. The EWS Service calculates the early warning score for patients by assessing patient’s vitals. The results are then published by the analytics services. The visualization services subscribes to the data streams from the two analytics services and populate its dashboard using those data.

This is just one example for an application. This architecture allows clients to mix and match different microservices to compose an application to address their specific needs. For example, if a hospital is using BedMaster instead of Vines as a device integrator, clients may simply replace the Vines Ingest Service with a BedMaster Ingest Service.
One of the key design decisions we have made early on, is to mandate that all services within the Healthcare Analytics Platform will communicate with each other using JSON. The advantages to using JSON as the communication protocol are as follows:
- Schema Flexibility – JSON allows the schema definition in a microservice to be more flexible and makes it easier to evolve data schema in the future. Because we are just passing strings around, we can make changes to the data schema without having to rebuild all of the downstream applications. As long as the upstream application continue to send down the required attributes, downstream applications will continue to work.
- Interoperability – JSON also makes it easy for services written in different languages to talk to each other. In the Streams Healthcare Analytics Platform, the decision on which language to use for writing a service, depends on which language is best for the job. Some services may be written in Java if a Java library is available. Some services may be better suited to be implemented in Python. Some may have to be written in SPL as it has more analytics functions and toolkits readily available. To make sure that all of the services can interoperate with each other, we picked JSON to be our data transfer standard.
In this first release, we have focused on helping our clients solve the data-ingest problem. The main theme is to make data-ingest easy! We have added a number of important ingest services to help clients get data into Streams. In addition, we have services to validate the platform design and to also help clients construct a meaningful application. Here’s a list of microservices available in this first release:
| Service | Description |
|---|---|
| streamsx.health.ingest | Foundational Toolkit providing basic infrastructure for other ingest services |
| streamsx.health.ingest.kafka | Publish and subscribe data to a Kafka server (e.g. IBM MessageHub) |
| streamsx.health.ingest.hapi | Service for ingesting HL7 OBX data into Streams |
| streamsx.health.ingest.physionet | Service for ingesting public clinical data from Physionet database |
| streamsx.health.ingest.vines | Service for ingesting data from Vines |
| Service | Description |
|---|---|
| streamsx.health.prepare.uomconverter | Service for converting data from one unit of measure to another |
| Service | Description |
|---|---|
| streamsx.health.analytics.ecg | Service for analyzing ECG signal – QRS detection |
| streamsx.health.analyze.rules.vitals.spl | Service for calculating Early Warning Score from patient’s vitals |
| streamsx.health.analyze.watsonexplorer | Service for extracting medication and symptom information from clinical notes |
| Service | Description |
|---|---|
| streamsx.health.simulate.beacon | Service for generating ECG and vitals data for development and demo |
| Service | Description |
|---|---|
| streamsx.health.debug.print | Service for debugging. This service prints the JSON data from any topic |
| Service | Description |
|---|---|
| PatientsMonitoringDemo | Sample demonstrating how to use the Streams Healthcare Analytics Platform |
| PatientsMonitoringDemo.rules | ODM Rules used by PatientsMonitoringDmo |
| HealthcareJupyterDemo | Sample demonstrating how to write a healthcare application in Python using Jupyter Notebook |
This is just the beginning of this very interesting project. The healthcare industry is undergoing a major transformation as hospital systems are being modernized and we start to recognize the values of realtime analytics in a clinical setting. There are many opportunities for innovations in this space! We hope the Streams Healthcare Analytics Platform can enable and inspire our clients to realize these new opportunities.
If you would like to try this out, download the release and try out the PaitentsMonitoringDemo from here.
We are always looking for feedback and opportunities for collaboration. Feel free to open an issue on the Github project to give us feedback or send us an email!