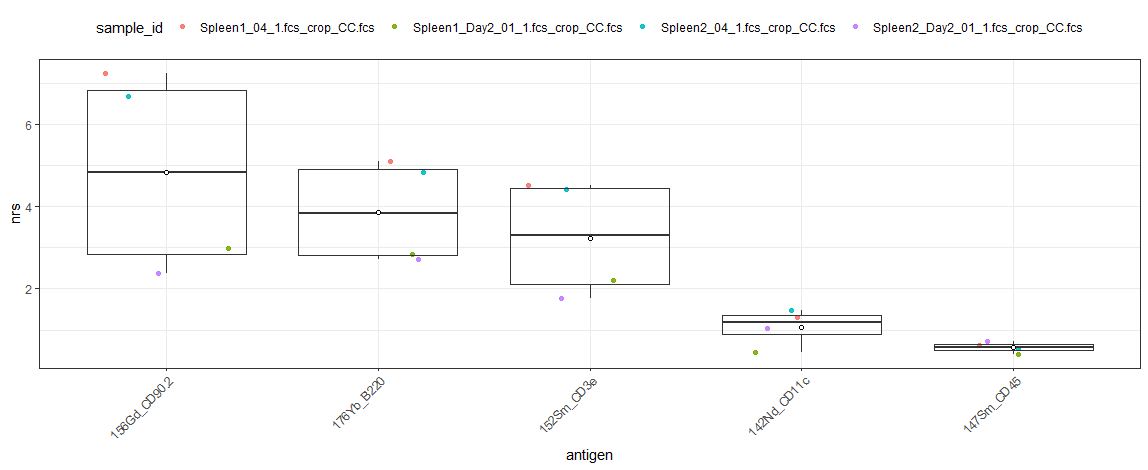
Plots the NRS (non-redundancy score) of selected markers from one or more FCS files.
This is useful to get a quick summary of which markers are contributing most to the variations in the sample(s) to potentially guide the focus of downstream analysis.
Inspired by the Nowicka et al workflow, I created a simple script that will perform only the NRS section.
This was mostly just to practice / learn R and dealing with FCS files and analysis tools that may be useful.
Copy / paste and run the script in R and perhaps an IDE such as R-Studio
