
EhTrace (pronounced "ATrace") is a high-performance binary tracing and instrumentation framework for Windows. It enables deep runtime analysis of Windows executables without requiring source code, binary modifications, or traditional debugging.
EhTrace leverages Windows Vectored Exception Handling (VEH) and block-stepping techniques to provide comprehensive execution tracing with minimal overhead. Unlike traditional debugging or instrumentation tools, EhTrace operates entirely in-process and requires no patches to target binaries.
- Zero Binary Modification: Trace execution without altering the target binary
- High Performance: Block stepping instead of single stepping achieves ~43 million events per second
- Complete Code Coverage: Automatic basic block detection and tracking
- Register State Monitoring: Capture and analyze register states during execution
- No Debug Mode Required: Works without enabling CPU debug/trace MSR capabilities
- In-Process Operation: Minimal context switching overhead compared to traditional debuggers
- Multiple Instrumentation Modes: Support for various tracing and analysis scenarios
- Execution Flow Analysis: Track program execution paths and control flow
- Code Coverage Mapping: Generate comprehensive code coverage reports
- RoP Defense: Detect and prevent Return-Oriented Programming attacks through call/ret balancing
- Key Escrow: Cryptographic key interception and escrow capabilities
- Fuzzing Integration: AFL-compatible fuzzing instrumentation (AWinAFL)
- Symbol Resolution: Automatic symbol loading and resolution via DIA2
flowchart TB
    subgraph Target["🎯 Target Process"]
        direction TB
        APP[Application Code]
        VEH[Vectored Exception Handler]
        style APP fill:#e1f5ff,stroke:#01579b,stroke-width:3px,color:#000
        style VEH fill:#fff3e0,stroke:#e65100,stroke-width:3px,color:#000
    end

    subgraph EhTrace["⚡ EhTrace Engine"]
        direction TB
        BLOCK[Block Stepper]
        DISASM[Capstone Disassembler]
        FIGHTERS[BlockFighters]
        CTX[Context Manager]
        style BLOCK fill:#f3e5f5,stroke:#4a148c,stroke-width:3px,color:#000
        style DISASM fill:#e8f5e9,stroke:#1b5e20,stroke-width:3px,color:#000
        style FIGHTERS fill:#ffebee,stroke:#b71c1c,stroke-width:3px,color:#000
        style CTX fill:#e0f2f1,stroke:#004d40,stroke-width:3px,color:#000
    end

    subgraph Output["📊 Analysis Output"]
        direction TB
        SHMEM[Shared Memory Log]
        GRAPHS[Visual Graphs]
        REPORTS[Coverage Reports]
        style SHMEM fill:#fce4ec,stroke:#880e4f,stroke-width:3px,color:#000
        style GRAPHS fill:#f1f8e9,stroke:#33691e,stroke-width:3px,color:#000
        style REPORTS fill:#fff8e1,stroke:#f57f17,stroke-width:3px,color:#000
    end

    APP -->|Exception| VEH
    VEH -->|Single Step| BLOCK
    BLOCK -->|Instruction| DISASM
    DISASM -->|Analysis| FIGHTERS
    FIGHTERS -->|State| CTX
    CTX -->|Events| SHMEM
    SHMEM -->|Data| GRAPHS
    SHMEM -->|Data| REPORTS

    style Target fill:#e3f2fd,stroke:#0d47a1,stroke-width:4px
    style EhTrace fill:#f3e5f5,stroke:#6a1b9a,stroke-width:4px
    style Output fill:#e8f5e9,stroke:#2e7d32,stroke-width:4px
EhTrace operates through a sophisticated pipeline:
- 🛡️ Exception Handling: Registering a Vectored Exception Handler (VEH)
- 👣 Block Stepping: Using single-step exceptions at basic block boundaries
- 🔍 Disassembly: Leveraging Capstone for on-the-fly instruction analysis
- 📝 Logging: Writing execution events to shared memory for external analysis
- ⚔️ Fighting: Applying configurable "BlockFighters" for security and analysis tasks
The framework maintains execution state per-thread using specialized context structures and provides hooks for customizable instrumentation.
graph LR
    subgraph Traditional["🐌 Traditional Debugger"]
        T1[Single Step]
        T2[Context Switch]
        T3[Kernel Mode]
        T4[~1M events/sec]
        style T1 fill:#ffcdd2,stroke:#c62828,stroke-width:2px,color:#000
        style T2 fill:#ffcdd2,stroke:#c62828,stroke-width:2px,color:#000
        style T3 fill:#ffcdd2,stroke:#c62828,stroke-width:2px,color:#000
        style T4 fill:#ef5350,stroke:#b71c1c,stroke-width:3px,color:#fff
    end

    subgraph EhTrace["⚡ EhTrace"]
        E1[Block Step]
        E2[In-Process]
        E3[User Mode]
        E4[~43M events/sec]
        style E1 fill:#c8e6c9,stroke:#2e7d32,stroke-width:2px,color:#000
        style E2 fill:#c8e6c9,stroke:#2e7d32,stroke-width:2px,color:#000
        style E3 fill:#c8e6c9,stroke:#2e7d32,stroke-width:2px,color:#000
        style E4 fill:#66bb6a,stroke:#1b5e20,stroke-width:3px,color:#fff
    end

    T1 --> T2 --> T3 --> T4
    E1 --> E2 --> E3 --> E4

    style Traditional fill:#ffebee,stroke:#d32f2f,stroke-width:3px
    style EhTrace fill:#e8f5e9,stroke:#388e3c,stroke-width:3px
EhTrace achieves high performance through several optimizations:
- 🎯 Branch stepping vs single stepping: Only trace at basic block boundaries
- ⚡ In-process operation: No debugger context switches
- ⏱️ Temporal state management: VEH naturally maintains execution state
- 💾 Efficient logging: Shared memory buffers for high-throughput event recording
📊 Benchmark: 428,833,152 events (32 bytes each) captured in 10 seconds = ~43M events/sec
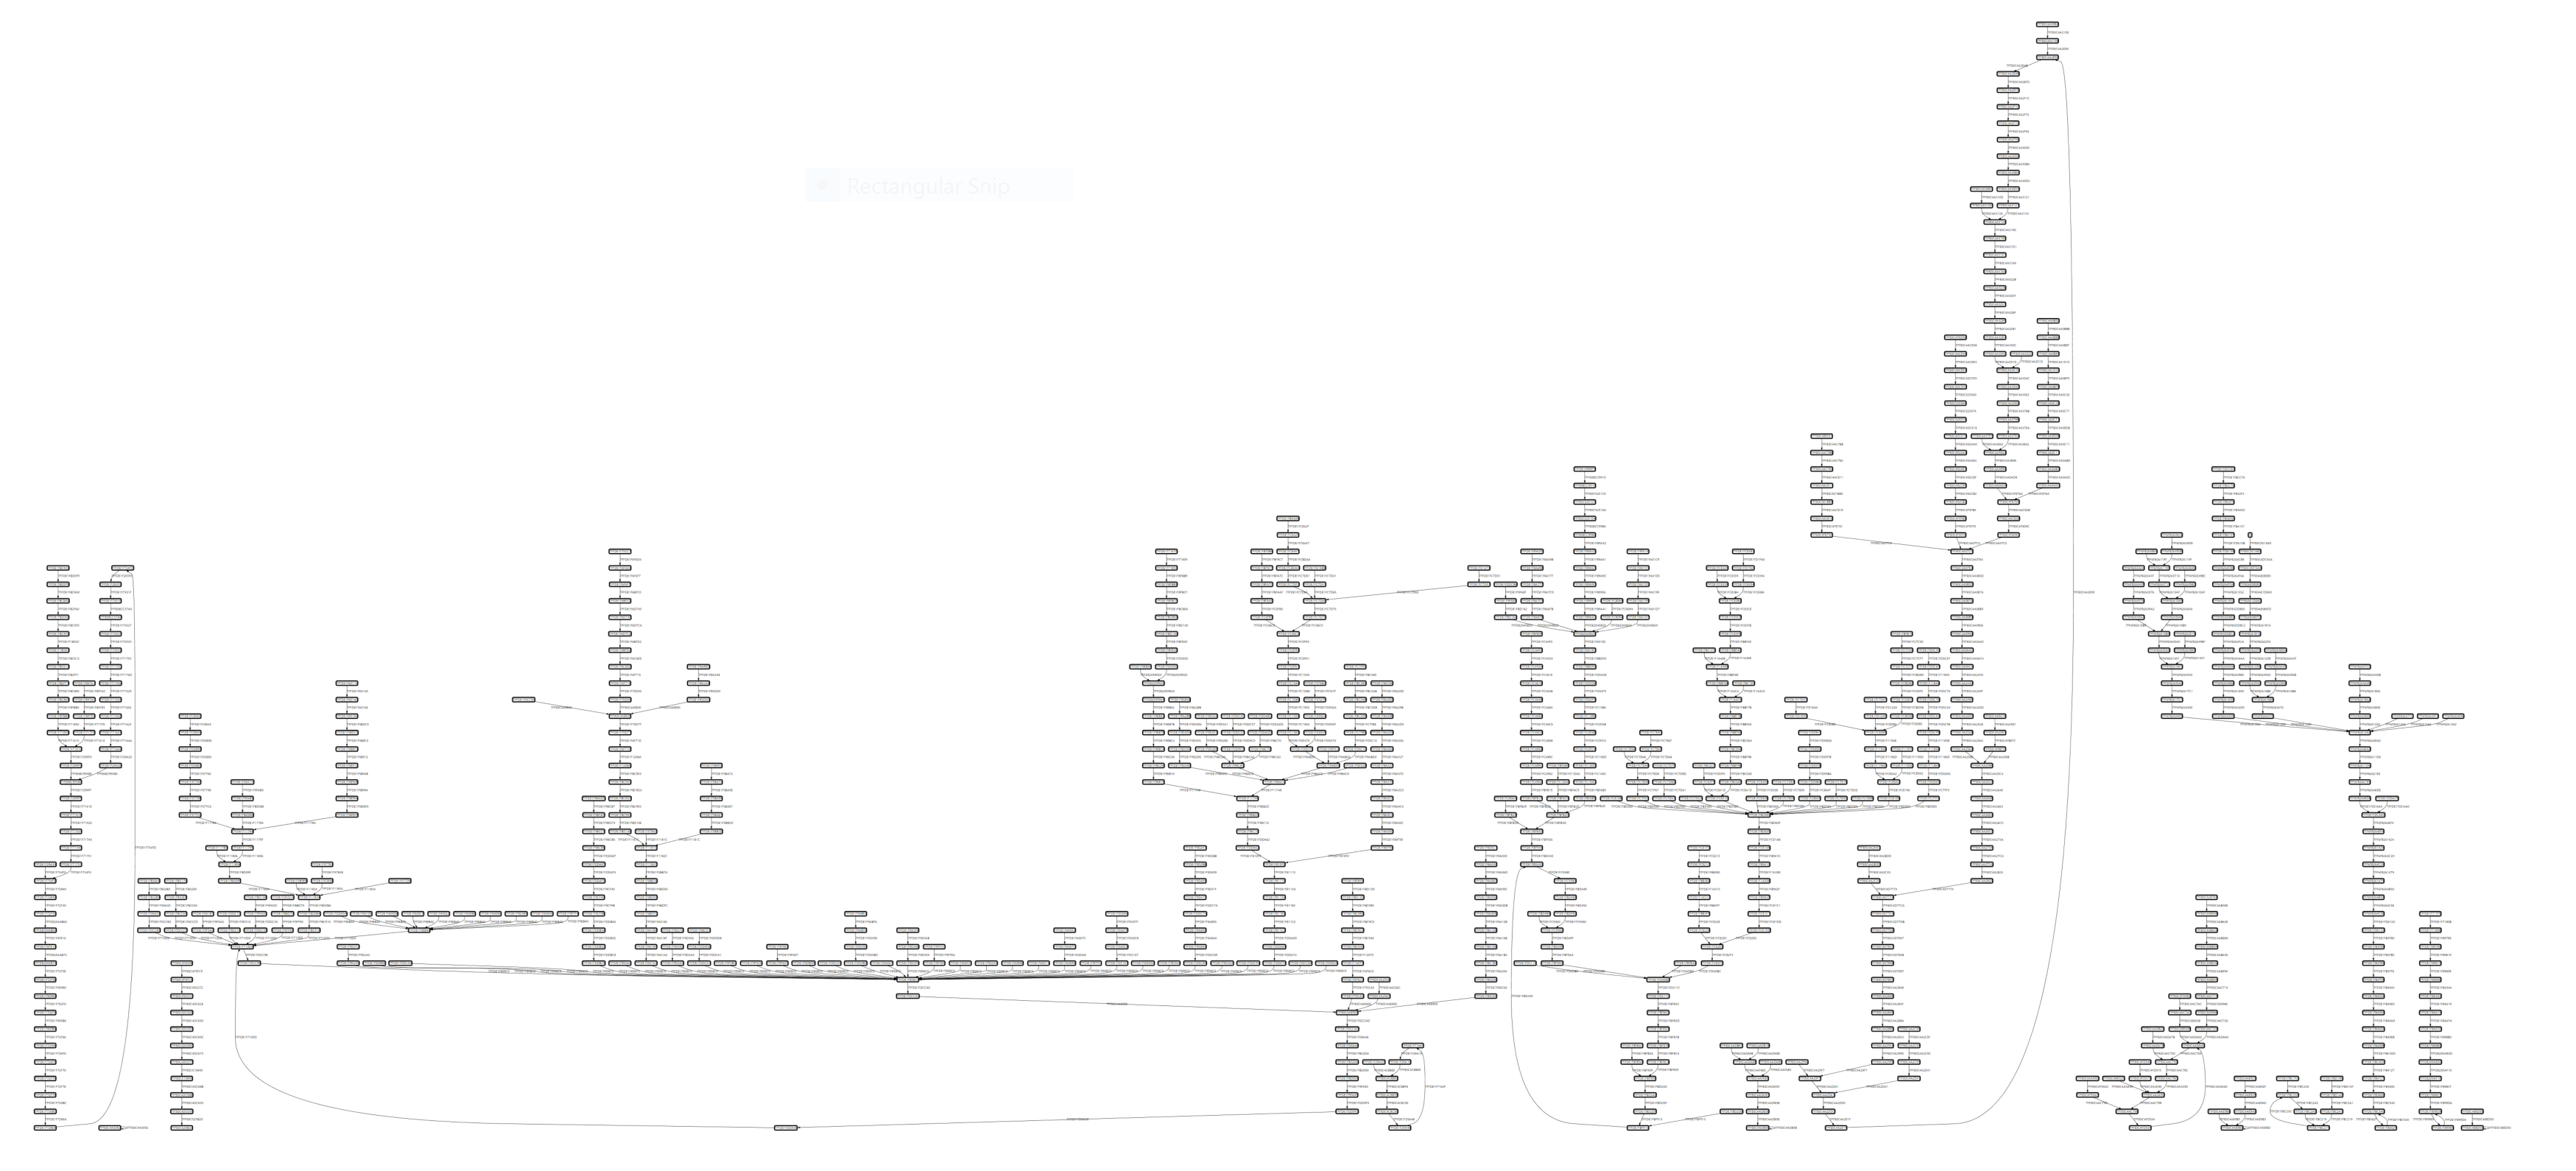
CSW16 demo tracing notepad.exe without symbols:
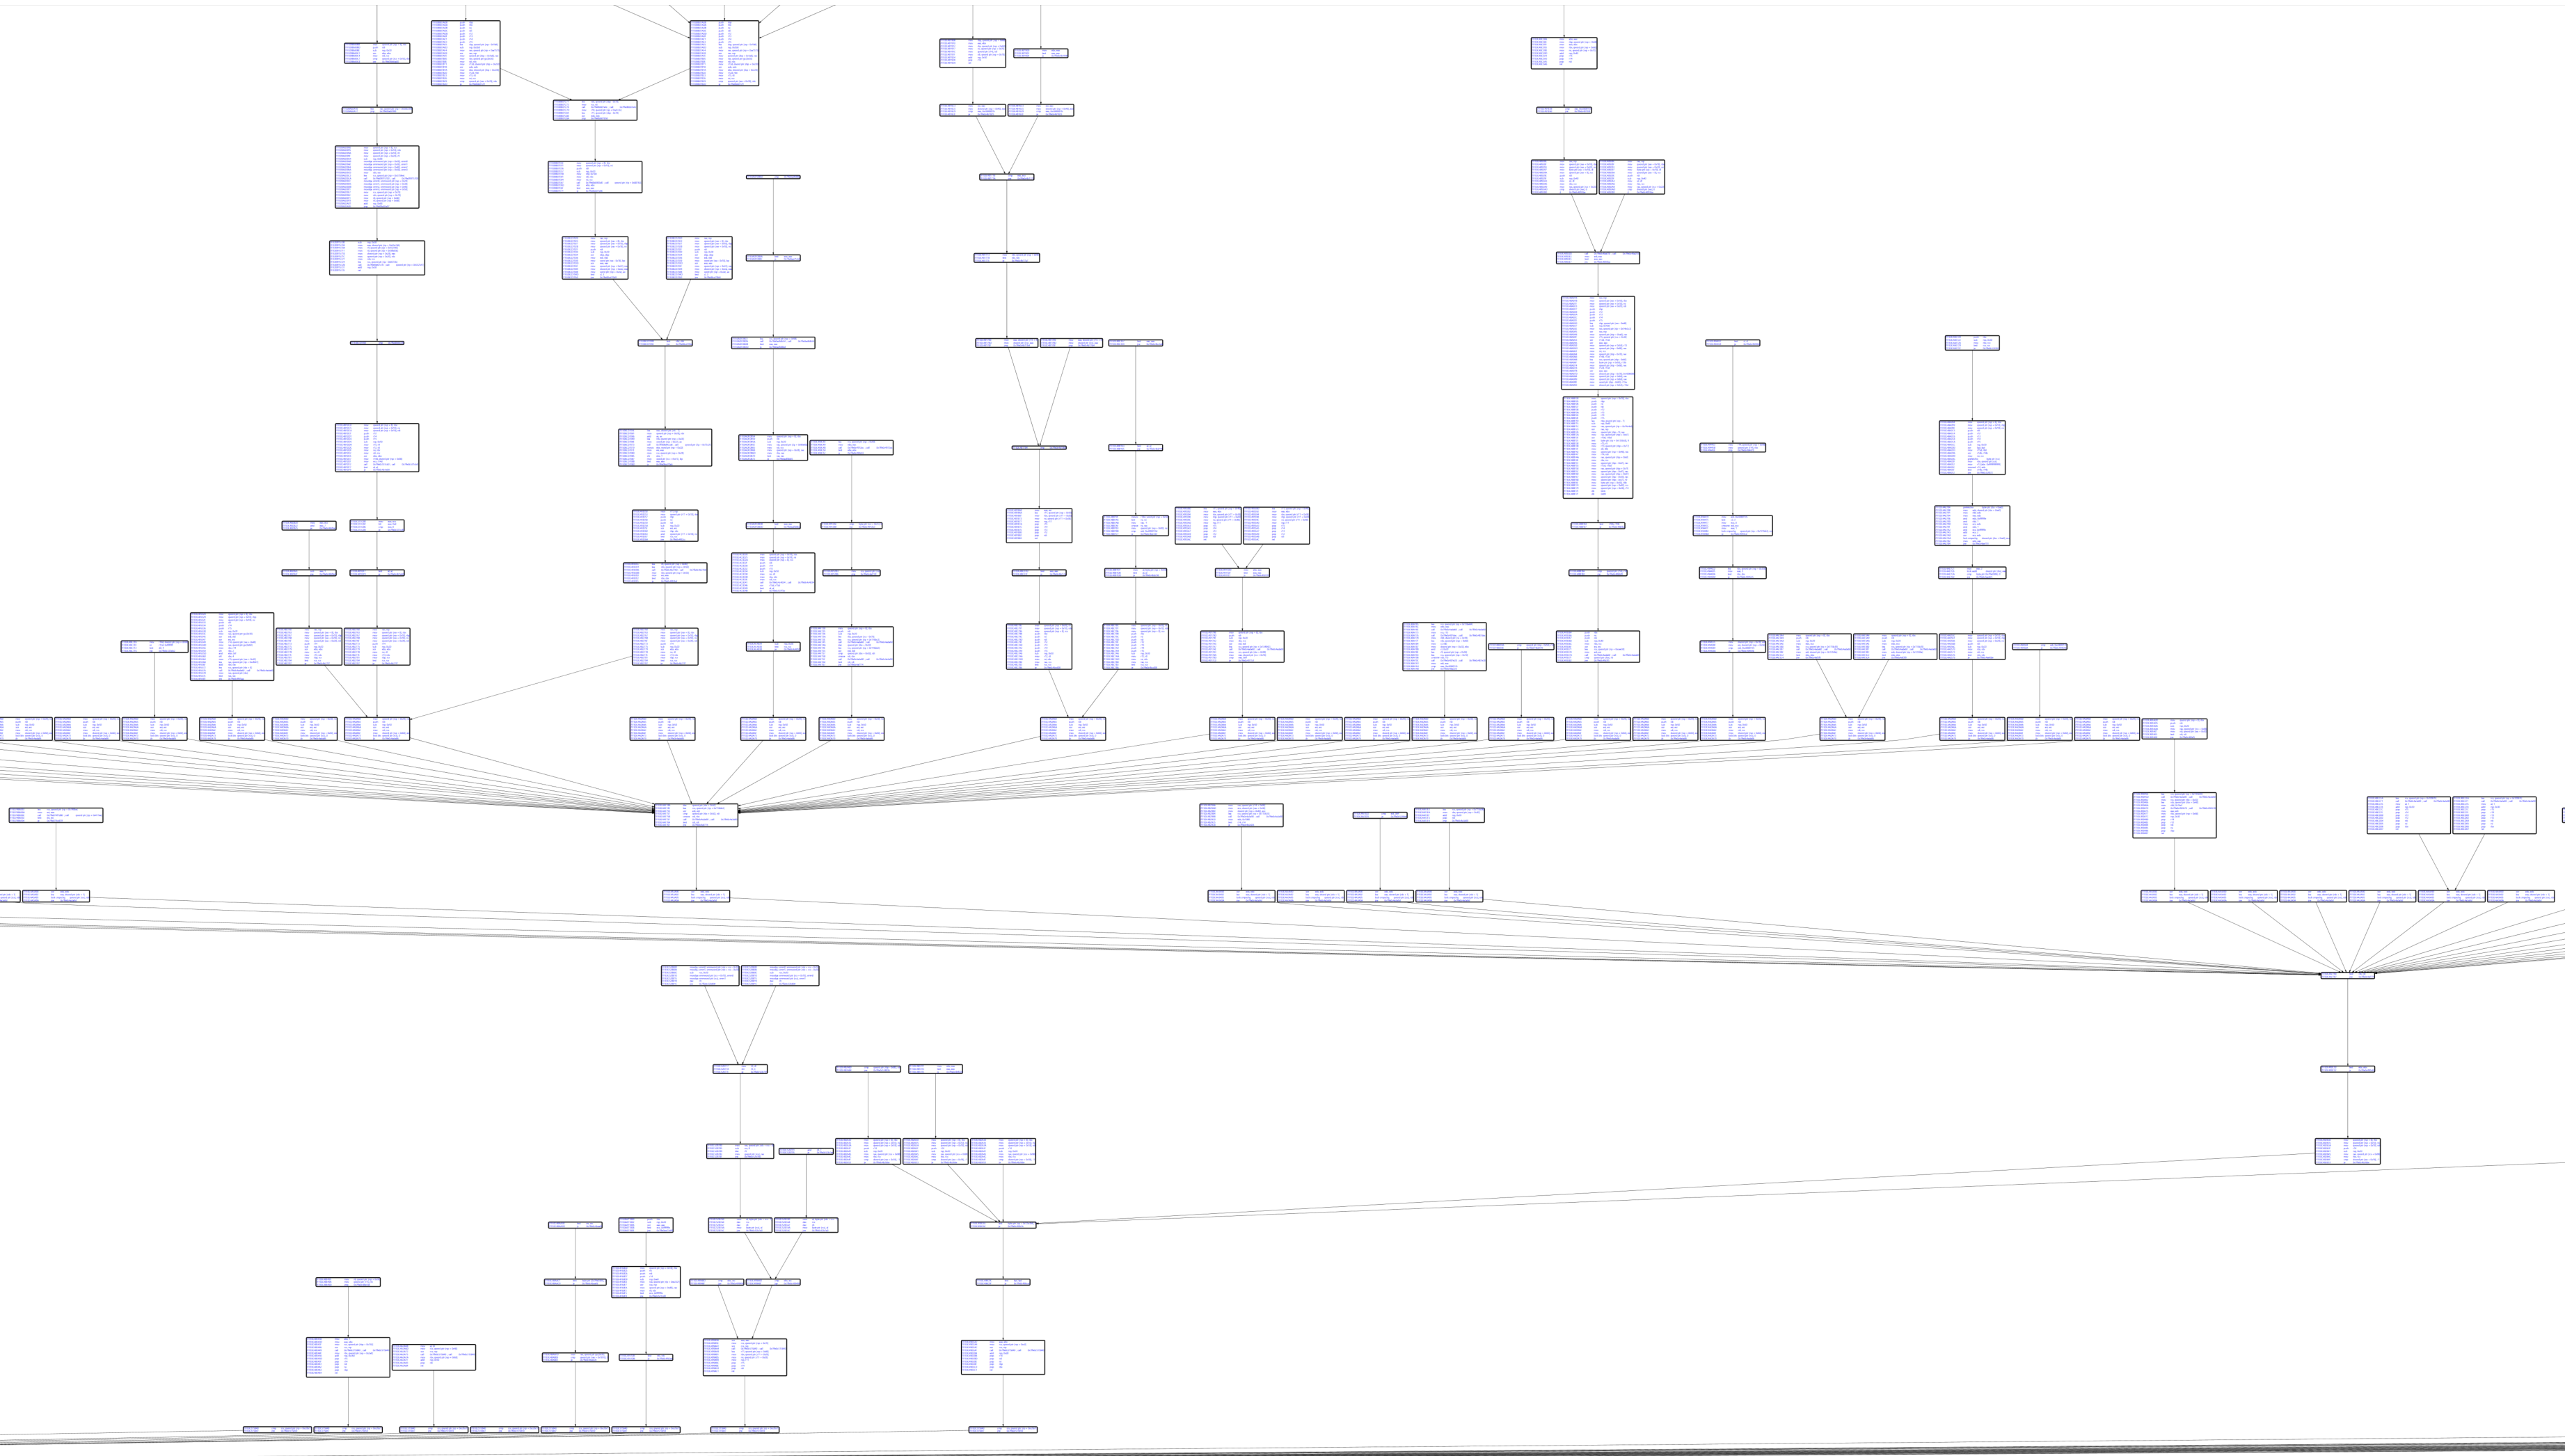
Basic block graph with Capstone disassembly:
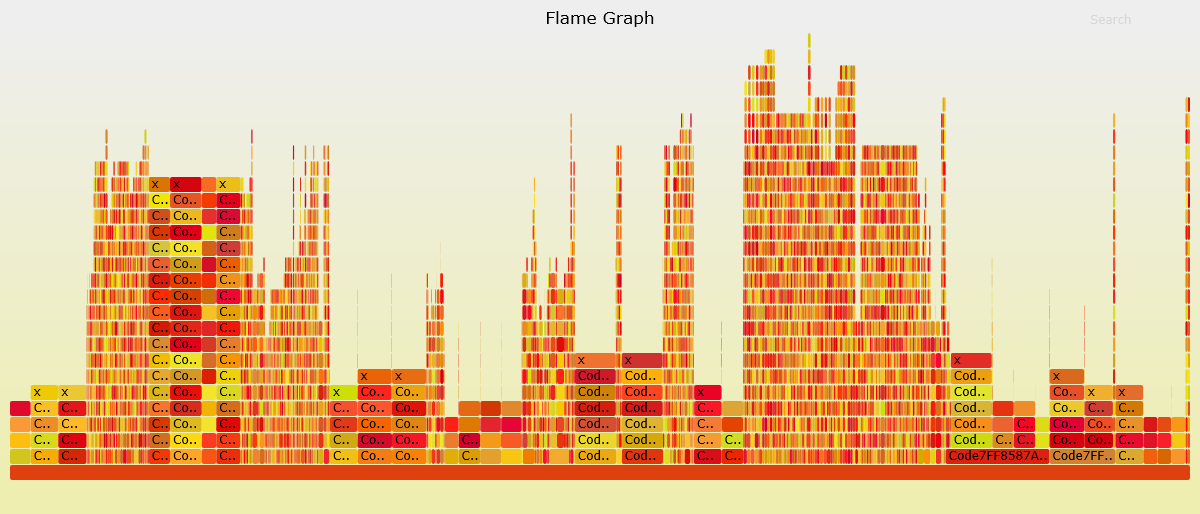
Code coverage visualization:
graph TD
    subgraph Core["🎯 Core Components"]
        EH[EhTrace.dll<br/>Main Instrumentation]
        AC[Acleanout<br/>Log Dumper]
        AG[Agasm<br/>Graph Generator]
        style EH fill:#e1bee7,stroke:#6a1b9a,stroke-width:3px,color:#000
        style AC fill:#c5cae9,stroke:#3949ab,stroke-width:3px,color:#000
        style AG fill:#b2dfdb,stroke:#00695c,stroke-width:3px,color:#000
    end

    subgraph Tools["🔧 Supporting Tools"]
        AL[Aload<br/>DLL Injector]
        AP[Aprep<br/>Test EXE]
        AS[Astrace<br/>Stack Tracer]
        style AL fill:#ffe0b2,stroke:#e65100,stroke-width:3px,color:#000
        style AP fill:#f8bbd0,stroke:#c2185b,stroke-width:3px,color:#000
        style AS fill:#d1c4e9,stroke:#512da8,stroke-width:3px,color:#000
    end

    subgraph Fuzzing["🐛 Fuzzing Integration"]
        AWA[AWinAFL<br/>AFL Instrumentation]
        style AWA fill:#ffccbc,stroke:#d84315,stroke-width:3px,color:#000
    end

    subgraph Viz["📊 Visualization"]
        WPF[WPFx<br/>Graph Viewer]
        DIA[Dia2Sharp<br/>Symbol Resolver]
        ASF[AStackFolding<br/>Flame Graphs]
        style WPF fill:#c8e6c9,stroke:#2e7d32,stroke-width:3px,color:#000
        style DIA fill:#fff9c4,stroke:#f9a825,stroke-width:3px,color:#000
        style ASF fill:#ffecb3,stroke:#ff8f00,stroke-width:3px,color:#000
    end

    EH -->|Logs| AC
    AC -->|Data| AG
    AG -->|Graphs| WPF
    AL -->|Inject| EH
    DIA -->|Symbols| AG
    ASF -->|Process| AC
    AWA -->|Variant| EH

    style Core fill:#f3e5f5,stroke:#7b1fa2,stroke-width:4px
    style Tools fill:#fff3e0,stroke:#ef6c00,stroke-width:4px
    style Fuzzing fill:#fbe9e7,stroke:#bf360c,stroke-width:4px
    style Viz fill:#e8f5e9,stroke:#388e3c,stroke-width:4px
The EhTrace ecosystem consists of several integrated projects:
- EhTrace: The main instrumentation DLL (can also be built as EXE for testing)
- Acleanout: Dumps trace logs from shared memory created by EhTrace
- Agasm: Glue/disassembly tool for generating graphs with symbols and Capstone integration
- Aload: DLL injection utility
- Aprep: Test executable (EhTrace built as EXE)
- Astrace: Stack tracing utilities
- AKeyTest: Cryptographic key escrow testing
- AWinAFL: AFL-compatible fuzzing instrumentation for Windows
- WPFx: WPF-based visualization using MSAGL graphing library
- Dia2Sharp: C# DIA2 wrapper for symbol processing
- TestDump2: Test application for Dia2Sharp
- Amerger: Log merging utilities
- AStackFolding: Stack trace folding for flame graph generation
- Visual Studio 2015 or later (C++ toolchain)
- Windows SDK
- .NET Framework (for visualization tools)
- dbghelp.dll: Symbol resolution (included in support directory)
- symsrv.dll: Symbol server support (included in support directory)
- Capstone: Disassembly engine (libraries in support directory)
- MSAGL: Graph visualization (Microsoft Automatic Graph Layout)
- Open
EhTrace.slnin Visual Studio - Select your target configuration (Debug/Release) and platform (x86/x64)
- Build the solution
For detailed build instructions, see BUILDING.md
- Build or obtain EhTrace.dll
- Inject EhTrace.dll into target process using Aload or your preferred injection method
- Run the target application
- Collect trace data using Acleanout
- Visualize results using WPFx or custom analysis tools
# Build EhTrace
msbuild EhTrace.sln /p:Configuration=Release /p:Platform=x64

# Inject into target
Aload.exe target.exe EhTrace.dll

# Collect trace data
Acleanout.exe > trace.log

# Analyze with Agasm
Agasm.exe trace.log output.graph
For comprehensive usage documentation, see USAGE.md
EhTrace supports runtime configuration through the BlockFighters framework. Configure tracing behavior by modifying the fighter configuration in your build.
Available fighters:
- RoP Fighter: Detects ROP gadget chains
- Key Escrow Fighter: Intercepts cryptographic operations
- AFL Fighter: Provides fuzzing instrumentation
- Custom Fighters: Implement your own analysis logic
EhTrace/
├── EhTrace/          # Core instrumentation DLL
├── prep/             # Supporting tools and utilities
├── vis/              # Visualization components
├── support/          # Dependencies and resources
├── doc/              # Documentation
└── afl-fuzz/         # AFL fuzzing integration
EhTrace.cpp: Main VEH handler and core logicBlockFighters.cpp: Fighter framework implementationConfig.cpp: Configuration and symbol managementGlobLog.cpp: Shared memory loggingKeyEscrow.cpp: Cryptographic key interceptionRoP-Defender.cpp: ROP detection logic
This project is licensed under the GNU Affero General Public License v3.0 - see the LICENSE file for details.
Copyright (C) 2014-2016 Shane Macaulay
Contributions are welcome! Please ensure your code follows the existing style and includes appropriate testing.
Shane Macaulay (Shane.Macaulay@IOActive.com)
- Capstone disassembly framework
- Microsoft Automatic Graph Layout (MSAGL)
- AFL fuzzing framework
- The security research community
For more technical details, see:
- ARCHITECTURE.md - Technical architecture documentation
- doc/ - Additional documentation and presentations