Skip to content

LeonKie/vis-munich-corona-occupancies

Folders and files

NameName
Last commit message
Last commit date

Latest commit

687a909 · Mar 14, 2022

History

39 Commits
Mar 11, 2021
Mar 11, 2021
Jan 29, 2022
May 21, 2021
May 14, 2021
May 12, 2021
Apr 1, 2021
Mar 14, 2022
May 12, 2021
Mar 11, 2021
Jan 29, 2022
May 21, 2021
May 21, 2021
May 21, 2021
Mar 11, 2021
Mar 14, 2022

Repository files navigation

vis-munich-corona-occupancies

This is a Visualization of the Occupancies in Munich.

Website

bubblePreview

Api

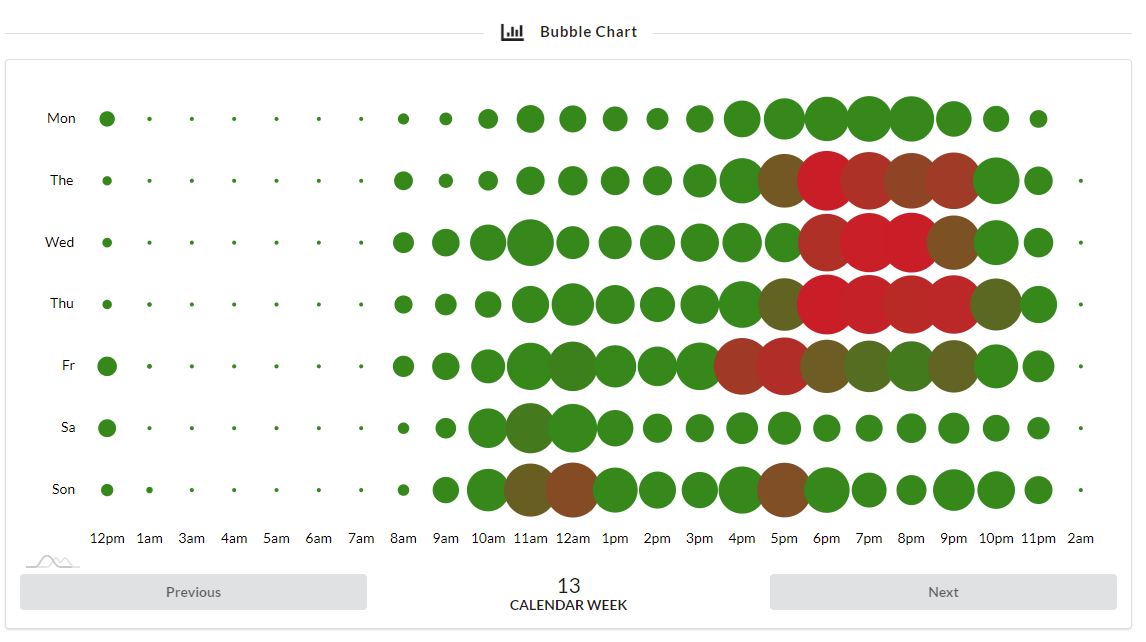
This website is a visual demonstration of the data from the munich-corona-occupancies API.

Usage

I am using a Bubble chart to plot the occupancie (in percent) along every hour for every weekday. This makes is possible so easyly plan your visit based on previouse data.

About

Visualization of corona Occupancies in Munich

Resources

Stars

Watchers

Forks

Releases

No releases published

Packages

No packages published