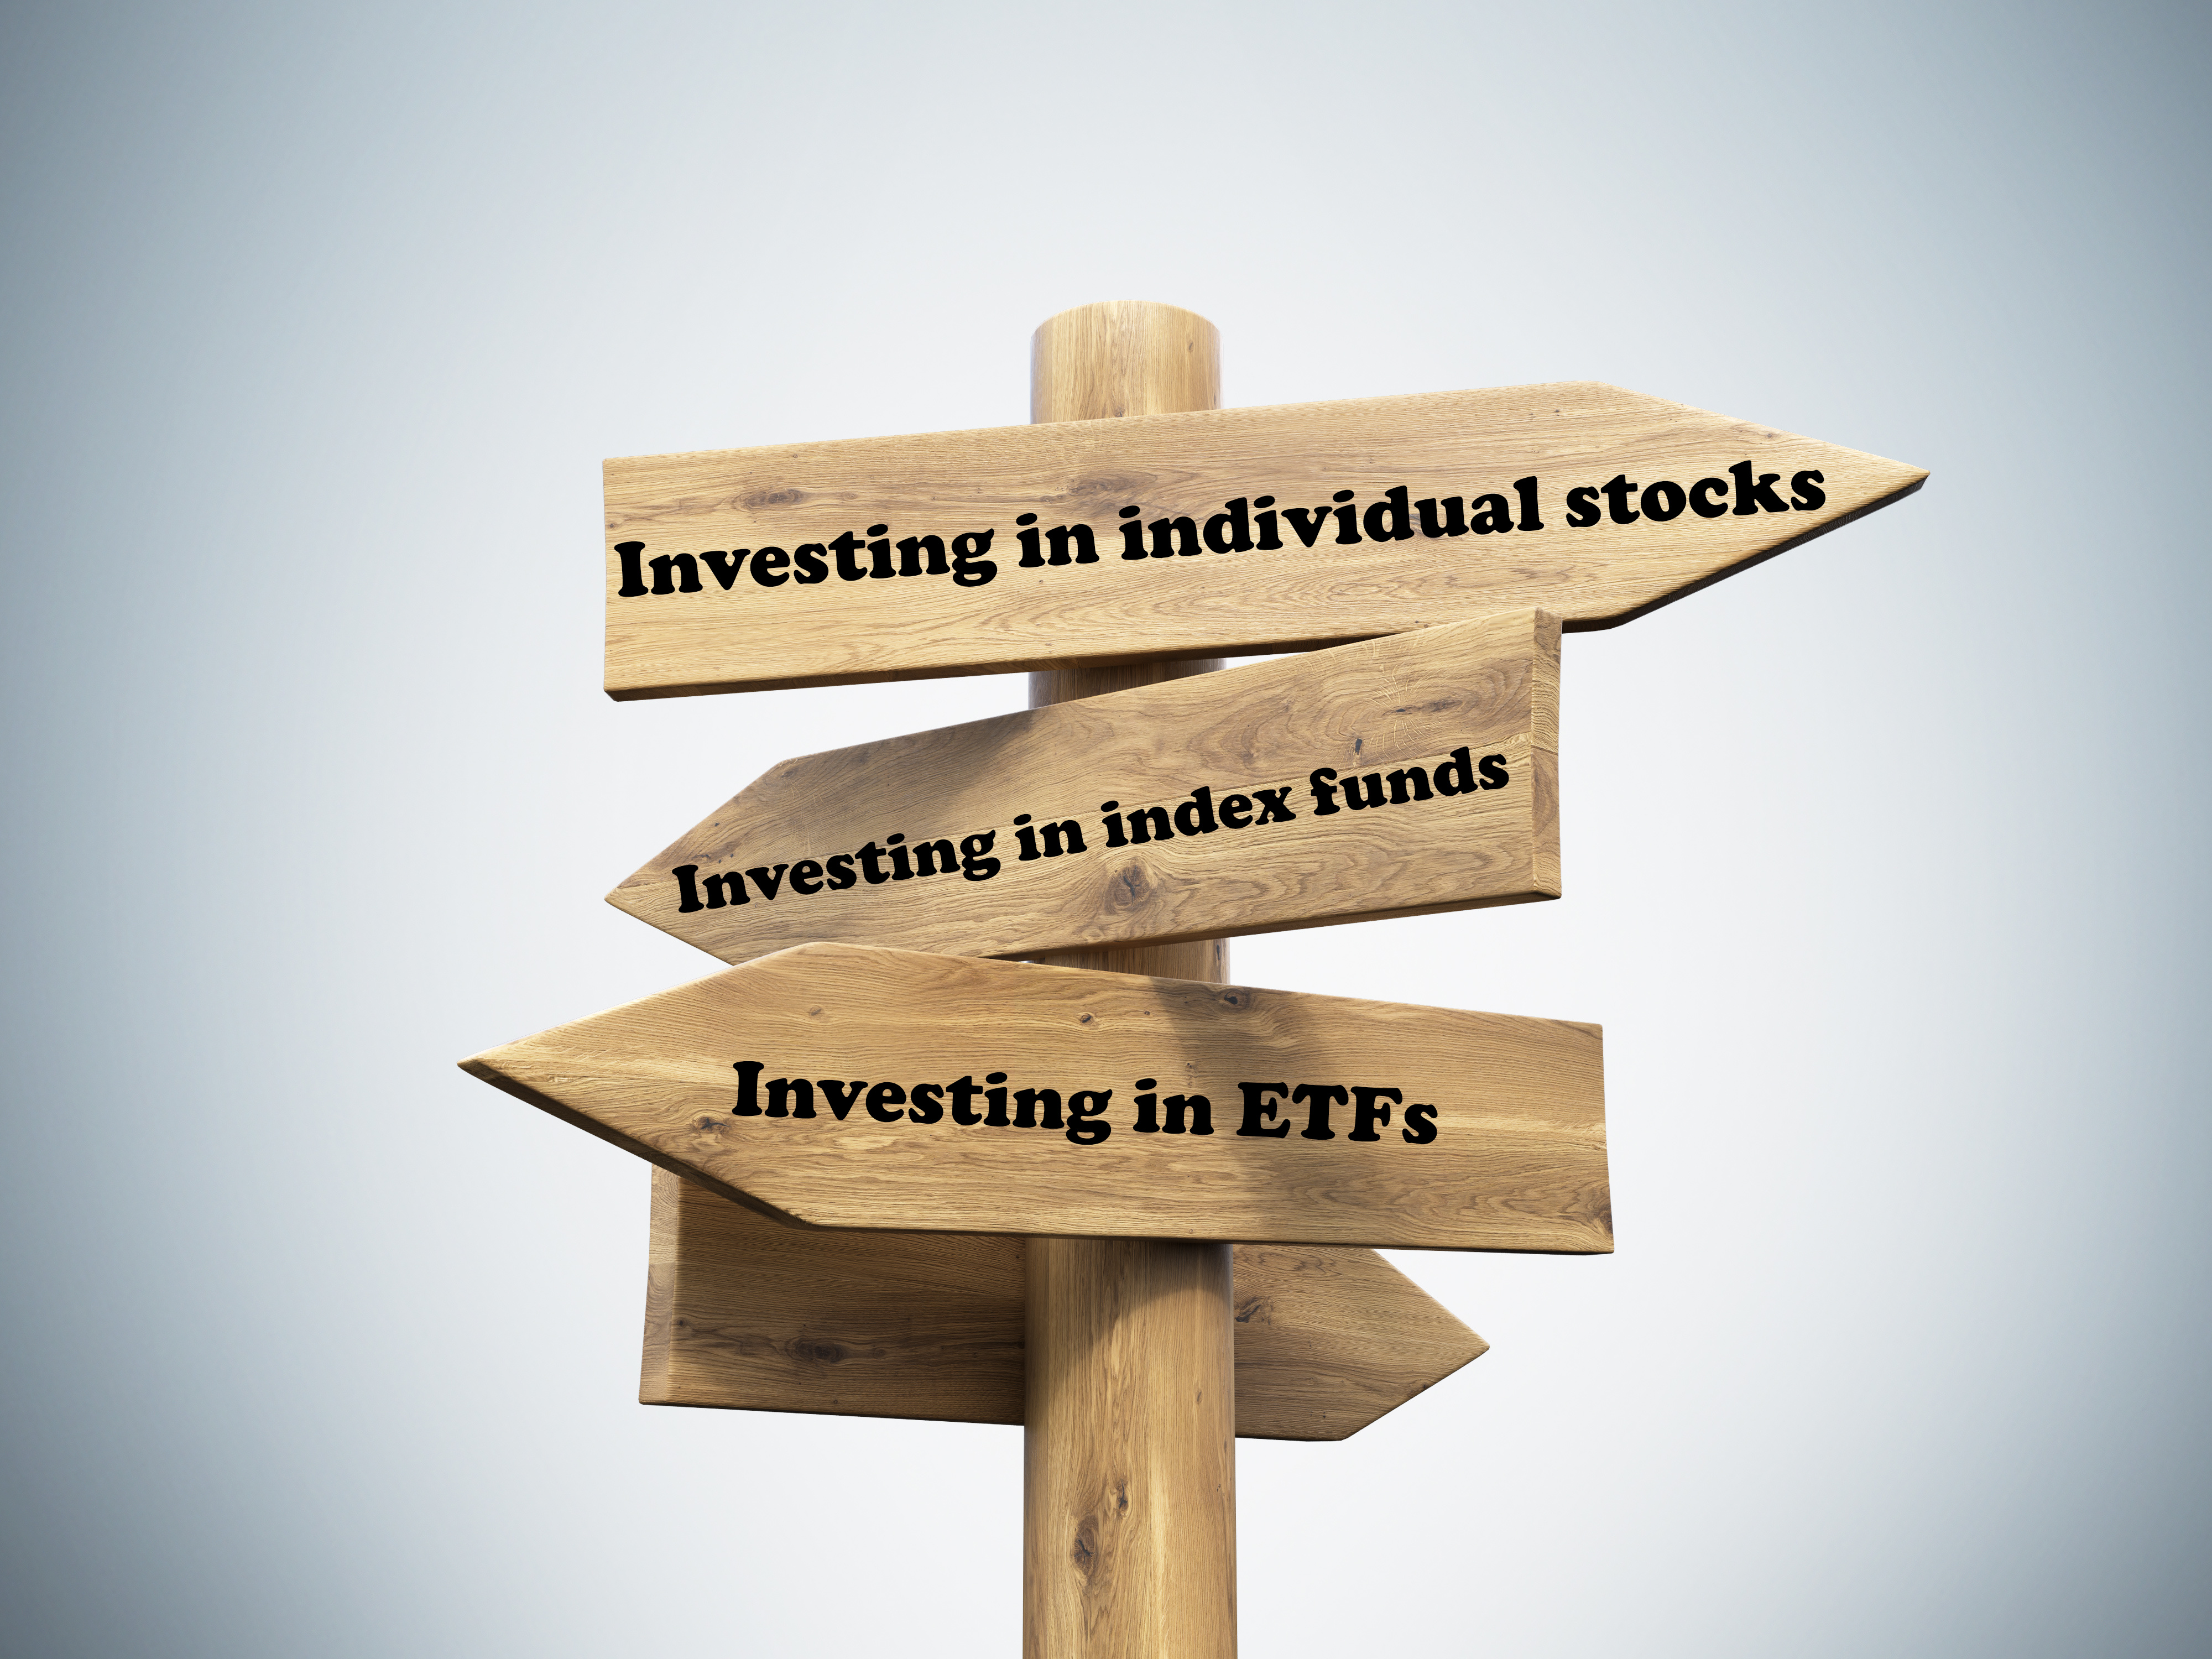
Do ETFs (Exchange Traded Funds) traded on NASDAQ & NYSE provide a more optimized & diversified portfolio based on month end returns when compared to individual stocks traded on NASDAQ & NYSE during moments of market disruption?
What do we mean by market disruption? We consider them to be any situation where the market ceases to function in a normal manner, including physical disruptions (i.e. natural disasters) or market crashes.
What are ETFs? An ETF is a collection or "basket" of individual stocks, bonds, or other investments, all pooled together into a single asset type. When a person elects to invest in a share of an ETF, they will own a fraction of that pool of investments.
In this project, we will take a look at the following market disruption date durations, comparing the ETFs versus individual stocks within these periods to determine if a collection of solely ETFs provide a more optimized portfolio over a collection of solely stocks during periods of disruption:
- 2015–16 Stock Market Selloff: 6/1/2015 - 6/30/2016.
- Subprime loan/Financial Crisis: 12/27/2007 - 6/30/2009 (Based on when unemployment rate peaked).
- COVID Pandemic: 2/20/2020-2/1/2022 (we elected to end our COVID period 2/1/2022 to ensure we have a true month close figure for our analysis).
We will determine the ETFs & indivdual stocks to review for portfolio optimization within the exploratory data analysis section, pulling the top 200 stocks for our analysis. We then apply Markowitz Portfolio Theory to understand the most optimal & diversified portfolio of ETFs versus Stocks using a Monte Carlo simulation and Sharpe Ratio. Lastly, we wrap up with Hypothesis testing, our conclusions & future study takeaways.
In this section, we work to collect data from the following sources to help us answer our project topic:
AlphaVantage: API endpoint classified stocks & ETFs into separate Asset Types for which we will use to compare in our analysis.Polygon.io API: Provide real time & historical data for US Stocks, used in our assignment to determine top 200 ETFs & Stocks during the moments of market disruptions included in this study.yfinance: Pull daily data for each stock and ETF to allow us to more easily infer portfolio optimization in the project.
One aspect of ETFs that we have not touched on in this report is the “black box” nature of their creation. ETFs are a manufactured collection of stocks, bonds, commodities, and other tradable assets. ETF providers such as Blackrock or Vanguard, pull in a lot of profit from the sales of their ETFs. Blackrok’s iShares generated “about $2.4 billion from its share of the ETF market” And ETFs are only growing more popular by the day as they provide a convenient, off the shelf package for investors to instantly diversify their portfolios. This convenience comes at a cost where the investor has to just accept that the ETF provider is calling the shots on what assets are in the ETF itself.
Common belief is that ETFs provide lower returns but are generally a less risky investment than stocks due to their lower volatility. Our project illustrates the fact that ETFs had higher average closing prices but appeared to have lower returns. Plotting the returns of both stocks and ETFs, we saw that ETFs had a lower amplitude. Monte Carlo simulations and Sharpe Ratio suggest that ETFs have higher returns with higher risk; stocks had higher returns with lower risk. Note also when we tested this hypothesis, we found that, at least during periods of market disruptions, there was no difference in average returns between Stocks and ETFs. This could be surprising at first, but illustrates how even the most resilient ETFs are not immune to wold events and disruptions.
In the future we hope to expand this to look at more data, as the way we selected our data by only looking at the top stocks and ETFs determined by their mean trading volume potentially introduced sampling bias into our dataset. By looking at only the most popular stock, our data had stocks like Tesla and AMC, both very popular stocks in the cultural zeitgeist of 2021, and stocks that are traded by their brand name value rather than the companies actual worth. We could potentially improve the outcome of our models and tests, by looking at randomly selected stocks and ETFs from the same time periods, which could provide a more conclusive picture of the market behavior.
This assignment contains 2 areas:
- Presentation: Powerpoint presentation to support the deliverables.
- Summary and Report: Jupyter Notebook including a detailed abstract on problems in assignment, code relevant to project, and visualizations supporting the completion of the project.
Contributors : Lee Whieldon, Sean Reidy
Languages    : Python
Tools/IDE    : Google Collab
Libraries    : Pandas, Matplotlib, Numpy, Scipy, Seaborn, CSV, Requests
Assignment Submitted : March 2022
