-
Notifications
You must be signed in to change notification settings - Fork 42
Getting started
Before you start using DebugEngine features, you need to make sure that your Delphi generates detailed map file for your application. This map file contains a lot of useful information such as segments,units,symbols info. DebugEngine needs those information in order to work correctly.
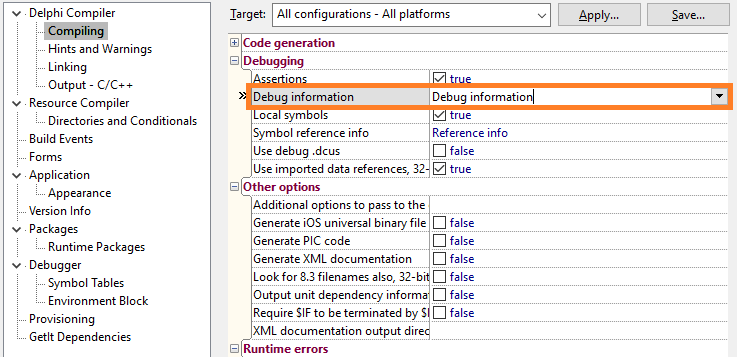
Open your project, and select your "Target" (x64/x86 or both). Then select Project->Options->Compiling->Debugging and make sure that “Debug information” option points to “Debug information”

Select Project->Options->Delphi Compiler->Linking and make the “Map file” option points to “Detailed” and press the Ok button.
Now, each time you compile your application, Delphi will generate a detailed map file associated with your project. From that point, DebugEngine will take the control and it will convert this map (Delphi map file) to it’s file format called “SMAP”. The SMAP file is a binary format of Delphi map file. It’s well structured, small in size and parssed very faster comparable to the original map (Delphi map).
DebugEngine can load map file from different location:
- Disk.
- Resource.
- Section.
If you want to link smap file inside your application, use “DD.exe” command line tool.
Usage: DD [Command][Options][AppFile,MapFile]
Command:
- -h = Display help.
- -c = Convert Delphi map to smap file format.
- -i = Insert debug info (smap) into the target application.
- -r = Remove Delphi debug info from the target application.
Options:
- -p = Compress the smap file.
- -s = If possible, insert debug info into a new section. If it's not possible, debug info will be inserted into application's resource.
AppFile = Executable file.
MapFile = If the command is -c then this should be a Delphi map file. If the -i is used then it should be a SMAP file.
Example:
Conver Delphi map to smap file: DD -c -p "MyApp.map"
Inserting debug info: DD -i "MyApp.exe" "MyApp.smap"
DebugEngine is splitted into units. Each unit performs specified job.
- DebugEngine.Core: This is the DebugEngine core.
- DebugEngine.DebugInfo: Contains map converter,map parser, and address info function. You will find everything related to Delphi map and SMAP file here.
- DebugEngine.DebugUtils: Contains functions to insert, remove and restore debug info.
- DebugEngine.AsmRegUtils: Low level registers snapshot functions and vector registers representation.
- DebugEngine.Trace: Stack trace. Read more about this topic on stack trace wiki page.
- DebugEngine.Disasm: Useful disasm routines.
- DebugEngine.MemoryHack: String detection.
- DebugEngine.PeUtils: Functions related to PE file format.
- DebugEngine.HookException: Integrate DebugEngine stack trace into Delphi. If you use this unit into your project, you will be able to get a stack trace when error happens.
Use GetAddressInfo function to get symbol address, name and its line number.
function GetAddressInfo(Address: Pointer; out Info: TAddressInfo; const Mask: TAddressInfoMask = aimNone): Boolean;- Address = Addres to obtain information on.
- Info = Info record output for the specified address.
- Mask = Query only specified info.This is very useful when processing too many address. It boosts function's speed. It could be one of this:
-
aimNone = No mask will be applied. GetAddressInfo function will query all info :
- SymbolAddress.
- SymbolName.
- UnitName.
- DebugSource.
- LineNumber.
- SourceLocation.
-
aimAddress = GetAddressInfo function will only query:
- SymbolAddress.
- DebugSource.
-
aimSymbolName = GetAddressInfo function will only query:
- SymbolAddress.
- SymbolName.
- UnitName.
- DebugSource.
-
aimNone = No mask will be applied. GetAddressInfo function will query all info :
Use GetSymbolAddress function to get address of symbol.
function GetSymbolAddress(ModuleHandle: THandle; const UnitName, SymbolName: string): Pointer;- ModuleHandle = Module handle where the symbol is located. If you pass zero (0), the function will use the current module handle.
- UnitName = Optional, unit name where the symbol was declared. This is useful when many units declare the same symbol.
- SymbolName = symbol name.
- Return value = If the function succeeds, the return value is the address of the symbol. Otherwise it returns nil.
Example:
var
  P: Pointer;
begin
  { Private variable System.MemoryManager }
  P := GetSymbolAddress(0, 'System', 'MemoryManager');
  { Private method System.SetExceptionHandler }
  P := GetSymbolAddress(0, '', 'SetExceptionHandler');
  { Protected method TCustomForm.CloseModal }
  P := GetSymbolAddress(0, '', 'TCustomForm.CloseModal');
  { Windows api }
  P := GetSymbolAddress(GetModuleHandle(user32), '', 'MessageBoxA');
end;All what you need to do is to include DebugEngine.HookException unit into your project. And each time an error occurs, you will be able to get the stack trace from the point where the error occurred.
uses
  DebugEngine.HookException;

{...}

procedure Foo;
begin
  try
    DoSomething;
  except
    on E: Exception do
      ShowMessage(E.StackTrace);
  end;
end;If you plan to use this feature, you need first to update UnivDisasm.Config.inc file and tell UnivDisasm that you need display feature (Define NEED_DISPLAY). By default, I turned this option off just for optimization. So if you are going to use Disasm and comment feature, you should enable it again.
function DisasmAndCommentFunction(FunctionStartAddress: Pointer; var FunctionEndAddress: Pointer; CallBackFunction: TDisasmCallBack; UserData: Pointer)
: Boolean;- FunctionStartAddress = Function address that you want to disasm.
- FunctionEndAddress = End address where the disasm will stop. If not specified, UnivDisasm will break on the first
retinstruction. - CallBackFunction = A pointer to
TDisasmCallBackfunction. This function will be called byDisasmAndCommentFunctioneach time it decodes an instruction. - UserData = Optional data to pass to CallBackFunction function.
Example:
procedure DisasmCallBack(var Info: TDisasmInfo; UserData: Pointer);
var
  S: String;
begin
  with TMemo(UserData).Lines, Info do
  begin
    S := Format('[$%p]:    %s', [Address, InstStr]);
    if not comment.IsEmpty then
      S := S + '    ; ' + comment;
    Add(S);
  end;
end;

var
  P: Pointer;
begin
  P := nil;
  {LogMem = TMemo}
  LogMem.Clear;
  LogMem.Lines.BeginUpdate;
  try
    DisasmAndCommentFunction(@TMain.BtnLegRegSnapClick, P, DisasmCallBack, LogMem);
  finally
    LogMem.Lines.EndUpdate;
  end;