1.0 About Flamingo
What could Flamingo do for me and why would I want to use it?
Flamingo is a unique software tool that enables 3D Internet traffic data exploration in real-time, and from archived data.
Flamingo provides a series of different visualization methods to illustrate different aspects of the data.
Flamingo includes additional tools/filters to allow people to easily extract “information” from raw NetFlow data.
A white paper on Flamingo can be found here.
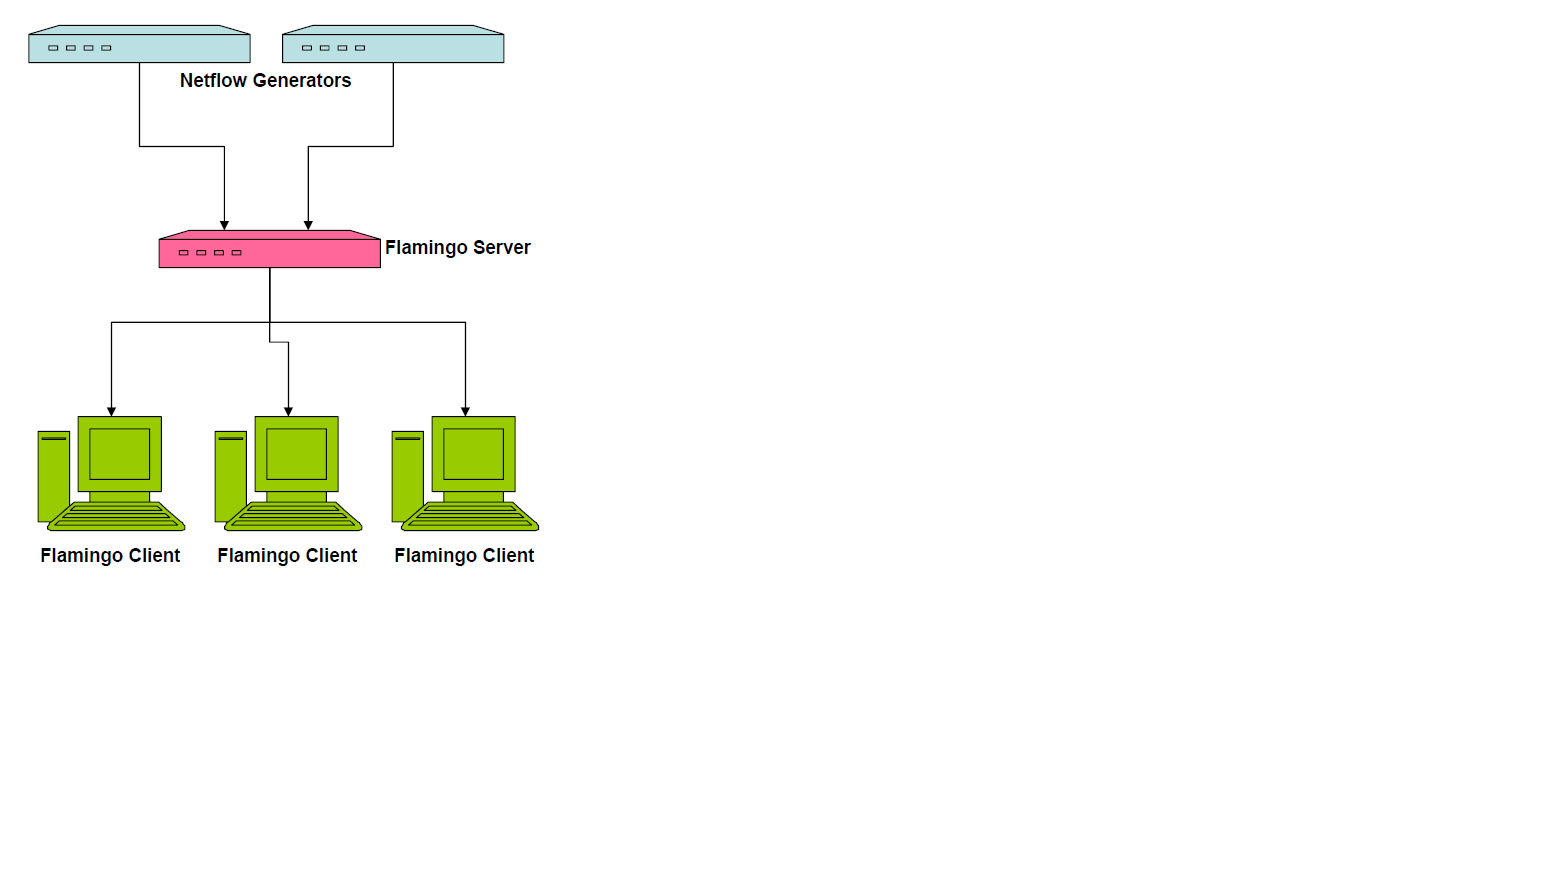
A Flamingo system could be set up like this:
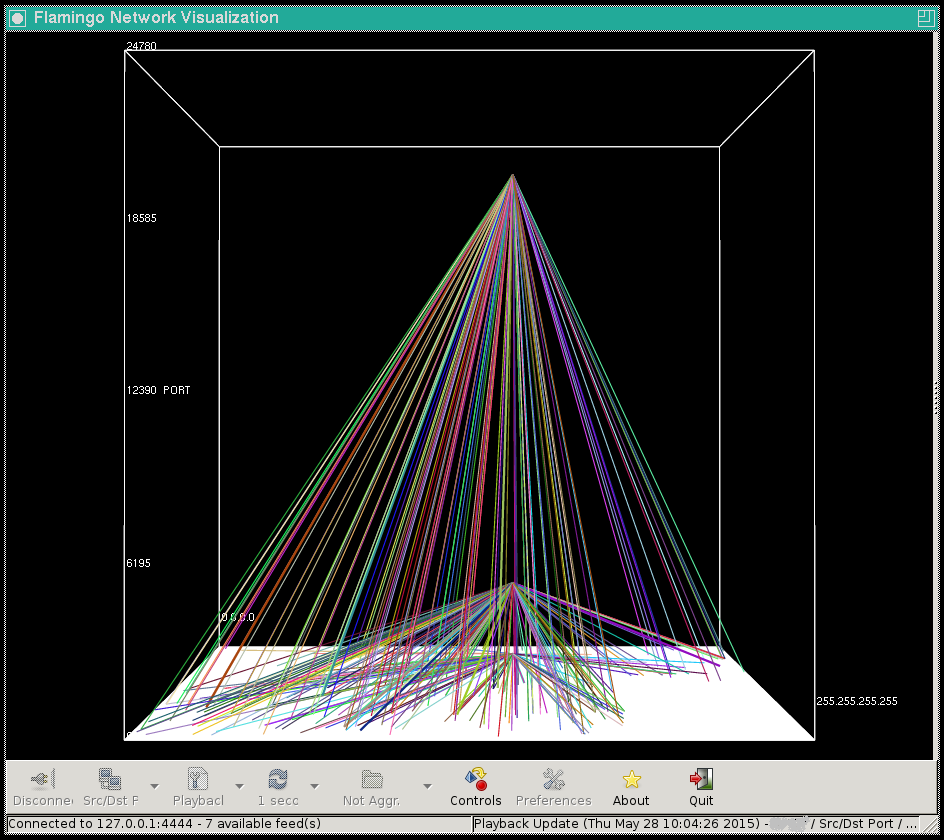
With Flamingo the NetFlow or sFlow data can be displayed visually like this:
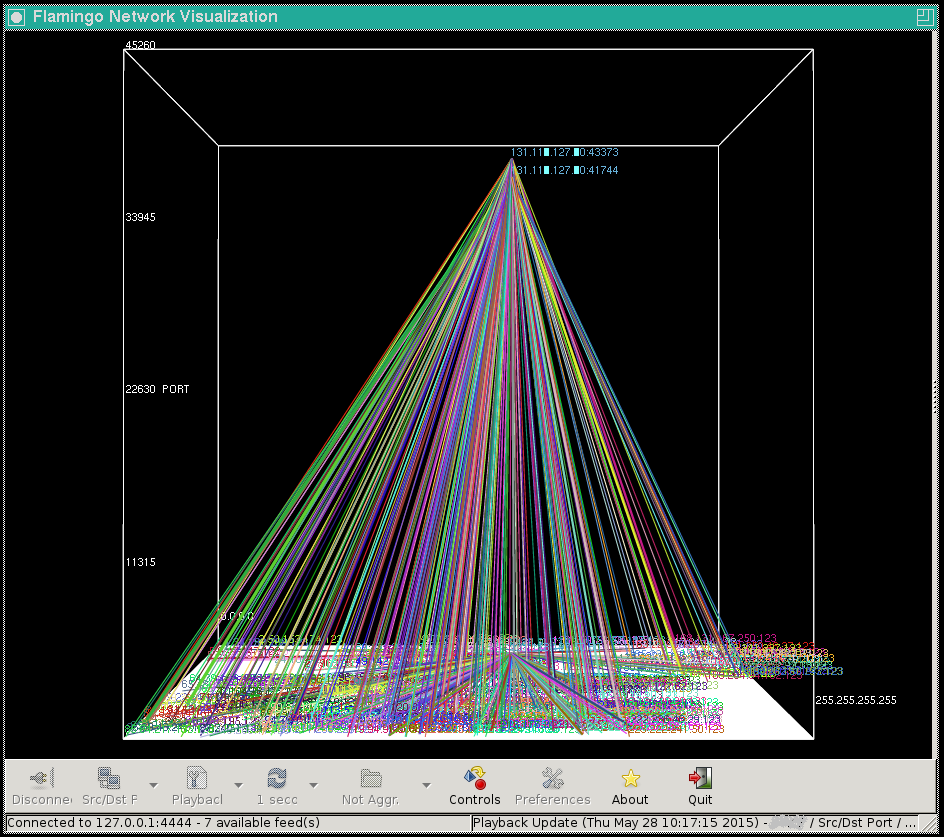
In the image below we show a second wave of the same DDoS attack with a different attack method and with labels turned on (although the target address of the attack has been obscured).
In these particular views, the floor of the cube represents the entire IPv4 address space, TCP and/or UDP ports are represented in the Z axis, with filters adjusted to exclude normal traffic from view. Also, this particular core router is only sampling 1 out of every 4096 packets or flows. As such, each line represents 4 thousand packets.