


Generate pretty charts from your GitHub repos or local files
Table of Contents
Ever wondered what languages you actually use? ghlang makes pretty charts to show you:
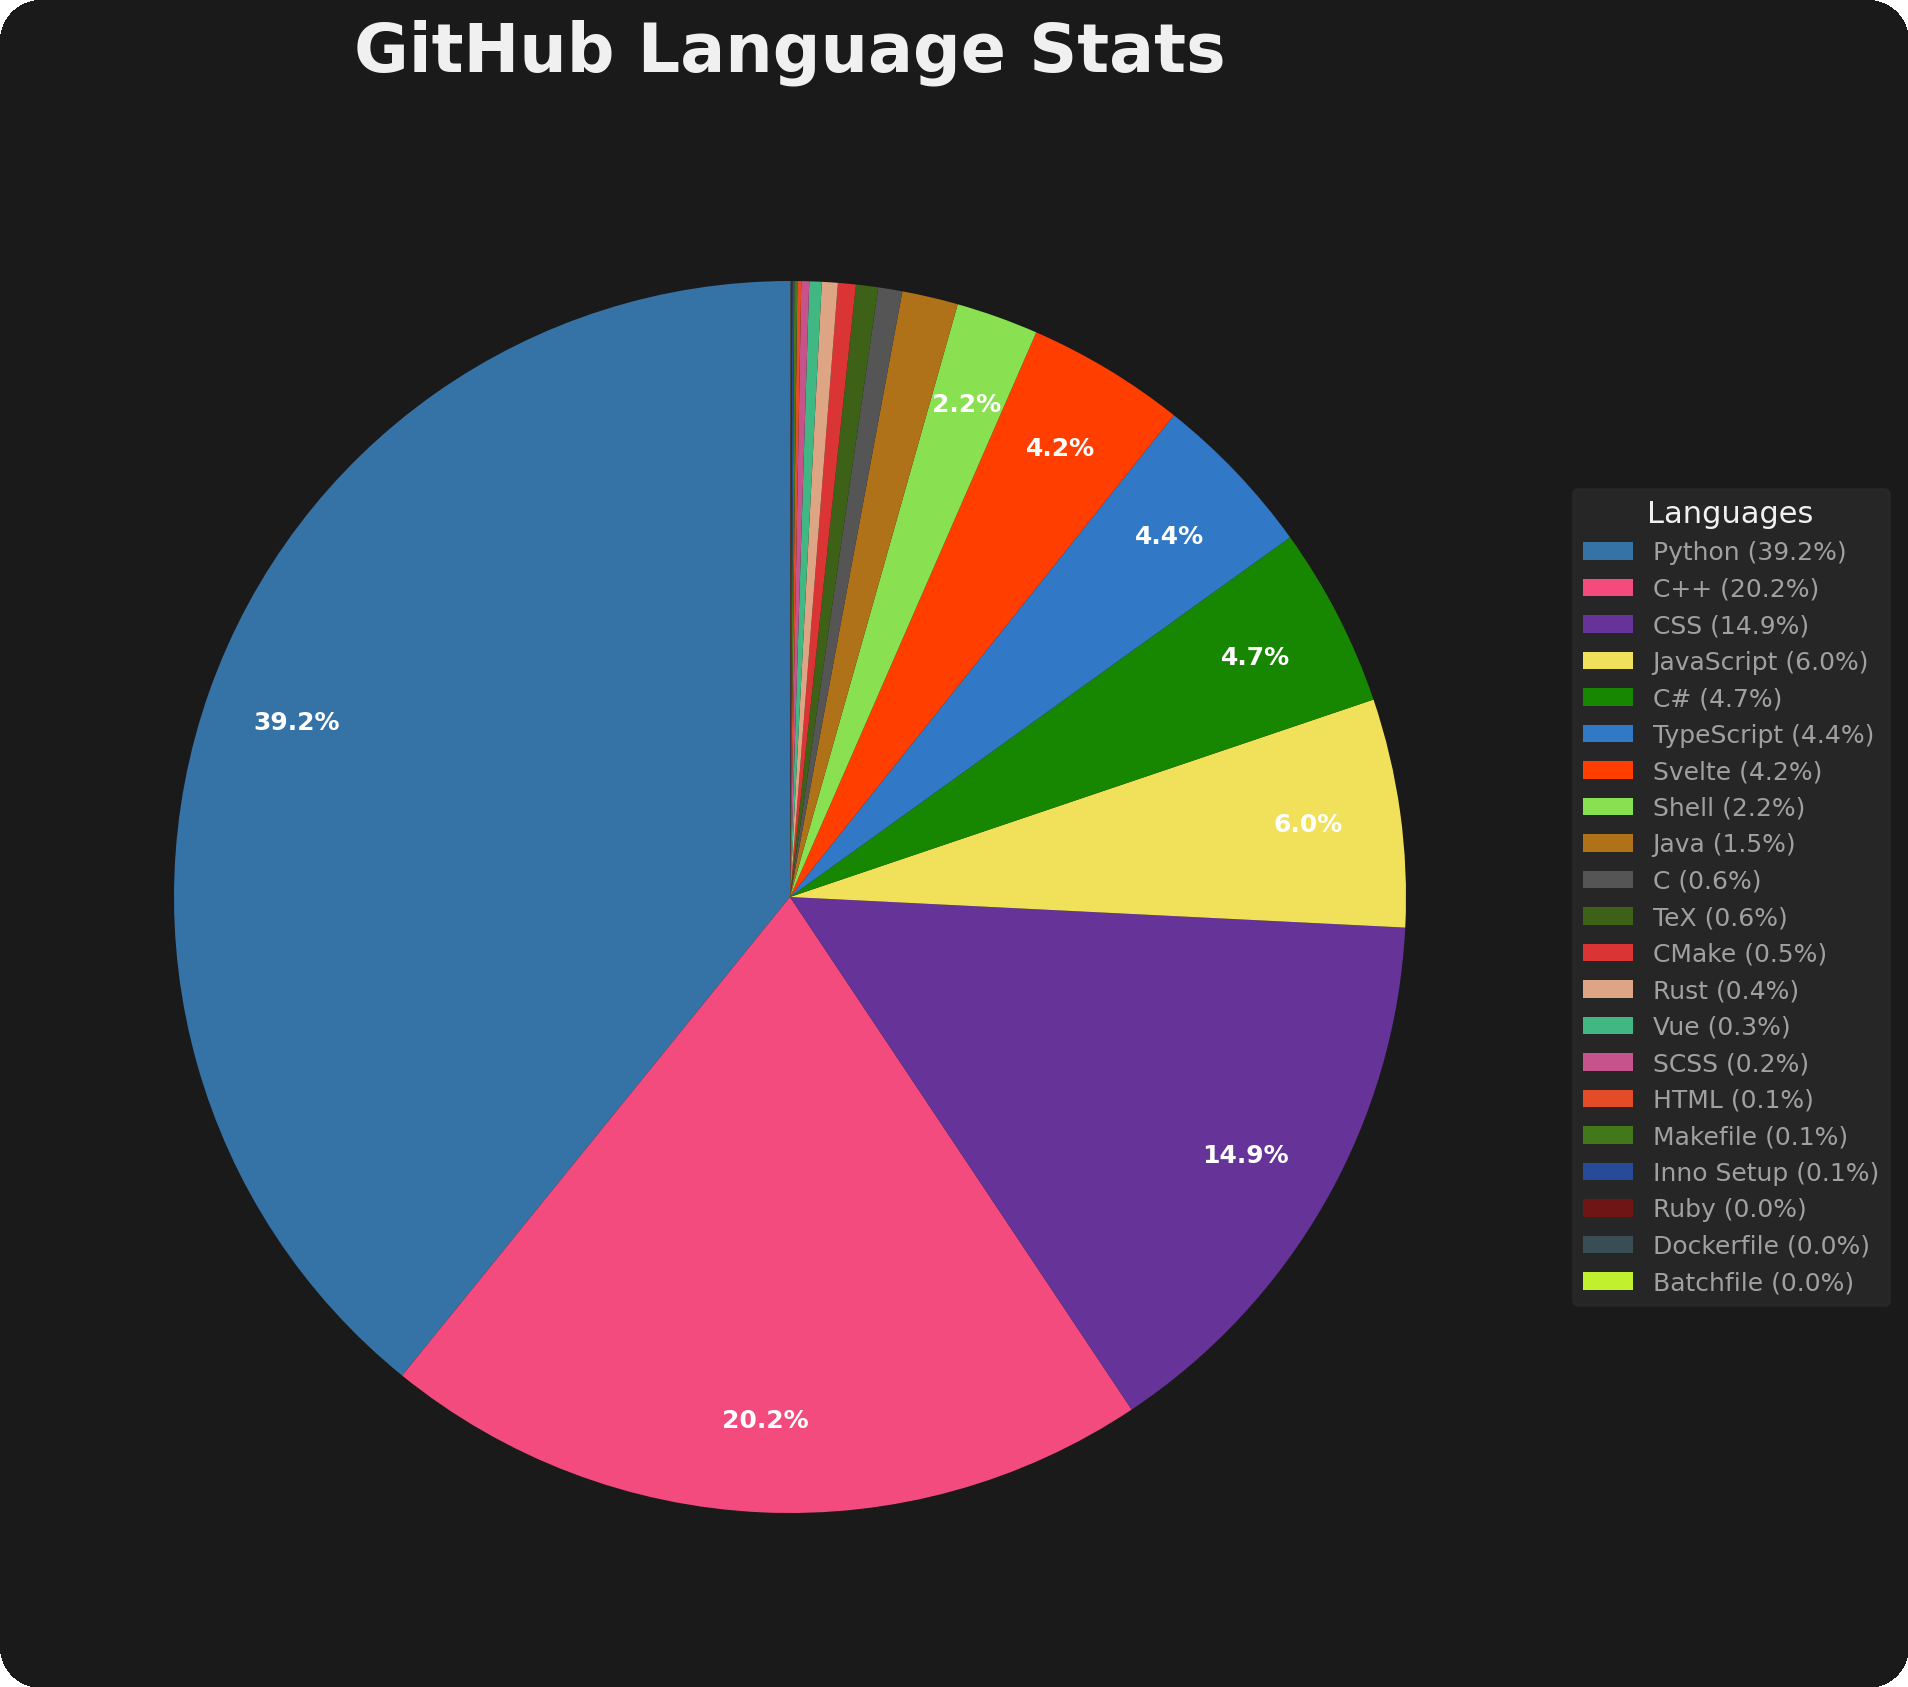
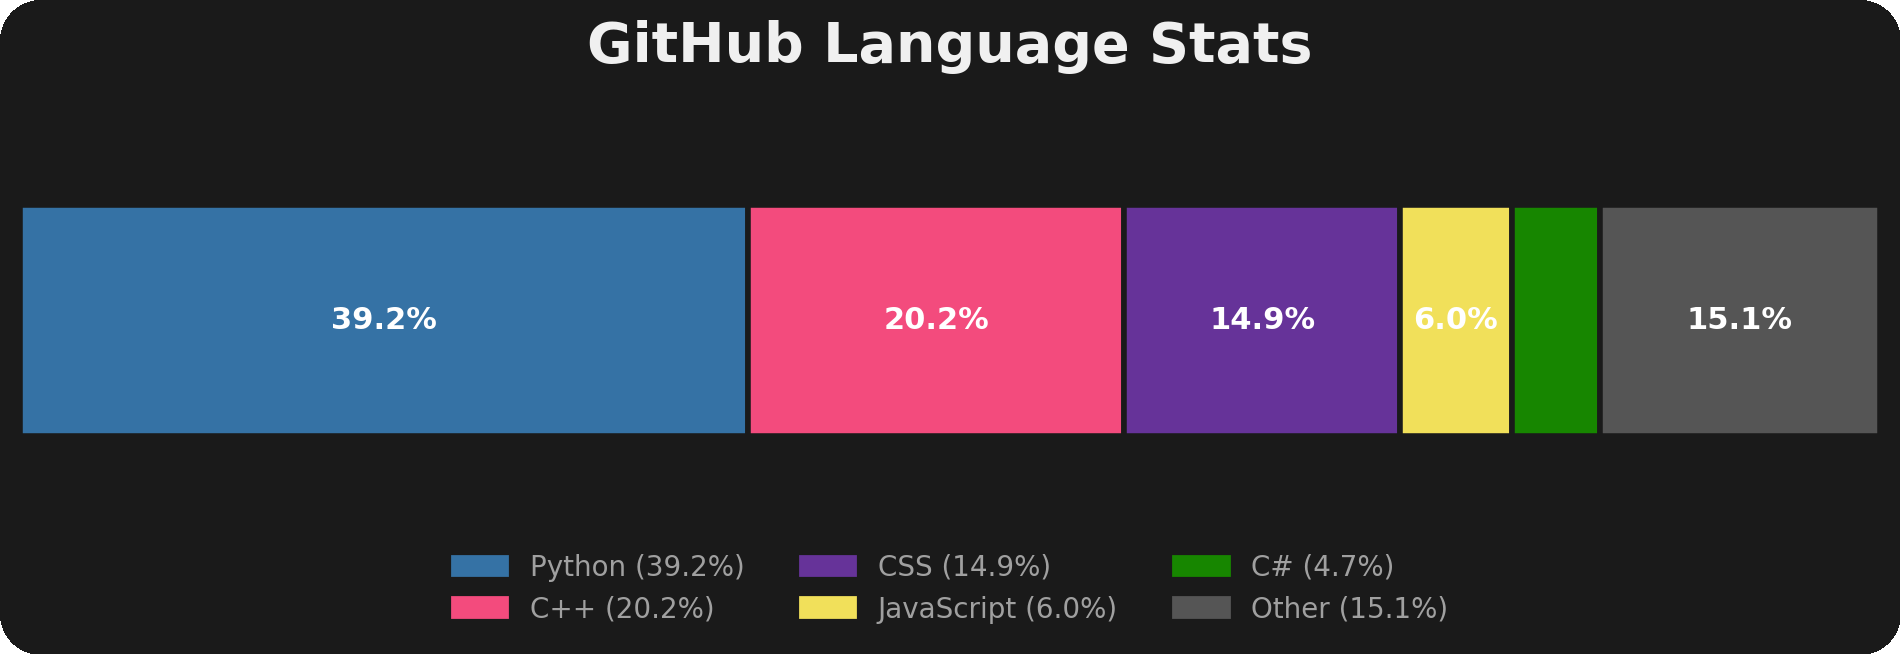
my actual language stats across all repos
- GitHub mode: Pulls stats from all your repos via the API (counts bytes)
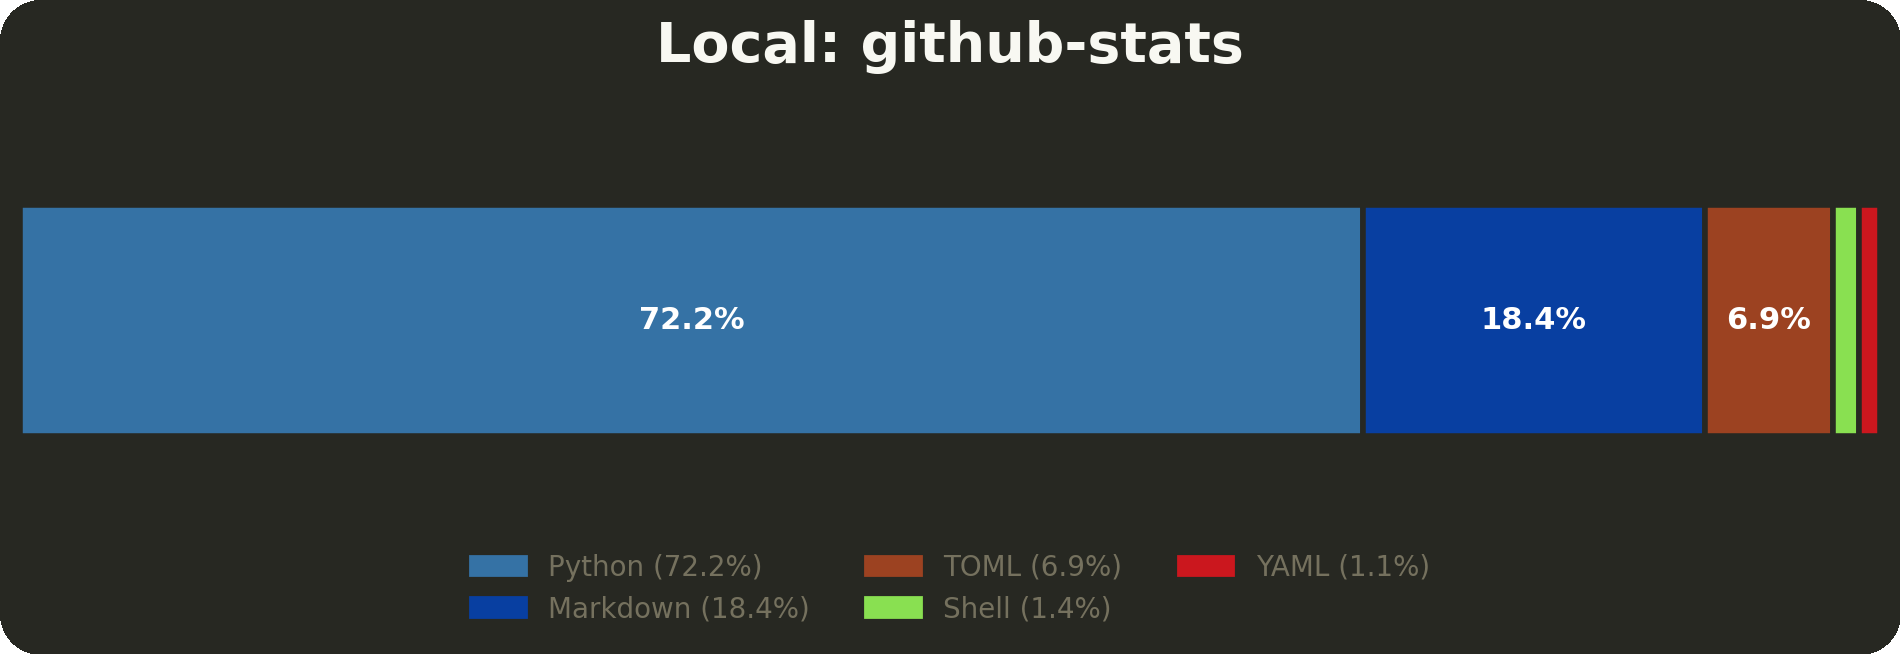
- Local mode: Analyzes files on your machine using tokount (counts lines)
Unlike tools like github-readme-stats (which generate SVG cards for your README), ghlang is a CLI tool that:
- Runs locally on your machine (Python-based)
- Analyzes local files, not just GitHub repos
- Generates downloadable charts (PNG/SVG) you can use anywhere
- Exports raw JSON data for further analysis
- Works offline for local analysis
- Gives you full control over the data
If you want embedded GitHub stats for your README, use github-readme-stats. If you want to analyze your actual codebase and generate charts you can save, share, or customize, use ghlang.
(that said, ghlang does support SVG output with --format svg, so you can totally embed your charts in READMEs too - would be cool to see people do that!)
Getting this running is pretty straightforward.
- Python 3.10+
- For GitHub mode: a GitHub token
- For local mode:
tokount
# with pipx (recommended)
pipx install ghlang

# or with pip
pip install ghlang

# or with yay (AUR)
yay -S python-ghlang

# or with paru (AUR)
paru -S python-ghlang

# or install from source
pip install git+https://github.com/MihaiStreames/ghlang.git
For local mode, you'll also need tokount:
# with cargo
cargo install tokount

# or with yay (AUR)
yay -S tokount-
Get a token from GitHub Settings
- Pick
repofor private repos, or justpublic_repofor public only
- Pick
-
Run it once to create the config file:
ghlang github
Config lives at
~/.config/ghlang/config.toml(or%LOCALAPPDATA%\ghlang\config.tomlon Windows) -
Add your token to the config:
[github]
token = "ghp_your_token_here"
-
Run it again and you're good:
ghlang github
Both github and local commands share the same options:
| Flag | Short | What it does |
|---|---|---|
--config |
use a different config file | |
--output-dir |
where to save the charts (directory) | |
--output |
-o |
custom output filename (creates _pie and _bar variants) |
--title |
-t |
custom chart title |
--top-n |
how many languages in the bar chart (default: 5) | |
--save-json |
save raw stats as JSON files | |
--theme |
chart color theme (default: light) | |
--format |
-f |
output format, overrides --output extension (png or svg) |
--json-only |
output JSON only, skip chart generation | |
--stdout |
output stats to stdout (implies --json-only --quiet) |
|
--quiet |
-q |
suppress log output (only show errors) |
--verbose |
-v |
show more details |
The local command also takes an optional [PATH] argument (defaults to .) and has one extra flag:
| Flag | What it does |
|---|---|
--follow-links |
follow symlinks when analyzing (unix only) |
The config command has its own options:
| Flag | What it does |
|---|---|
--show |
print config as formatted table |
--path |
print config file path |
--raw |
print raw TOML contents |
ghlang has built-in shell completion. To enable it:
# install completion for your shell
ghlang --install-completion

# or just view the completion script
ghlang --show-completion
After installing, restart your shell or source your config file.
Charts end up in your output directory (.png by default, or .svg with --format svg):
| File | What it is |
|---|---|
language_pie.png |
pie chart with all languages |
language_bar.png |
bar chart with top N languages |
language_stats.json |
raw stats (with --save-json) |
tokount_stats.json |
detailed tokount output (local mode, with --save-json) |
repositories.json |
list of repos analyzed (GitHub mode, with --save-json) |
github_colors.json |
language colors from GitHub (with --save-json) |
Everything lives in config.toml:
| Option | Default | What it does |
|---|---|---|
token |
- | your GitHub token |
affiliation |
"owner,collaborator,organization_member" |
which repos to include |
visibility |
"all" |
all, public, or private |
ignored_repos |
[] |
repos to skip (e.g. "org/*", "https://github.com/user/repo") |
| Option | Default | What it does |
|---|---|---|
ignored_dirs |
["node_modules", "vendor", ...] |
directories to skip |
| Option | Default | What it does |
|---|---|---|
directory |
"~/Documents/ghlang-stats" |
where to save charts |
| Option | Default | What it does |
|---|---|---|
verbose |
false |
more logging |
theme |
"light" |
chart color theme |
ghlang comes with built-in themes and supports community themes:
| Theme | Preview | Source |
|---|---|---|
light |
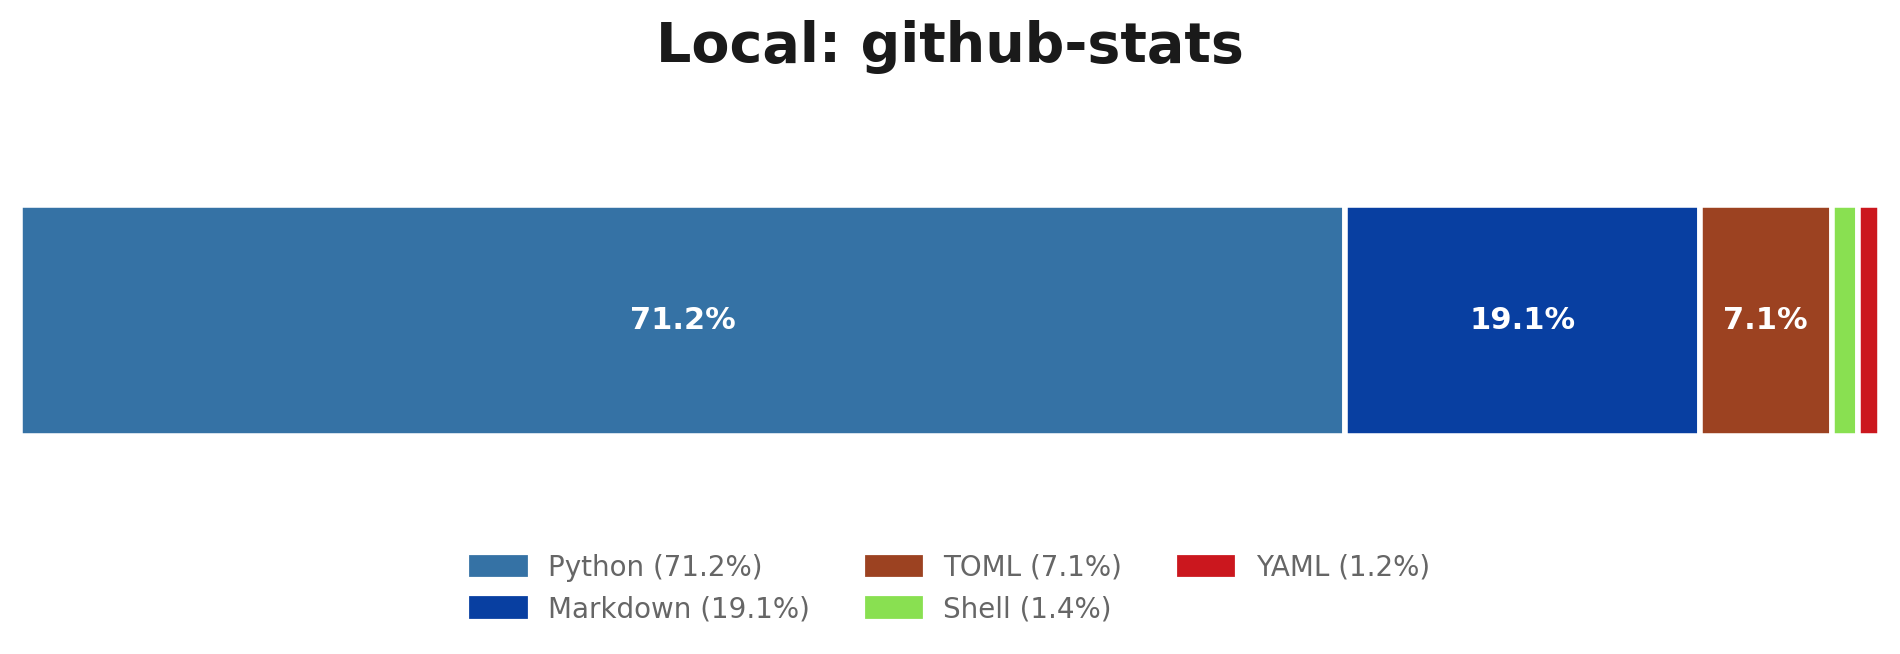 |
built-in |
dark |
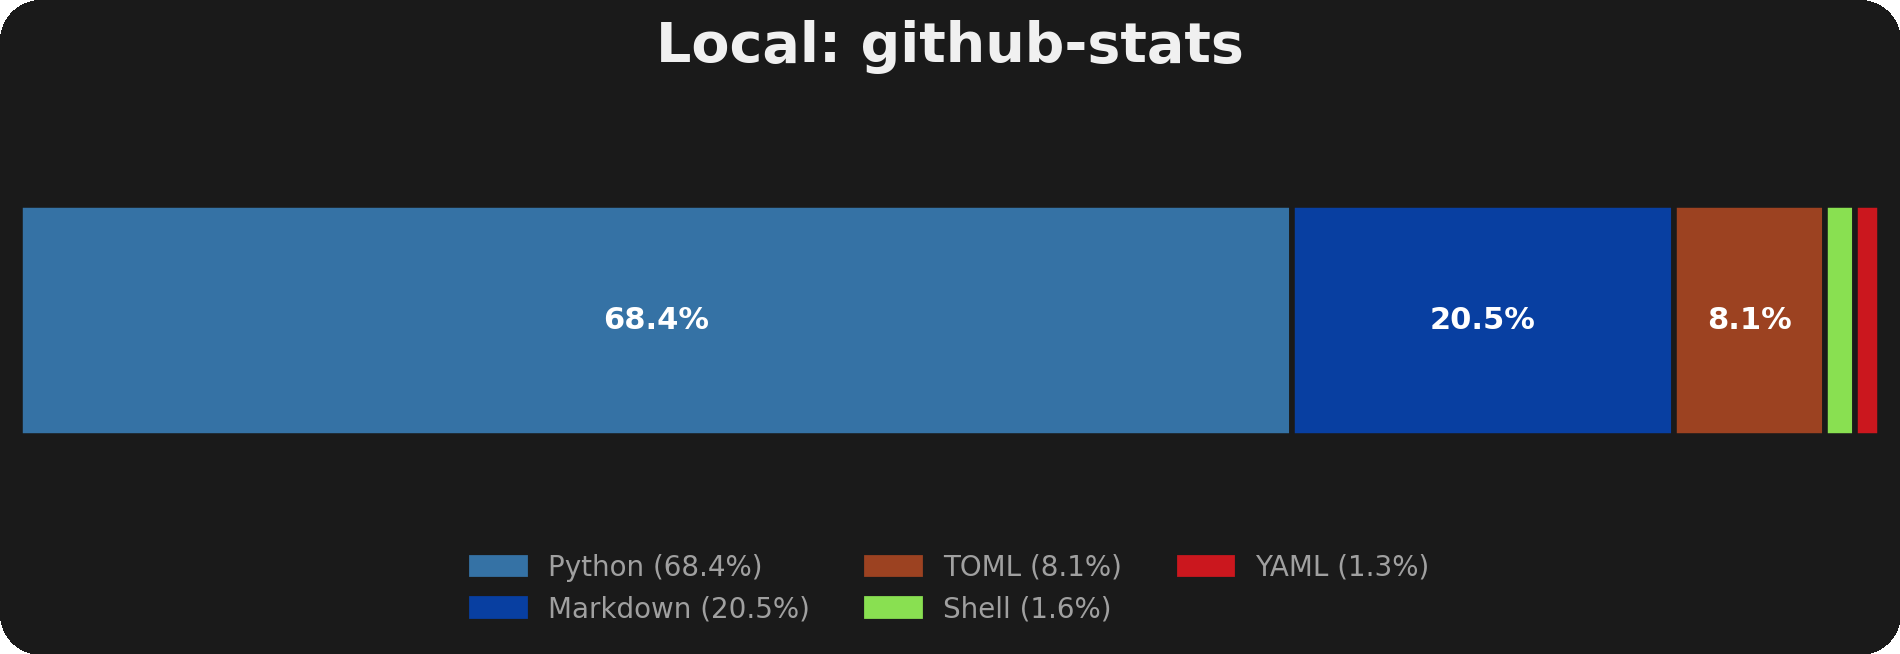 |
built-in |
monokai |
 |
community |
Using themes:
# use a theme
ghlang github --theme dark
Set default in config.toml:
[preferences]
theme = "dark"MIT. Do whatever you want with it. See LICENSE for more information.
Made with ❤️