This case study asks data analysts to support an angel investment firm by discovering top 3 performing industries in terms of the highest number of unicorn companies that they have had up to now. In the world of finance, "the term unicorn refers to a privately held startup company with a value of over $1 billion."

As well as discovering what those top industries are, an exploration work of average valuation in billions and number of unicorns per these top 3 for the years 2019, 2020 and 2021 was also undertaken.
These activities were in order to asist the organisation with pre-emptively identifying trends towards from which industries more and more high-growth companies could most likely breed in future.
The database, named after Unicorns, utilised for this project is hosted at DataCamp's proprietary servers, and as such, no data import work was required.
Fundamentally, the database consists of the following four tables:
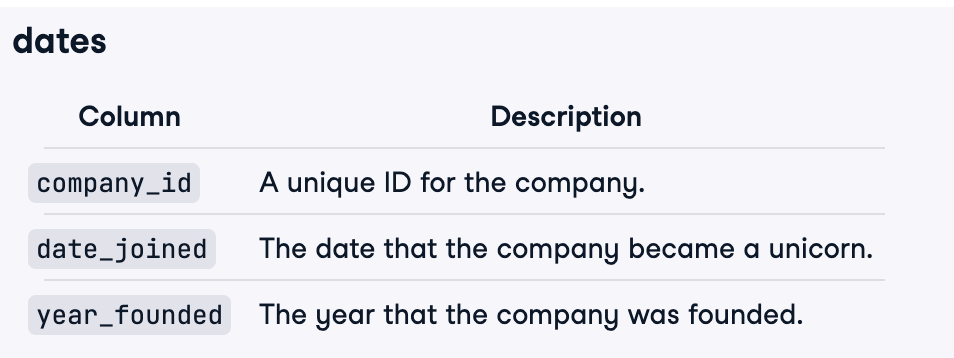
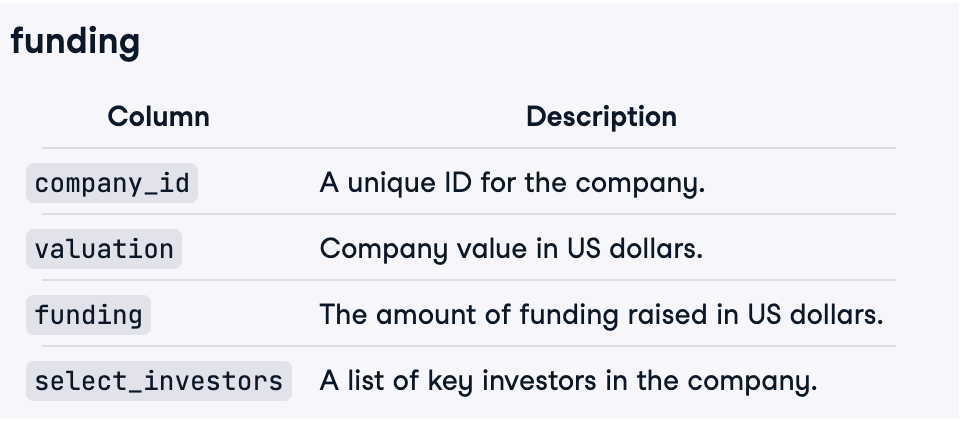


- PostgreSQL Server - Data Analysis
Within the scope of this case study, no data cleaning/handling tasks were needed to conduct.
EDA predominantly involved exploring the Unicorns database to answer key questions, such as:
- What are the top three mysterious industries based upon how many unicorn companies they have possessed up to date?
- What are the average valuations in billions for these top 3 industries, separately calculated for the years 2019, 2020 and 2021?
- How many unicorn companies do the top 3 industries possess, solely for the years 2019, 2020 and 2021?
In my opinion, the most challenging aspect of this EDA work was to recognise that without obtaining those top 3 industries' names first, it would make it almost an impossible mission to achieve the requested outcome.
Accordingly, I decided to create a table-shaped filter below only accountable for obtaining those names:
WITH FILTER_FOR_TOP3_PERFORMING_INDUSTRIES AS(

SELECT INDUSTRY, COUNT(COMPANY_ID)
FROM QUALIFIED_UNICORN_COMPANY_INFO --That's where I compiled all the required information
GROUP BY 1
ORDER BY 2 DESC
LIMIT 3 --We're only interested in Top 3 industries' names per # of Unicorns that they possess to date

)
Without this filter, our major custom-made table responsible for fetching the necessary bits from each table would also be heavily damaged.
Here below, that's where we bring our table-shaped filter into action:
SELECT DISTINCT INDUSTRY,
	YEAR,
	COUNT(COMPANY_ID) AS NUM_UNICORNS,
	ROUND(AVG(VALUATION) / 1000000000, 2) AS AVERAGE_VALUATION_IN_BILLIONS

FROM QUALIFIED_UNICORN_COMPANY_INFO --That's where I compiled all the required information, including only the years
--2019, 2020 and 2021 data required by the case study

WHERE INDUSTRY IN( --The WHERE Statement to execute our custom-made filter
	SELECT INDUSTRY
	FROM FILTER_FOR_TOP3_PERFORMING_INDUSTRIES --Our filter table
	)

GROUP BY INDUSTRY, YEAR
ORDER BY YEAR DESC, 3 DESCOur data analysis results are summarised as follows:
-
All resulting top 3 industries are in one way or another tech-related, as follows:
Top 3 Industries Fintech Internet Software & Services E-Commerce & Direct-to-Consumer -
Compared to 2019 and 2020, all these three industries in 2021 experienced three-to-six-fold increases in the total number of unicorns that they gained.
-
The increasing number of unicorns for each industry however caused the sectors at stake to go down in average valuations.
Based on the analysis, I recommend the following actions:
- Concentrate most efforts on these resulting industries for the purpose of discovering more potential unicorn companies ahead of other corporations.
- Take into account that increasing number of unicorns seems to have a negative correlation with corresponding industries' average valuation in billions.