This project explores a restaurant dataset to discover key insights related to:
- Popular cuisines
- City-wise trends and ratings
- Price range distributions
- Online delivery patterns
It's a beginner-friendly project built using Python, Pandas, and Seaborn with clean visualizations and step-by-step analysis.
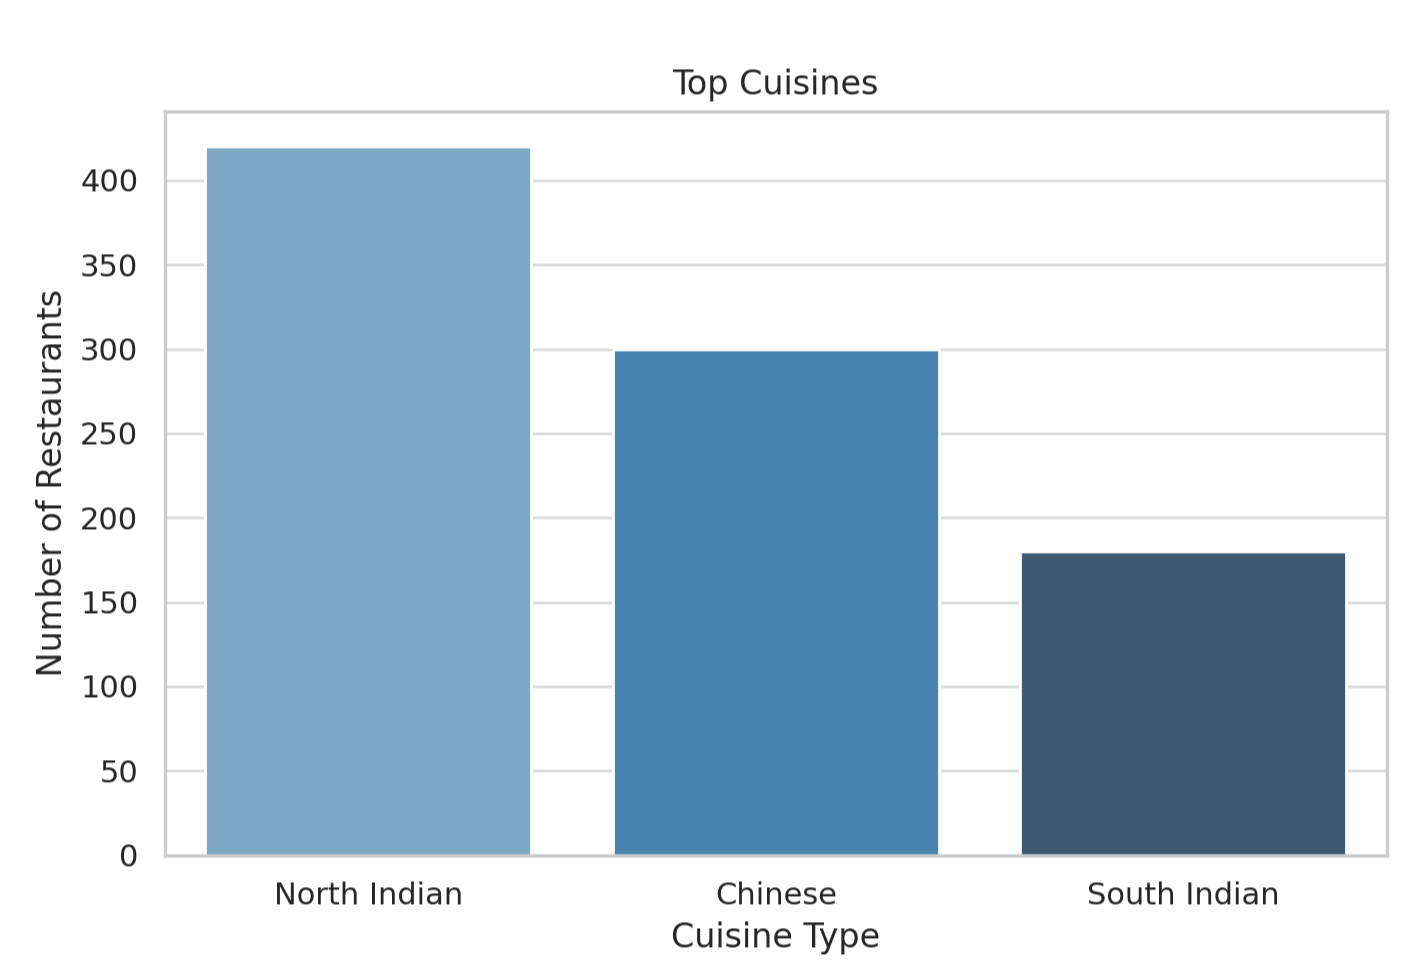
- Identified top 3 most common cuisines
- Calculated % of restaurants offering them
- Found city with most restaurants
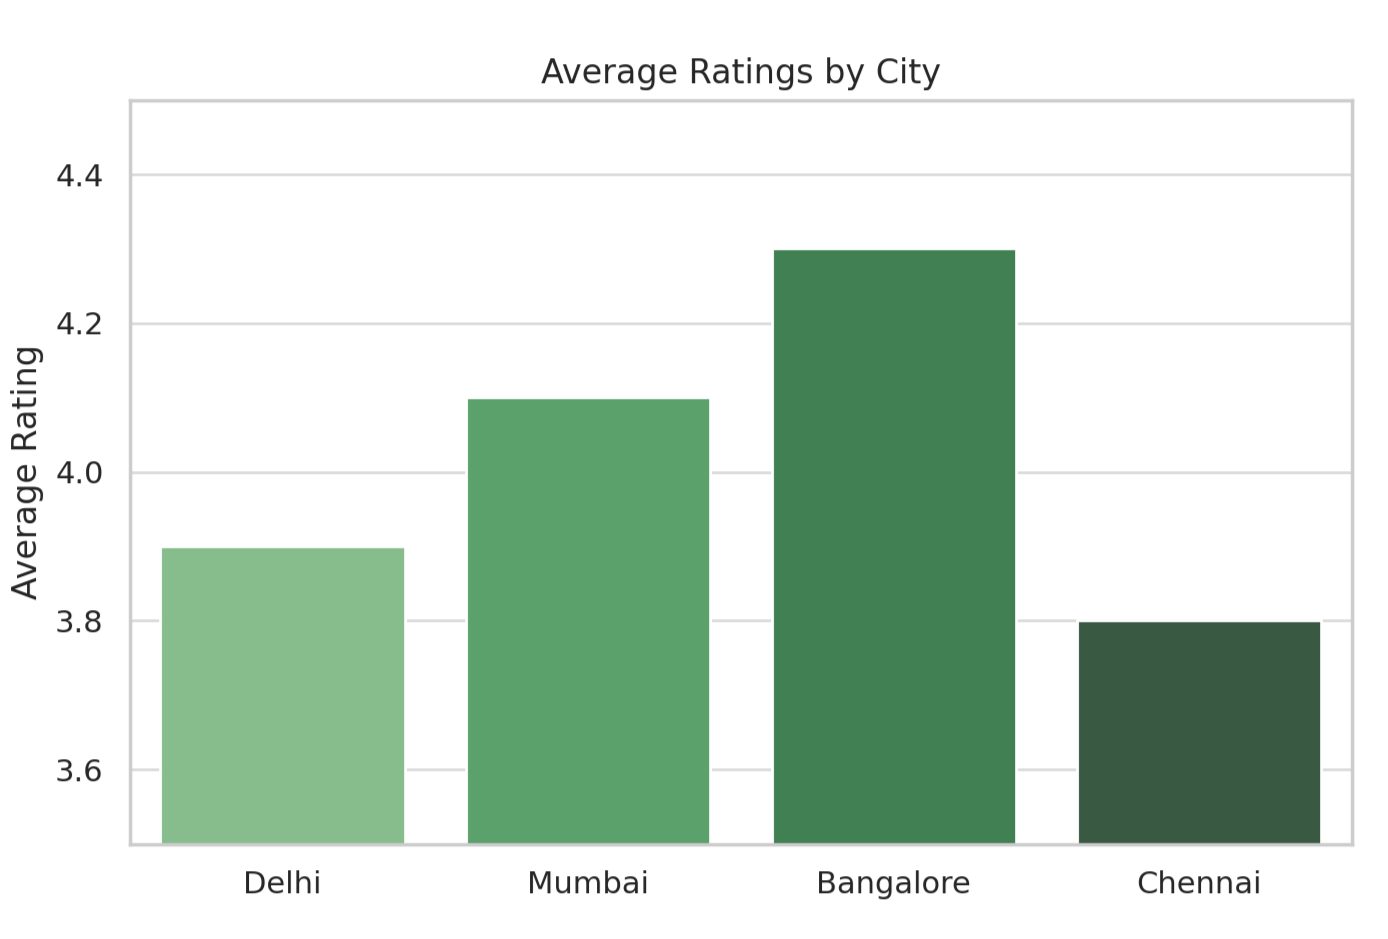
- Calculated average rating per city
- Identified city with highest average rating
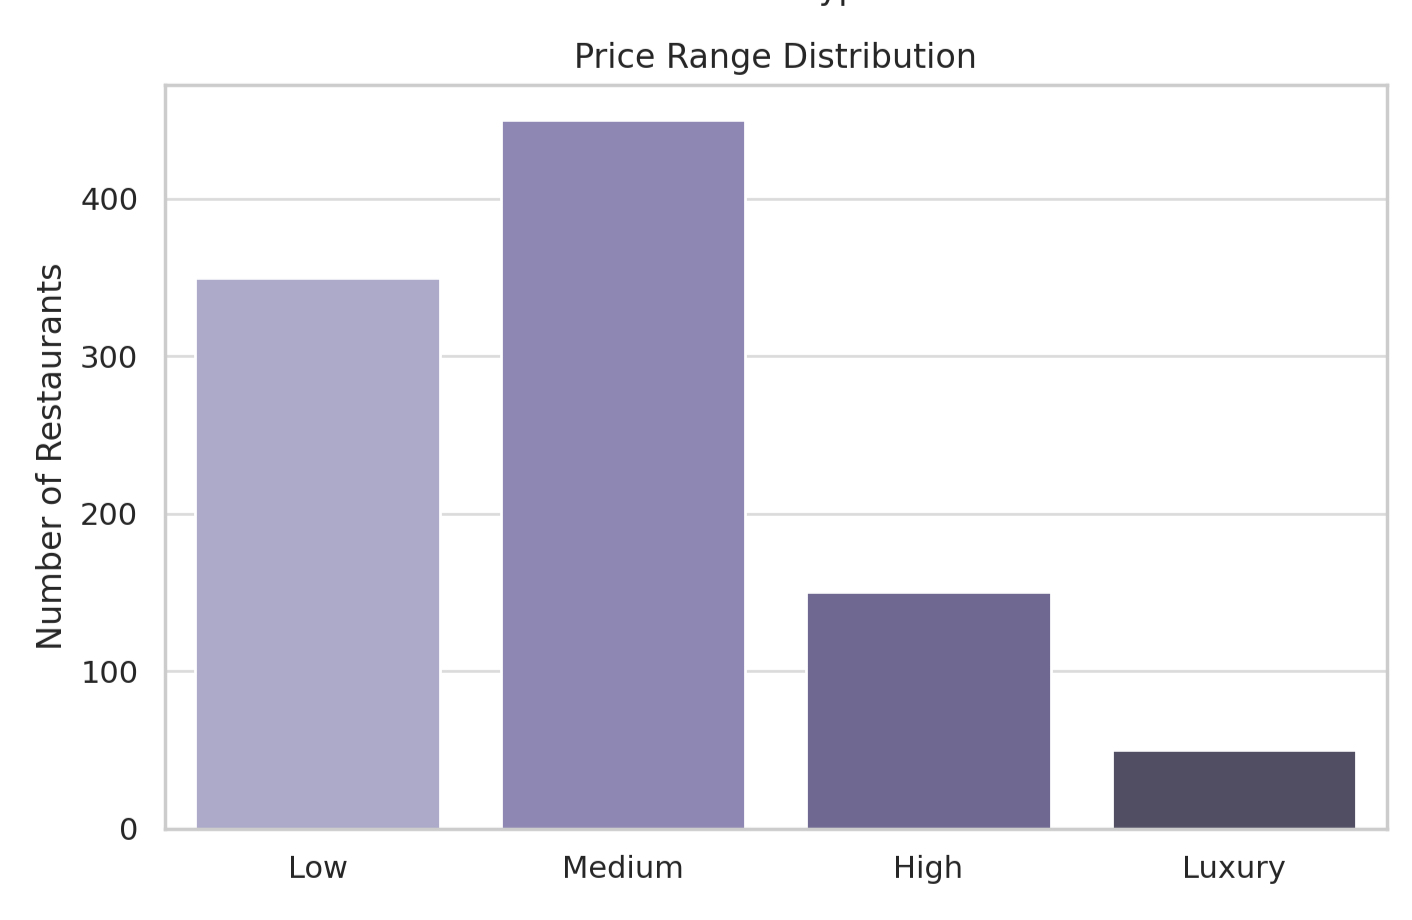
- Created bar chart of price categories
- Found % of restaurants in each range
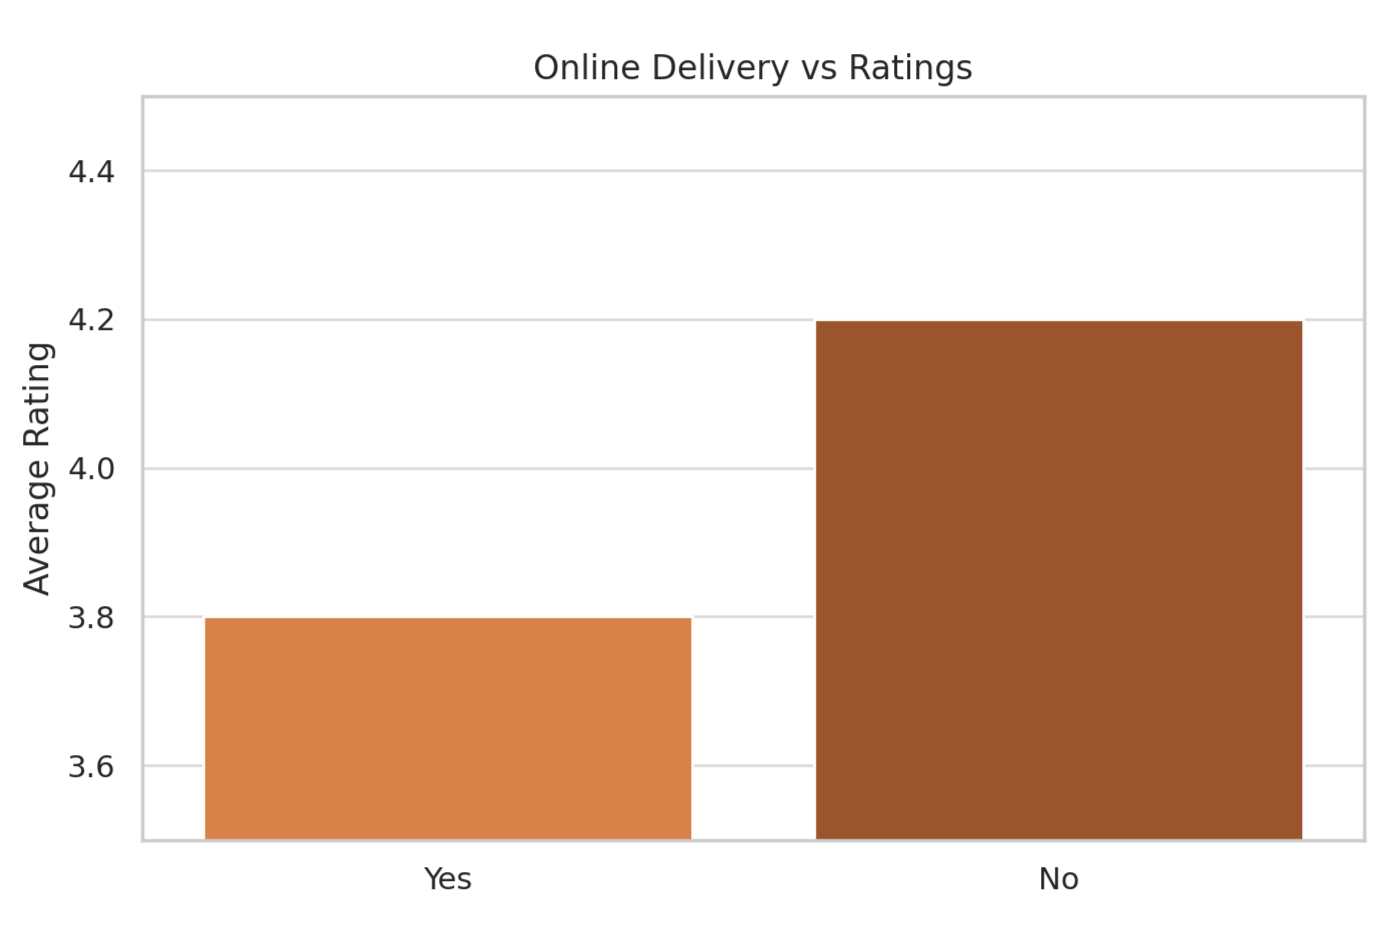
- Checked % offering delivery
- Compared ratings: with vs without delivery
- Python
- Pandas
- Matplotlib
- Seaborn
- Jupyter Notebook / Google Colab
- Clone this repository or download the ZIP.
- Open each notebook in Jupyter or Colab.
- Run cells in order to reproduce the analysis and visuals.
I'm a fresher in data science and this is one of my first real-world analysis projects.
Your feedback and suggestions are always welcome!