Inkjet Drop density – Throughput – Spread
Inkjet DTS is a minimal design model for understanding
how print quality, throughput, and dot spread
are causally coupled in inkjet printing systems.
| Language | GitHub Pages 🌐 | GitHub 💻 |
|---|---|---|
| 🇺🇸 English |
This page presents a minimal educational model for understanding the
fundamental trade-off in inkjet printing between:
- 🖨 Print quality
- ⚡ Printing speed
The model is intentionally simplified.
Its purpose is to clarify design causality, not to reproduce the behavior
of real printers or specific products.
This repository is organized to clearly separate
theoretical modeling, simulation code, and visual outputs.
inkjet-dts/
├─ _config.yml
├─ index.md
├─ README.md
│
├─ _layouts/
│  └─ default.html
│
├─ _includes/
│  └─ head.html
│
├─ assets/
│  └─ css/
│     └─ style.css
|
├─ demo/
│  ├─ index.html
│  └─ demo.js
│
├─ code/
│  ├─ main.py
│  ├─ model.py
│  └─ render.py
│
└─ images/
   ├─ print_fast.png
   ├─ print_high_quality.png
   ├─ print_large_dot.png
   └─ print_small_dot.png
- 📁
code/contains a minimal but explicit Python model of inkjet trade-offs - 🖼
images/visualizes how parameter choices affect dot spread and print quality - 🌐 GitHub Pages is used to document the model, not to execute it
This separation keeps the system easy to understand, extend, and reuse
for educational purposes.
Inkjet printing behavior can be reduced to three dominant axes:
-
D — Drop density
Number of ink drops per unit area
→ governs graininess and perceived image quality -
T — Throughput
Ink ejection capability per unit time
→ limits achievable printing speed -
S — Spread
Dot spread on the medium (ink–paper interaction)
→ determines sharpness versus bleeding
Most practical parameters
(dpi, passes, drop size, color count, nozzle count)
can be expressed as combinations of these three axes.
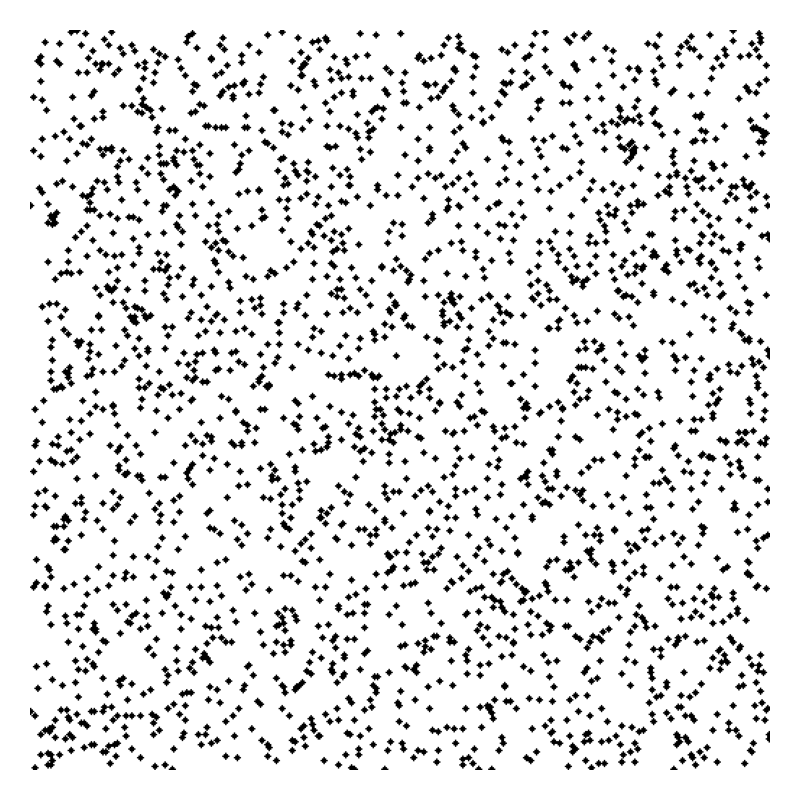
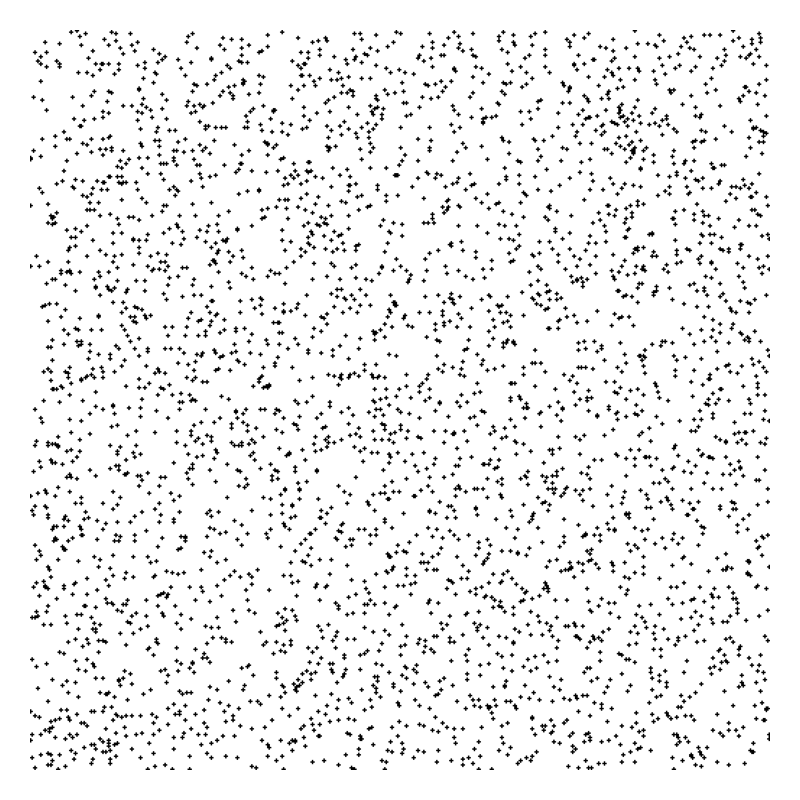
Lower drop density (FAST mode)
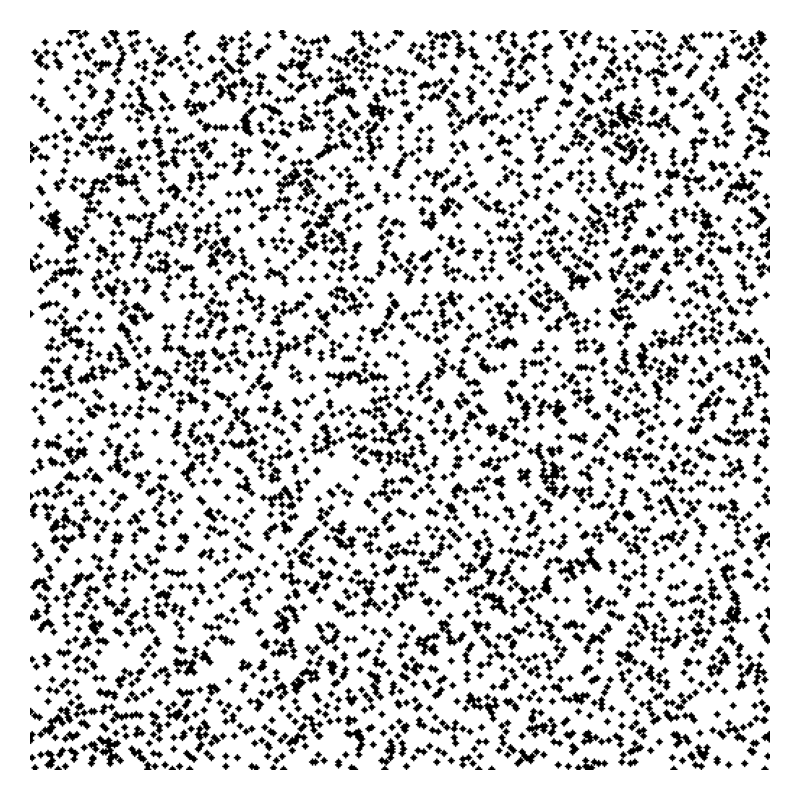
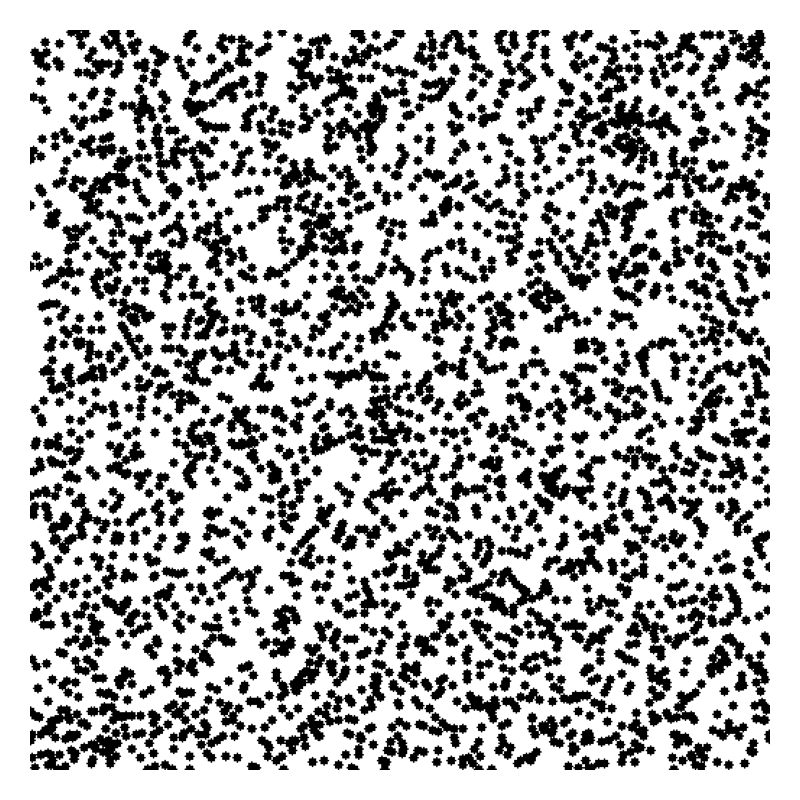
Higher drop density (HIGH QUALITY mode)
Small dot (sharper edges)
Large dot (increased bleeding)
Inkjet DTS (Drop Density – Throughput – Spread)
This interactive demo provides a conceptual visualization of the
fundamental trade-off in inkjet printing:
- 💧 Drop Density (D) — number of ink droplets per unit area
- ⚡ Throughput (T) — printing speed / firing frequency
- 🌊 Spread (S) — dot expansion caused by fluid dynamics and substrate interaction
By adjusting these three parameters, the demo illustrates how
print quality and printing speed inherently compete with each other.
The visualization is based on a synthetic, educational model intended
to build intuition — it does not represent measured data or a
device-specific simulation.
- 🧪 The images shown above are synthetic visualizations, not measured print data
- 👀 They are designed to make qualitative differences immediately visible
- 🎯 Numerical accuracy and product-specific tuning are intentionally out of scope
This project is intended to support:
- engineering education
- early-stage design discussions
- clear explanation of inkjet trade-offs
by keeping the model simple, executable, and visual.
| 📌 Item | Details |
|---|---|
| Name | Shinichi Samizo |
| Expertise | Semiconductor devices (logic, memory, high-voltage mixed-signal) Thin-film piezo actuators for inkjet systems Printhead productization, BOM management, ISO training |
| GitHub |
| 📌 Item | License | Description |
|---|---|---|
| Source Code | MIT License | Free to use, modify, and redistribute |
| Text Materials | CC BY 4.0 or CC BY-SA 4.0 | Attribution required; share-alike applies for BY-SA |
| Figures & Diagrams | CC BY-NC 4.0 | Non-commercial use only |
| External References | Follow the original license | Cite the original source properly |
Suggestions, improvements, and discussions are welcome via GitHub Discussions.